



Ein Link zum Festlegen deines Kennworts wurde gesendet an: Um in Zukunft auf deine Käufe zugreifen zu können, benötigst du ein Kennwort.
Erhalte 10 Stock-Bilder mit einer kostenlosen Testversion.
Neue Filter hinzugefügt
Sortieren nach

105.232 Ergebnisse für volatility chart in „alle“

13.078 Ergebnisse in Video
Slow Dolly-in Through a Stock Exchange Asset Management Firm, Where a Stockbroker Ceo Studies Live Charts, Weighing Banking Decisions, Strategy and Capital Growth for Corporate Career Success
00:13
HD
Financial candlestick charts showing market volatility on dark grid
00:15
HD
Abstract stock market digital display showing green and red financial data, trading indices and stock price fluctuation charts
00:10
HD
Digital charts global map rising market curves. financial technology, market volatility, economic research, portfolio analysis, trading dashboards, global growth, corporate strategy business news.
00:20
HD
Person using smartphone with stock market charts on screen. Trader analyzing financial data on trading app. Concept of online trading, investment analysis and financial risk
00:12
HD
Finance growth chart graph stock market upward data analysis business abstract background with rising green line over bar graph showing market trend investment statistic concept digital chart
00:10
HD
Close-up of financial charts displaying stock market data on a digital screen. Dynamic red and green graphs represent fluctuating stock prices in a modern trading environment.
00:10
HD
A dynamic close-up timelapse of candlestick charts rising and falling on a trading screen, reflecting market volatility and momentum
00:09
HD
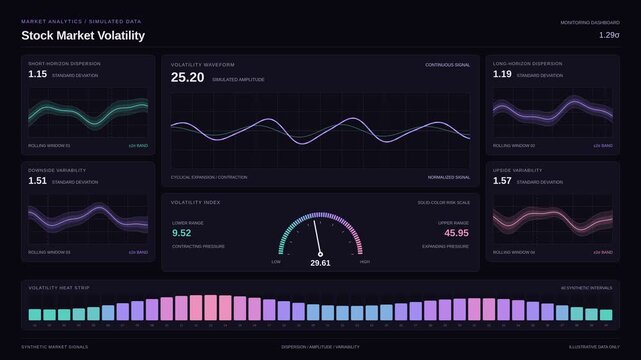
Stock market volatility dashboard showing financial data charts and digital gauge interface
00:15
HD
Seamless looped abstract visualization of financial data, price fluctuations, investment analysis and trading activity. Financial market interface with changing charts. Forex trading concept
00:10
HD
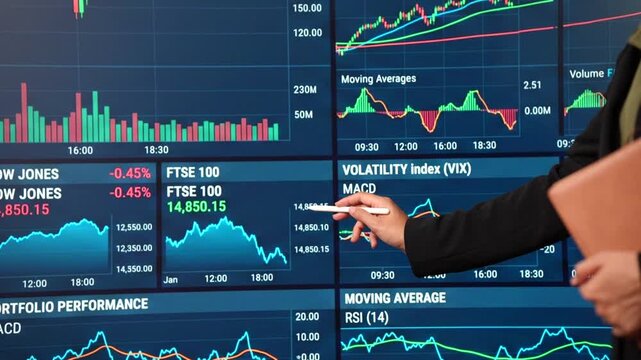
Business analyst points at digital market charts showing stock prices, trading volume, moving averages and volatility on multiple screens.
00:13
HD
Abstract financial chart with glowing digital candlestick data points moving across dark screen representing stock market volatility investment analysis business growth and economic trends.
00:10
HD
Abstract digital candlestick chart with global financial data background, perfect for trading, forex, crypto, and investment presentations. Financial Investment Background. 3d Rendering.
00:20
HD
Glowing red neon downward graph with arrow indicating decline, loss, and negative trends on a dark, abstract background, perfect for conveying risk, crisis animation.Right-directional arrow loop.4k
00:10
HD
3D panel entering lower-right, rotating, revealing live volatility charts on transparent background
00:10
HD
Businessperson pointing at digital financial charts showing stock prices, volatility index, macd and moving averages on a trading screen.
00:12
HD
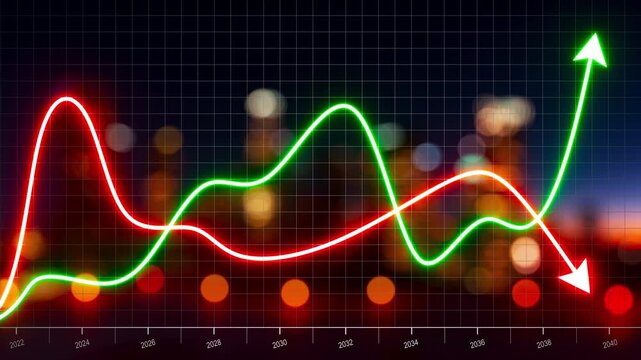
Looped 3D animation of red and green financial charts crossing over blurred city lights, showing market volatility, growth and decline, investment trends, competition and economic change.
00:10
HD
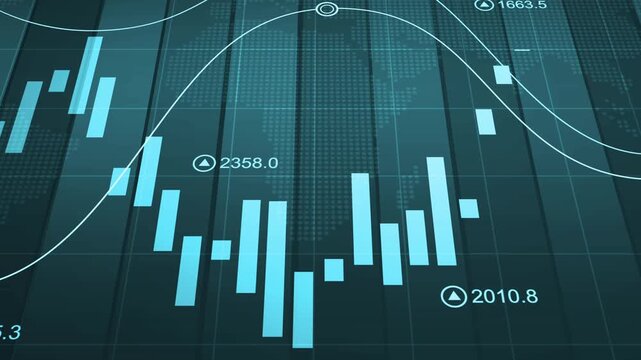
Financial market chart with candlesticks and line graph, Abstract financial chart with candlestick bars and line graphs market analysis growth and data trends animation
00:10
HD
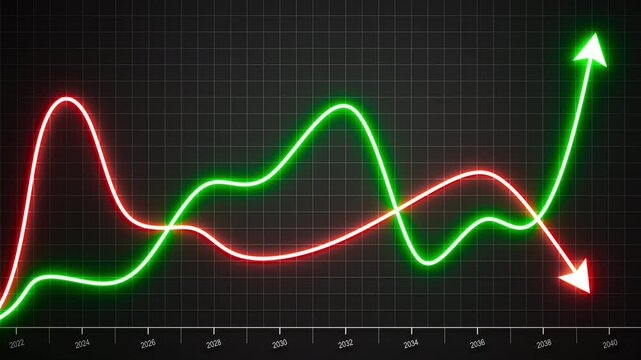
Looped 3D animation of green and red financial charts crossing over time, showing market volatility, growth and decline, investment trends, competition, economic change and stock performance.
00:10
HD
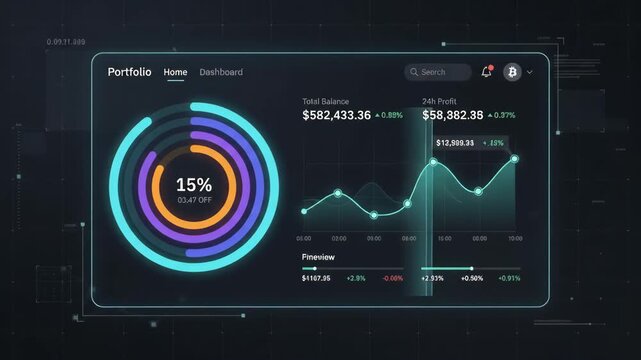
digital financial dashboard showing colorful circular charts with cryptocurrency market price fluctuations displayed against dark tech-themed interface background with grid lines and data nodes
00:06
HD