Ein Link zum Festlegen deines Kennworts wurde gesendet an: Um in Zukunft auf deine Käufe zugreifen zu können, benötigst du ein Kennwort.
Kreativität ohne Ende – unbegrenzte Downloads plus leistungsstarke KI-Bearbeitung.
Neue Filter hinzugefügt
Sortieren nach

13.461 Ergebnisse für volatility chart in „Videos“

Businessperson using a tablet with glowing stock market charts and financial data on screens in the background.
00:10
HD
Abstract financial chart with glowing digital candlestick data points moving across dark screen representing stock market volatility investment analysis business growth and economic trends.
00:10
HD
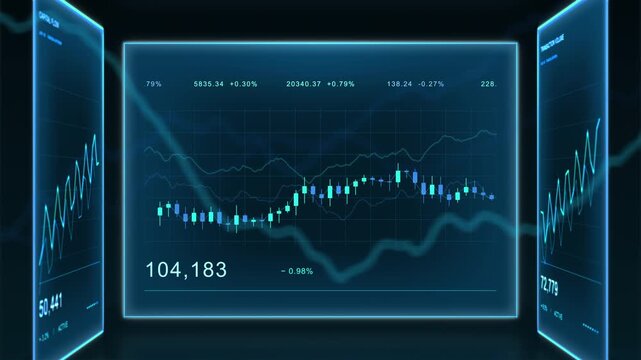
Close-up of financial charts displaying stock market data on a digital screen. Dynamic red and green graphs represent fluctuating stock prices in a modern trading environment.
00:10
HD
Financial market data animation video showing real time trading charts, investment analytics, business growth metrics, economic indicators, and performance trends visualization
00:08
HD
Financial charts rising teal percentage seamless loop
00:15
HD
Seamless looped abstract visualization of financial data, price fluctuations, investment analysis and trading activity. Financial market interface with changing charts. Forex trading concept
00:10
HD
Abstract digital candlestick chart with global financial data background, perfect for trading, forex, crypto, and investment presentations. Financial Investment Background. 3d Rendering.
00:20
HD
Finance growth chart graph stock market upward data analysis business abstract background with rising green line over bar graph showing market trend investment statistic concept digital chart
00:10
HD
Multi line chart indicator blur candlestick chart on background screen, technical price graph and indicator, analysis investment portfolio volatility signal
00:20
HD
Digital charts global map rising market curves. financial technology, market volatility, economic research, portfolio analysis, trading dashboards, global growth, corporate strategy business news.
00:20
HD
Glowing red neon downward graph with arrow indicating decline, loss, and negative trends on a dark, abstract background, perfect for conveying risk, crisis animation.Right-directional arrow loop.4k
00:10
HD
Candlestick Bearish Market
00:07
HD
Line chart rise and sudden drop suggesting market volatility and financial decline animation
00:06
HD
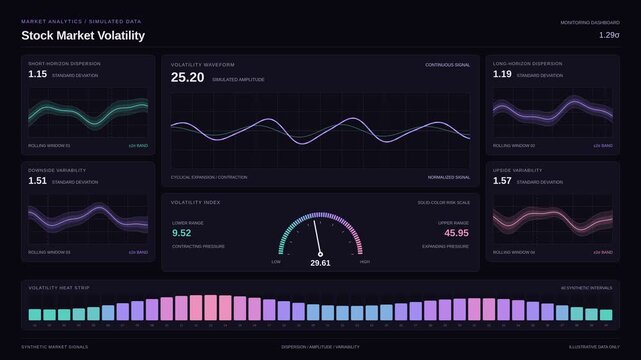
Stock market volatility dashboard showing financial data charts and digital gauge interface
00:15
HD
Stock market analysis with candlestick chart and price movement trend line, highlighting global financial trends, stock trading, and investment strategy insights Marrow
00:10
HD
Slow Dolly-in Through a Stock Exchange Asset Management Firm, Where a Stockbroker Ceo Studies Live Charts, Weighing Banking Decisions, Strategy and Capital Growth for Corporate Career Success
00:13
HD
Digital stock market chart showing fluctuating green and red candlestick patterns on a dark blue background to represent financial trading trends and volatility for global investment analysis.
00:10
HD
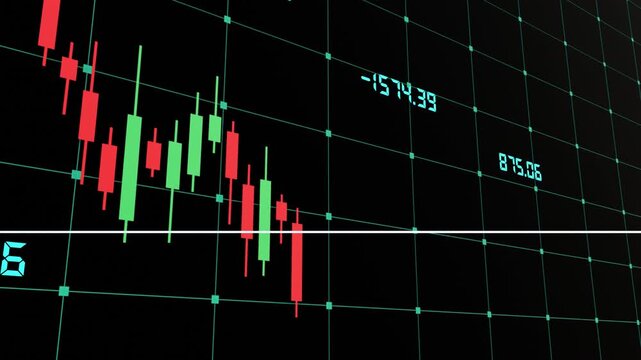
Financial stock market chart with green and red candlestick bars moving dynamically on screen
00:10
HD
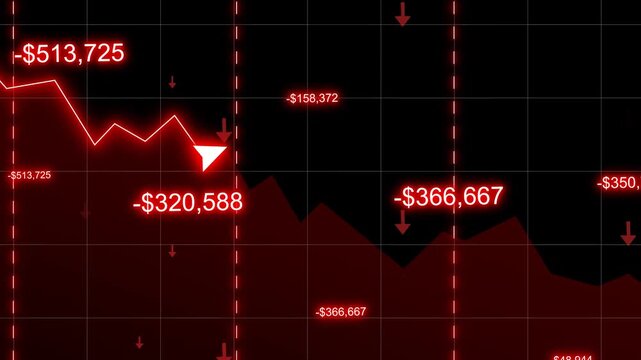
Financial Loss Graph Animation Showing A Dramatic Stock Market Crash With Falling Red Chart Line, Negative Dollar Values, Downward Arrows. Concept Of Economic Recession, Volatility, Investment Failure
00:19
HD
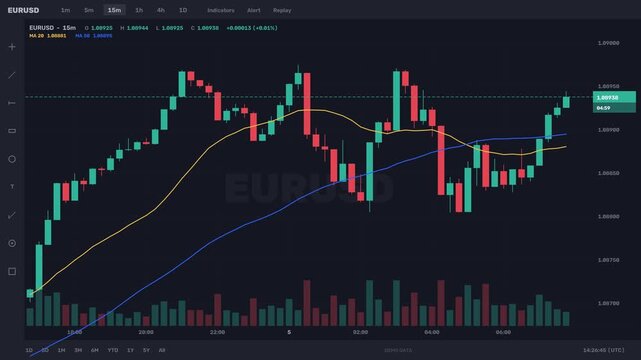
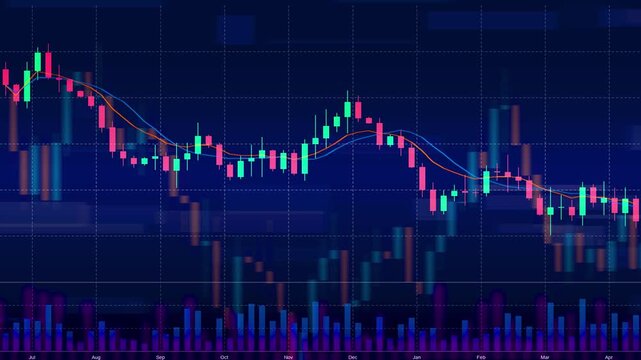
Candlestick chart analysis with moving averages during volatile market conditions
00:06
HD
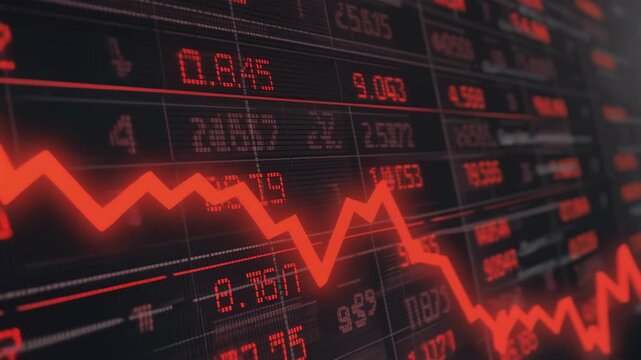
Businessperson pointing at digital financial charts showing stock prices, volatility index, macd and moving averages on a trading screen.
00:12
HD
Abstract Financial Stock Market Charts Displaying Multiple Rising Trends Over Dark Background
00:20
HD
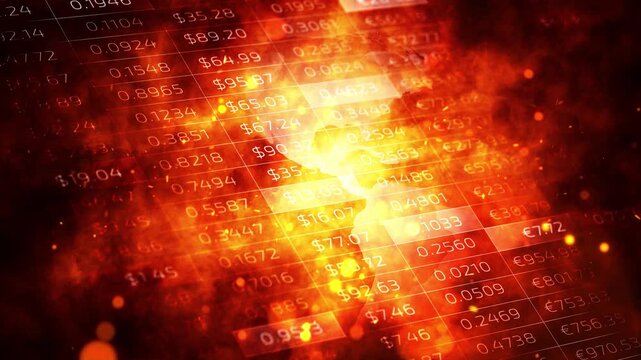
A dynamic close-up timelapse of candlestick charts rising and falling on a trading screen, reflecting market volatility and momentum. trading bots, algorithmic trading, AI assistant agents
00:10
HD
Volatile stock market trading animation with glowing orange price chart, financial trend analysis, investment risk, market fluctuation and digital fintech business background video
00:08
HD
Stock market trading dashboard showing candlestick charts, market depth, analytics and financial data visualization.
00:20
HD
Stock Market Trading Charts on Multiple Monitors with Colorful Candlesticks and Financial Data
00:10
HD
Looped 3D animation of a glowing neon financial chart with a fluctuating line, sharp market drop and strong upward growth, representing trading, volatility and business analytics.
00:10
HD
Financial risk chart with market volatility data multicolor
00:15
HD
Small multi window charts stock and market report, trading Infographic Index Indicator, close up shot dark blue screen display, price numbers volatility fluctuation
00:20
HD
Red bearish stock market candlestick chart with falling price ticker on angled trading screen
00:15
HD
Futuristic barrels, one adorned with the American flag, stand on a digital map of the USA. ..Created with Generative AI, not depicting real subjects.
00:10
HD
Abstract Digital Financial Candlestick Chart with Glowing Blue and Pink Bars on Dark Background
00:20
HD
Line chart rise and sudden drop suggesting market volatility and financial decline animation
00:06
HD
Person using smartphone with stock market charts on screen. Trader analyzing financial data on trading app. Concept of online trading, investment analysis and financial risk
00:12
HD
Candlestick chart visualizing financial market trends, investment patterns, price fluctuations, and trading strategy in capital and digital asset markets Marrow
00:10
HD
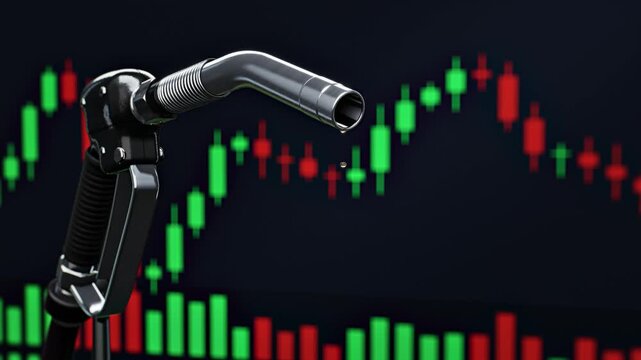
Gas Pump Nozzle Dripping Fuel in Front of Stock Market Candlestick Chart Rising Gas Prices Oil Price Volatility Fuel Crisis Energy Crisis Inflation Economy
00:24
HD
Financial Market and Heartbeat Graph Overlay — Business Chart and Pulse Line on Dark Screen
00:13
HD
Camera slowly pulls back from a central stock trading chart, passing blurred candlesticks and glowing financial displays. Futuristic animation of market data, trading and investment analysis.
00:20
HD
Trader Analyzing Market Chart on Smartphone
00:29
HD
Animated candlestick stock market chart showing upward and downward trends over time on a dark blue background.
00:10
HD
Financial candlestick chart motion graphic loop showing stock market volatility and currency trading activity in digital video footage
00:08
HD
A dynamic timelapse video featuring fast moving stock market candlestick bars blended with a close up portrait of Benjamin Franklin from a 100 dollar bill, representing cash, wealth, and trading.
00:29
HD
Close-up of hands pointing at stock market charts on a computer screen during trading analysis, finance data, prices, and market trends.
00:18
HD
4K glowing cyan volatile line chart drawing animation on dark background loop
00:05
HD
A monitor display showing the real-time movement of stock charts and financial instruments.
00:20
HD
Financial candlestick chart showing market volatility on a dark background loop.
00:15
HD
Abstract financial chart with candlesticks, bar graphs and upward arrow animation
00:09
HD
Falling red stock chart line graph declining animation seamless loop 4K finance background
00:20
HD
Small multi window charts stock and market report, trading Infographic Index Indicator, close up shot dark blue screen display, price numbers volatility fluctuation
00:20
HD
Cryptocurrency candlestick trading chart with bullish and bearish price action moving on dark screen
00:10
HD
A dynamic close-up timelapse of candlestick charts rising and falling on a trading screen, reflecting market volatility and momentum. trading bots, algorithmic trading, AI assistant agents
00:10
HD
Market volatility candlestick chart animation on dark ui after effects
00:10
HD
Financial market chart with candlesticks and line graph, Abstract financial chart with candlestick bars and line graphs market analysis growth and data trends animation
00:10
HD
Red glowing financial chart and graph with sharp downward trend, digital sparks highlighting financial decline, market crash, economic downturn, business loss, investment risk, and volatility trend
00:08
HD
Stock market analysis with candlestick chart and price movement trend line, highlighting global financial trends, stock trading, and investment strategy insights Marrow
00:10
HD
Investor holding a stylus pen to analyze colorful stock price charts on a digital screen, representing financial technology, market trading, investment strategy, and data-driven decision making. 4k.
00:09
HD
Glowing financial chart with neon lines in digital style on dark background, concept of data analysis and market trends
00:10
HD
Animated financial charts fluctuate as market figures update and a glowing arrow rises across a world map. Concept of stock market trends, investment growth and global financial analysis.
00:20
HD
Financial Trading Chart With Green and Red Candlesticks Showing Market Volatility
00:10
HD
Dynamic financial candlestick chart showing stock market price fluctuations and data analysis for investment, trading, and business concepts on a digital display with a shallow depth of field
00:09
HD
Red stock charts scrolling endlessly on a trading screen loop
00:10
HD
A dynamic timelapse video featuring fast moving stock market candlestick bars blended with a waving American flag, representing US economy, financial markets, and Wall Street trading.
00:27
HD
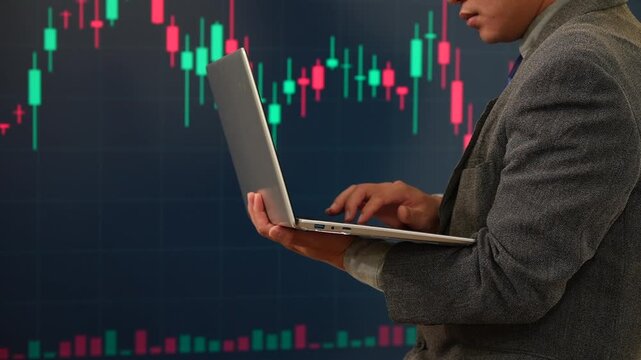
Businessman using a laptop in front of a glowing stock market chart with red and green candlesticks, showing online trading and financial analysis.
00:12
HD
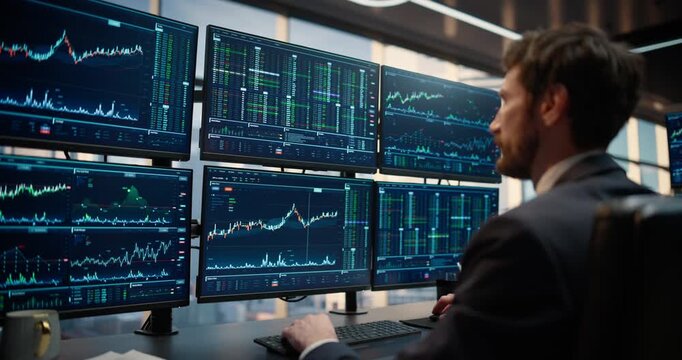
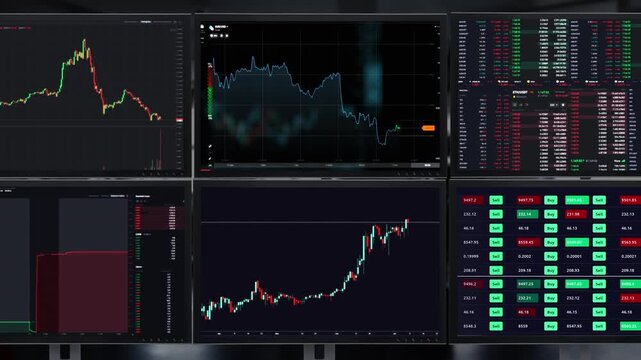
Wall of trading monitors with charts and quotes. Broker workplace, market data and investment office
00:10
HD
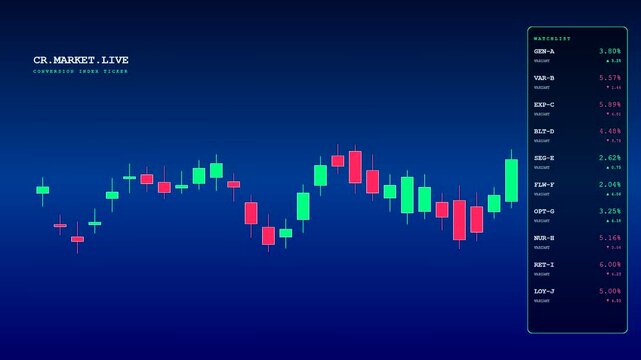
An animated digital screen displays a Conversion Rate Tracker with fluctuating candlestick charts and a dynamic watchlist showing real time financial market movement
00:06
HD
Looped financial market candlestick chart with changing trends. Seamless loop visualizes financial data, price fluctuations, investment analysis and trading activity on abstract blue background
00:10
HD
a digital financial candlestick chart and trendline with cyan and purple and magenta neon bars on a dark background, representing stock market data, price action, or trading volatility
00:05
HD
Magnifying glass over a declining stock market chart with red and green candlesticks, concept of investment analysis, financial risk and market volatility for investors
00:06
HD
Small multi window charts stock and market report, trading Infographic Index Indicator, close up shot dark blue screen display, price numbers volatility fluctuation
00:20
HD
Candlestick chart animation with rising trend, sharp red crash and green breakout recovery on dark grid
00:15
HD
Black and white business market volatility and bearish breakdown chart animation
00:11
HD
Algorithmic Trading Signal Generation Chart
00:06
HD
Financial market chart with candlesticks and line graph, Abstract financial chart with candlestick bars and line graphs market analysis growth and data trends animation
00:10
HD
Hand pointing at a stock market chart on a computer screen in a dark office
00:21
HD
Candlestick chart visualizing financial market trends, investment patterns, price fluctuations, and trading strategy in capital and digital asset markets Marrow
00:10
HD
Financial candlestick chart showing market volatility with rising and falling trends in trading
00:12
HD
Bitcoin price chart showing market volatility on a digital trading
00:14
HD
Animated financial chart with green and red candlesticks. Stock market data visualization showing price fluctuations. Trading analytics dashboard on dark background. 4K motion graphics.
00:15
HD
Stock market trading chart showing dynamic price fluctuations. 4K. 2D Animation. Flat Animation. Seamless Loop.
00:10
HD
abstract visualization of financial data, price fluctuations, investment analysis and trading activity. Financial market with changing charts. Forex trading concept.
00:20
HD
Financial charts rising dark blue percentage seamless loop
00:15
HD
Stock market chart financial graph red candlestick showing downward trend business risk economic decline investment loss market volatility financial crisis analysis hands gesture concern control
00:10
HD
Businessperson using a tablet with trading charts in front of large market screens, showing stock analysis, financial data, and investment technology.
00:11
HD
Candlestick chart moving on a forex trading screen. Stock market indexes, investment data and crypto trading
00:15
HD
A dynamic close-up timelapse of candlestick charts rising and falling on a trading screen, reflecting market volatility and momentum
00:29
HD
Green red candlestick chart on digital trading screen showing price movement and volume with numeric overlays and grid lines conveying market volatility analysis for stock market finance trading
00:08
HD
Global crude oil price surge illustrated on an industrial oil barrel with glowing market chart and world map, representing energy crisis and geopolitical economic impact.
00:08
HD
Futuristic blue bar chart with rising arrow symbolizing financial growth and business success
00:10
HD
Multi line chart indicator blur candlestick chart on background screen, technical price graph and indicator, analysis investment portfolio volatility signal
00:20
HD
Abstract financial trading background with purple candlestick chart patterns and neon glowing effects.
00:10
HD
Stockmarket graph animation - Chart going up and down showing volatility in markets and economy.
00:10
HD
Bustling stock exchange floor merges with digital overlay of real-time market data. Traders react to fluctuating graphs and charts floating in augmented reality space.
00:10
HD
Financial market chart with candlesticks and line graph, Abstract financial chart with candlestick bars and line graphs market analysis growth and data trends animation
00:10
HD
Dynamic Stock Market Chart: Vibrant orange and blue candlestick chart on a dark background depicts dynamic stock market trends, capturing the energy and volatility of financial trading.
00:10
HD
Economic caution visualized with fluctuating market graph, alert symbols, and negative data trends. Represents financial risk, market volatility, and economic uncertainty. Elide
00:14
HD
Global Stock Market Dashboard with Live Charts and Financial Data, Digital Stock Market Interface Showing Price Movements, Financial Trading Screen with Market Volatility and Growth Trend
00:30
HD
Falling stock market red chart
00:10
HD
Stock market data grid over intense fire and smoke background, glowing numbers and charts symbolizing financial crisis, inflation, and volatile global economy. Animation.
00:30
HD
Animated Green and Red Candlestick Chart Rising on Black Background
00:30
HD
4K glowing gold volatile line chart drawing animation on dark background loop
00:05
HD