En länk till val av lösenord har skickats till: För att komma åt dina inköp behöver du ett lösenord.
Du får tio Stock-bilder med en kostnadsfri testversion
Nya filter har lagts till
Sortera efter

171 714 resultat för compare chart i alla

14 059 resultat i video
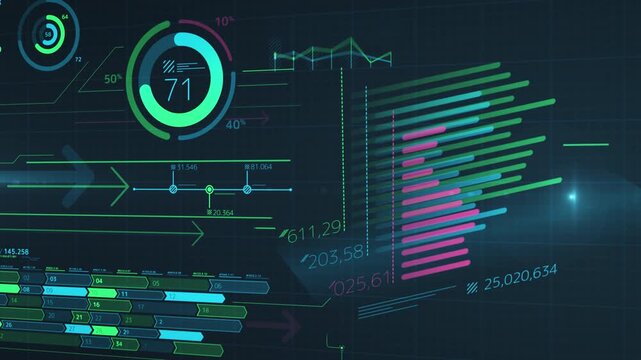
Animation of multiple charts visualizing the analysis of large amounts of data
00:14
HD
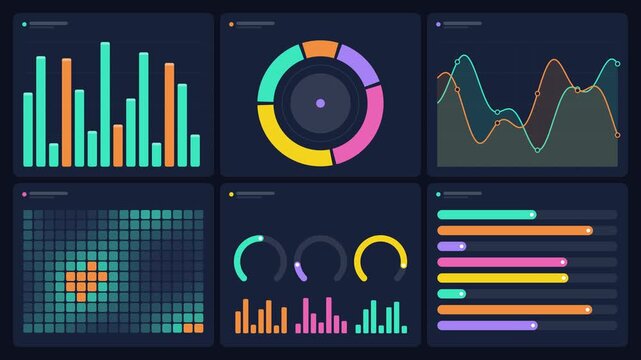
A collection of colorful digital data visualization dashboard elements featuring various charts graphs and analytical components on a dark background
00:10
HD
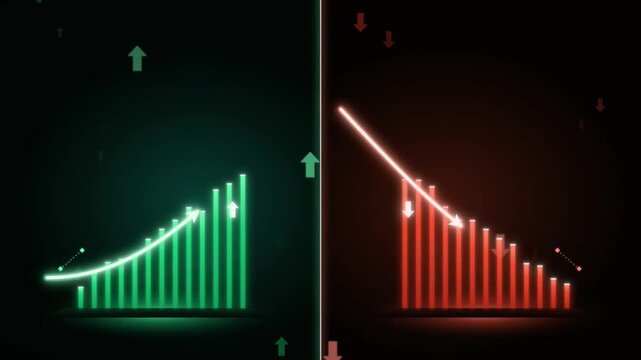
Split screen financial comparison animation with green growth and red decline bar charts
00:15
HD
ait Comparison Infographic Presentation Template, Business Slide Deck with Data Charts, Product & Feature Comparisons, Pricing Tables and Performance Analysis
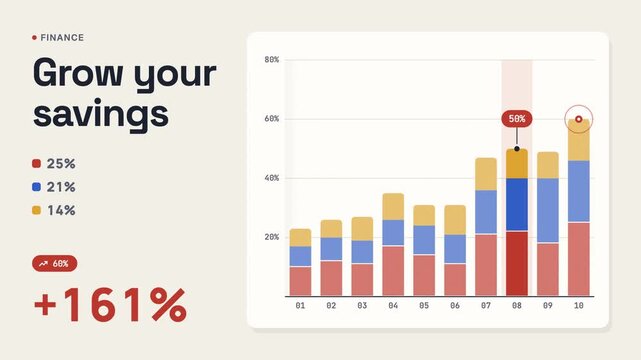
Three finance panels pair savings figures with stacked bar charts, while colored segments and percentage labels compare values across ten numbered intervals
00:10
HD
Declining bar chart with downward trend, Blue bar chart with falling line graph decline in business data, finance performance and analytics animation
00:07
HD
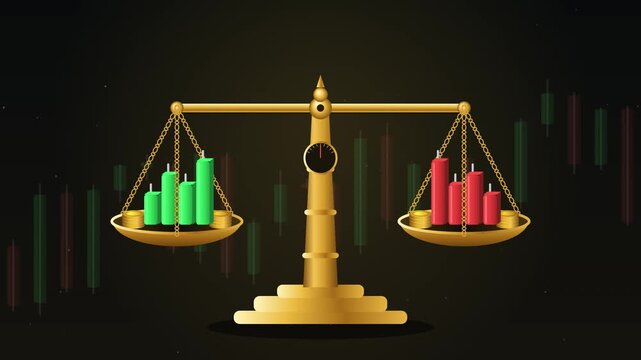
Golden balance scale weighing green and red candlestick charts for financial market risk analysis
00:10
HD
Financial scale balance animation comparing growth green charts and falling red charts with gold coins
00:15
HD
indt Comparison Infographic Presentation Template, Business Slide Deck with Data Charts, Product & Feature Comparisons, Pricing Tables and Performance Analysis

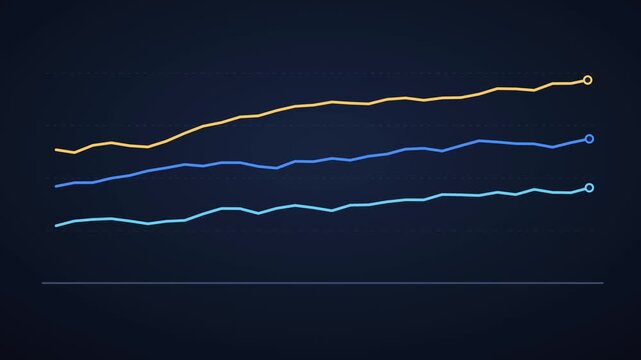
Three trend lines drawing in sequence for multi series comparison
00:12
HD
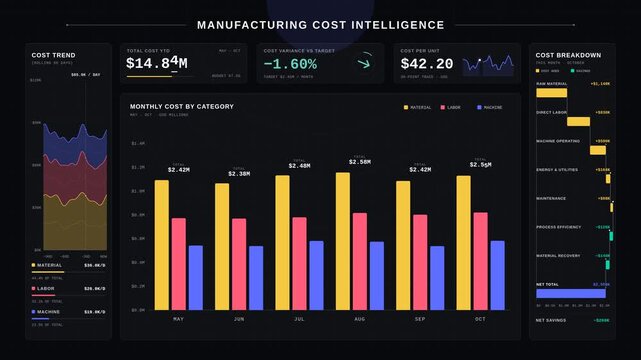
Executive manufacturing cost dashboard comparing material labor and machine operating expenses with animated bar charts and KPI metrics on dark background.
00:15
HD
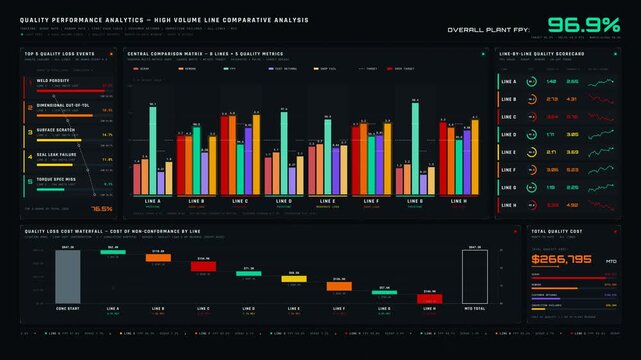
4K production performance dashboard comparing quality losses across high volume lines with animated bar charts and cost waterfall analysis. for commercial creative technology and business use.
00:15
HD
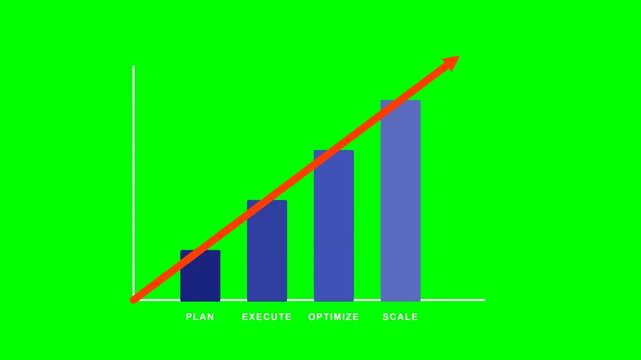
Business Growth Bar Chart Arrow Animation
00:10
HD
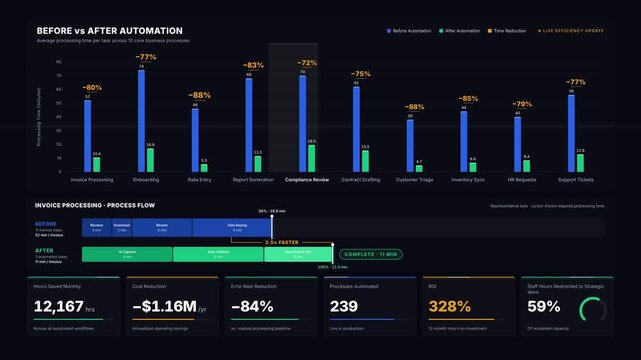
Executive ROI analytics dashboard comparing business process automation efficiency with animated bar charts and live KPI metrics on dark background for commercial creative technology and business use.
00:15
HD
psdt Bento Box Business Infographic Template For Dashboard Report, KPI Metrics, Data Visualization