


Comparison Infographic Presentation Template, Business Slide Deck with Data Charts, Product & Feature Comparisons, Pricing Tables and Performance Analysis




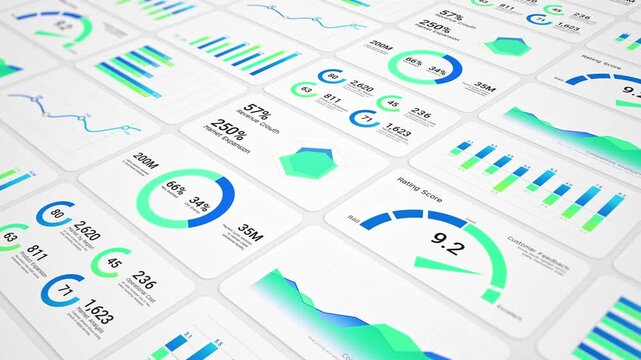
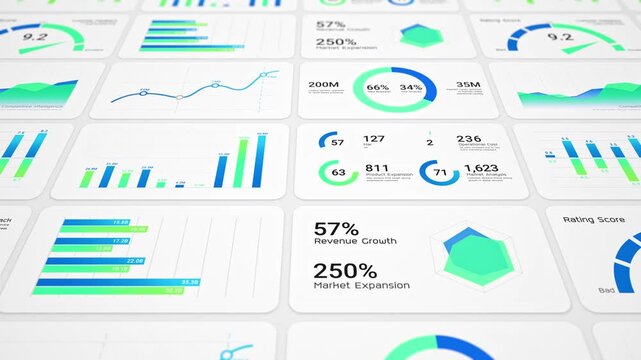
Bento Box Business Infographic Template For Dashboard Report, KPI Metrics, Data Visualization

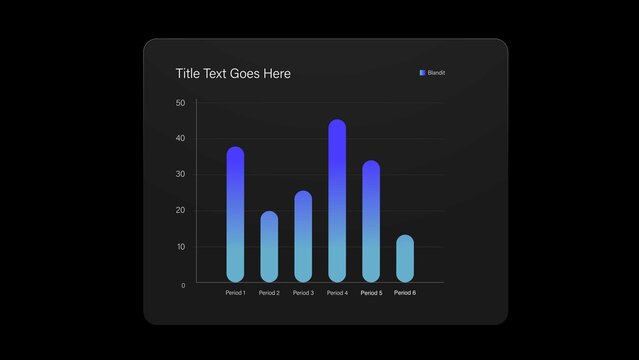
Infographic Bar Chart Video Template


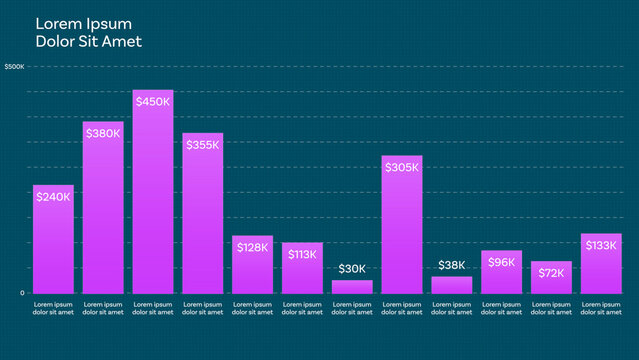
Responsive Vertical Bar Chart for Design and Data Visualization Design and Slide Presentation and with 12 Animated Data Points + Custom Text + Color with Dual Bar Graph Mode and Dynamic Auto-width Bar


Bento Box Business Infographic Template for Dashboard Report, KPI Metrics, Data Visualization


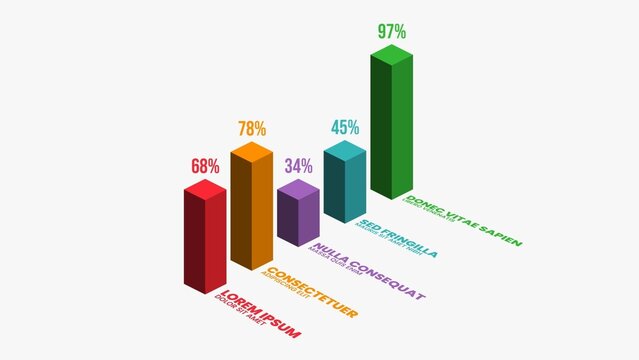
Clean Bar Graph Infographic Data Visualiser


Bar Graph Infographic Template


Modern Business Infographic Elements Set
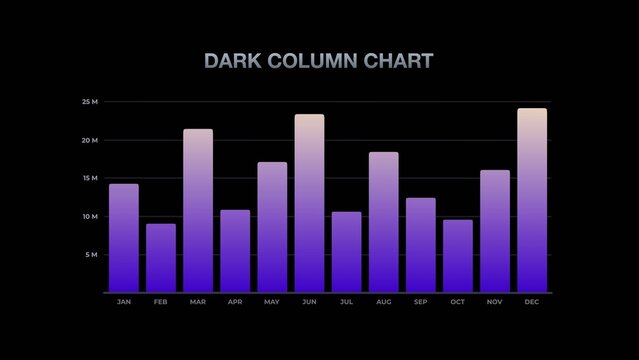
Modern Gradient Dark Column Chart
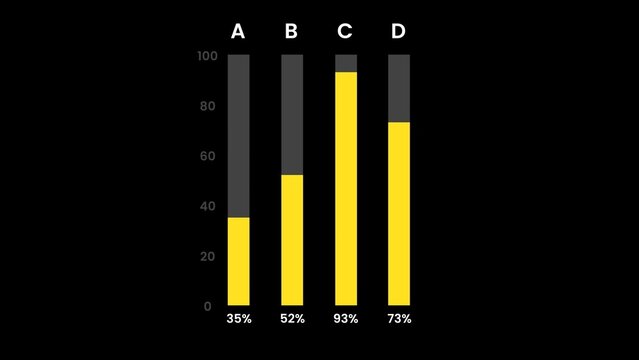
Infographic Modern Bar Chart

Stat Infographic with Increase and Decrease
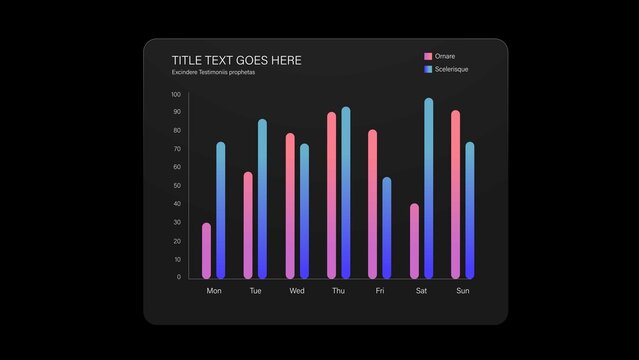
Infographic Bar Chart Video Template
Comparison Infographic Presentation Template, Business Slide Deck with Data Charts, Product & Feature Comparisons, Pricing Tables and Performance Analysis
Bento Box Dashboard UI Template, Modern Analytics Infographic Widgets, Admin Panel, App Dashboard Layouts
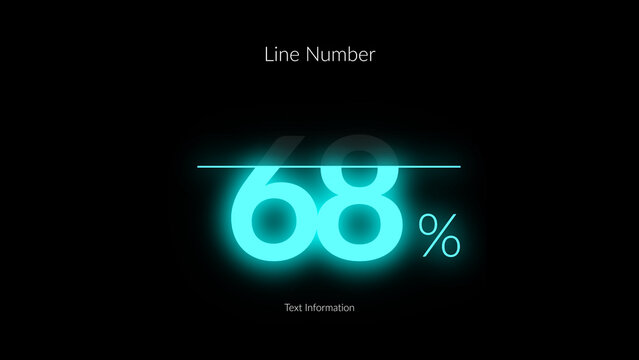
HUD Neon Infographics Line Number x1
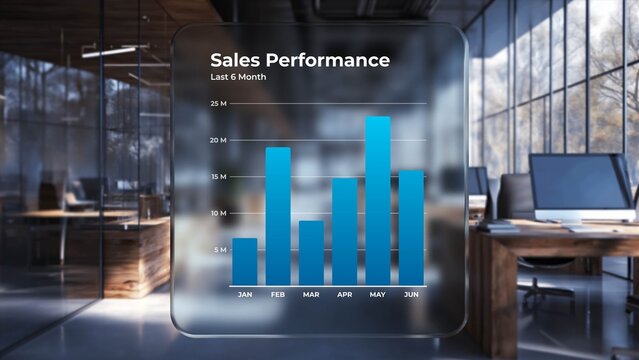
Glassmorphism Sales Performance Dashboard
Bento Box Dashboard UI Template, Modern Analytics Widgets, Admin Panel, App Dashboard Layouts
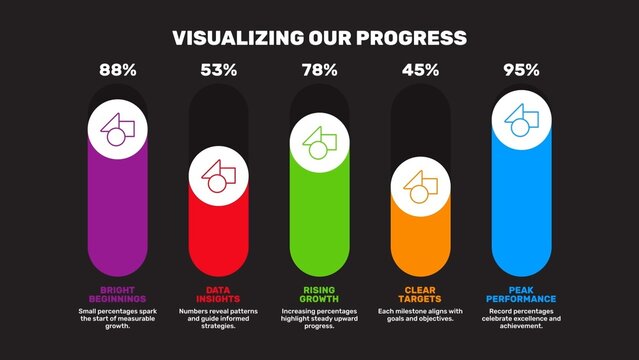
Bar Slider Professional Performance Tracker Infographic
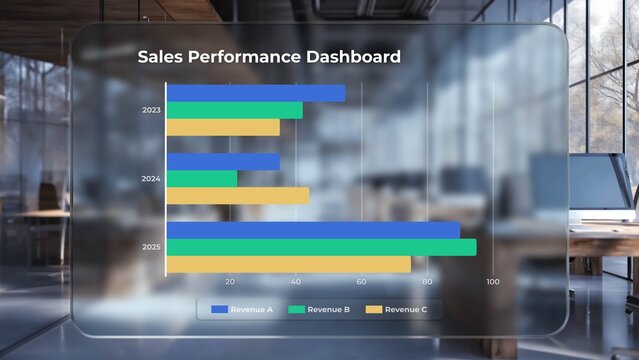
Glass UI Business Analytics Chart

Bento Box Business Infographic Template For Dashboard Report, KPI Metrics, Data Visualization

HUD Neon Infographics Line Graph x5
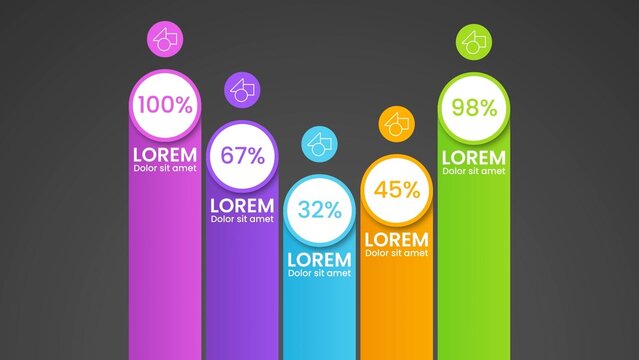
Gradient Graphic Bar Value Comparison Infographic
Modern Business Infographic Presentation Template