En länk till val av lösenord har skickats till: För att komma åt dina inköp behöver du ett lösenord.
Få 3 videor eller 25 bilder med en kostnadsfri provperiod
Nya filter har lagts till
Sortera efter

2 202 resultat för quantitative i videor

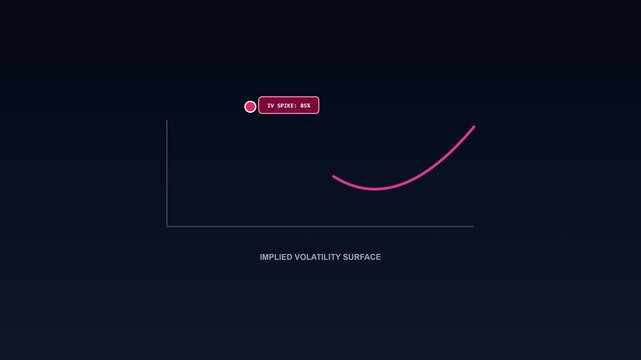
Implied volatility surface chart with zv spike data analysis for financial markets and quantitative trading visualization animation 4k
00:10
HD
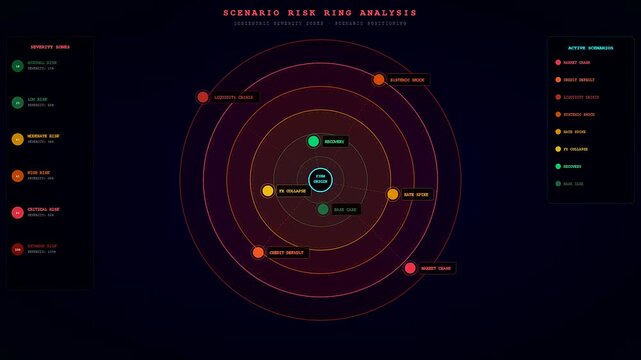
A quantitative risk assessment interface displaying circular node charts that expand and evolve through data nodes to show systemic financial warnings in dark digital space
00:06
HD
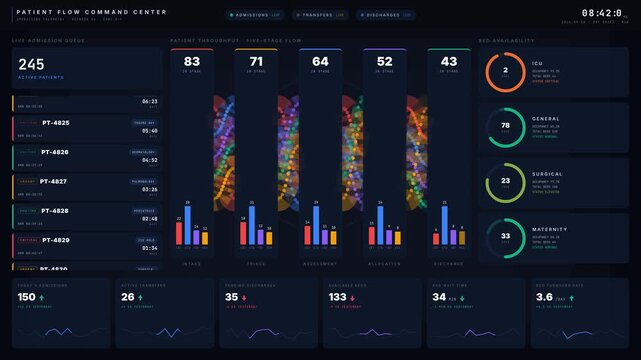
Explore a real-time patient flow dashboard showcasing admissions, transfers, discharges, and bed availability with a sleek dark mode interface and animated data visualizations.
00:15
HD
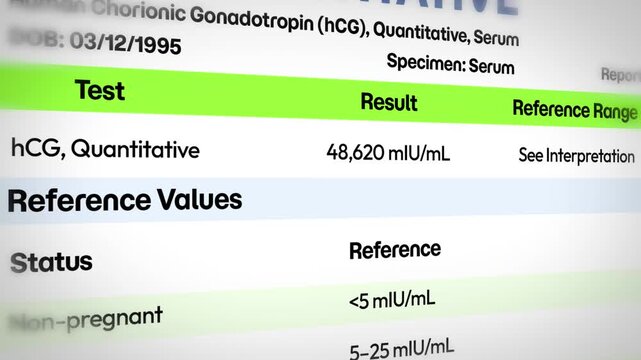
4k footage of hCG quantitative blood test result close up on medical lab report with green highlighted section
00:09
HD
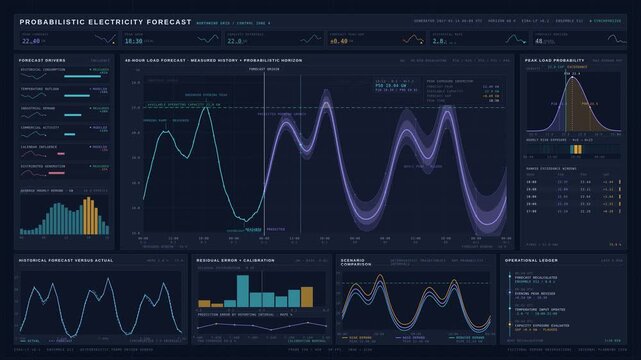
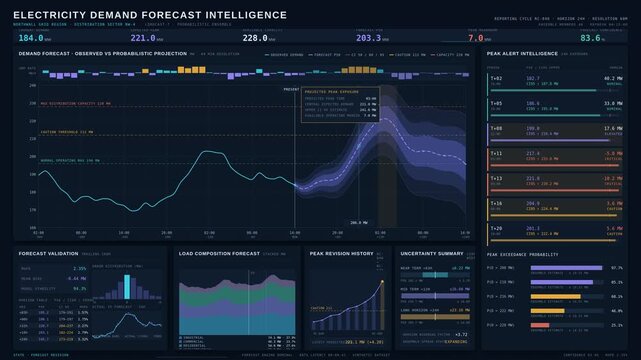
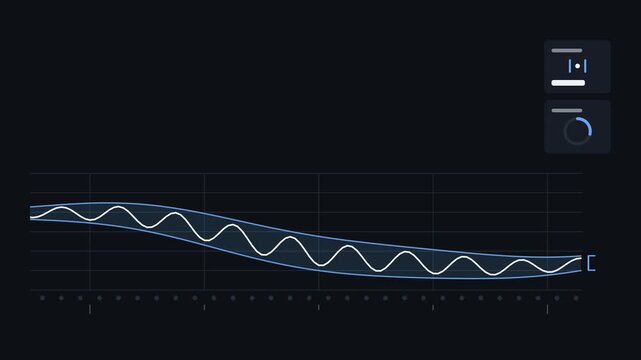
Explore a sophisticated electricity demand forecasting dashboard showcasing peak load predictions, uncertainty bands, and historical power consumption for energy analysts and grid planners.
00:15
HD
Quantitative easing monetary policy 3D animation with city grid and financial data loop
00:15
HD
Expansive wide angle surveying a bear market alert system featuring a flashing red panic liquidation dashboard inside a comprehensive quantitative trading panels displaying English metrics.
00:10
HD
Evaluating corporate numerical statistics through quantitative analytics models
00:18
HD
Colorful lines represent financial trends and market movements on a digital display. The background shows a grid, enhancing data visualization.
00:10
HD
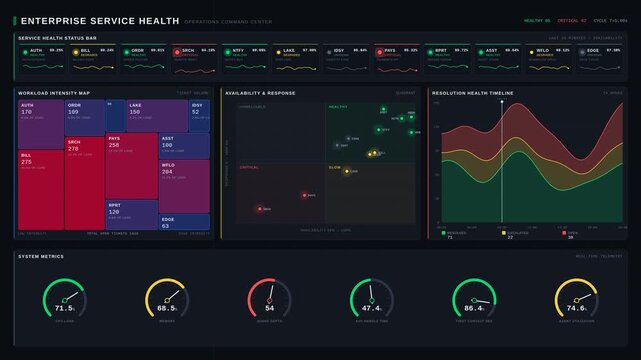
An advanced enterprise service health dashboard displays workload, availability, response, and resolution metrics with a sleek command-center aesthetic in 4K resolution.
00:15
HD
European money Euro banknotes helicopter money dropping. EU 20 EUR notes abstract 3d concept of inflation, money printing, finance, economy, crisis and quantitative easing.
00:20
HD
Animated red color moving  business concept advanced data binary code dashboard display black stock market background
00:20
HD
Teal market data screen with an area chart, volume bars and glowing heatmap tiles. Financial analytics, big data and quantitative research
00:10
HD
Business dashboard UI with data charts and analytics on screens.
00:15
HD
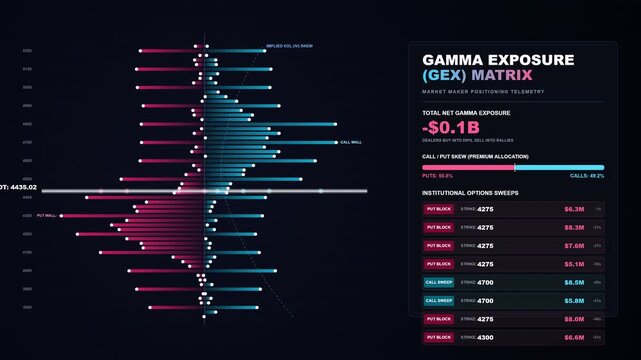
Gamma exposure gex matrix stock market financial dashboard animation for options trading analysis and quantitative finance data visualization on dark background
00:10
HD
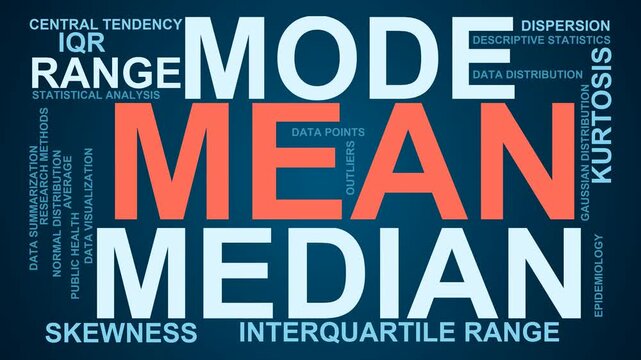
Mean Word Cloud
00:11
HD
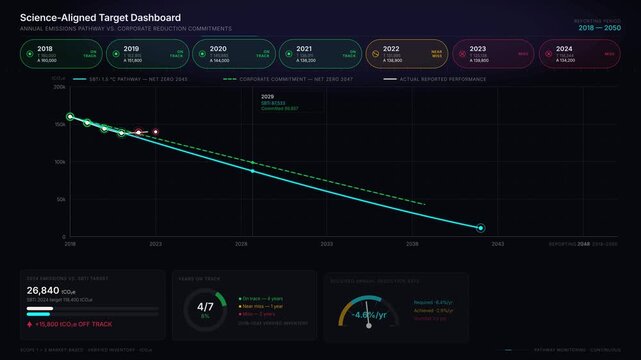
A premium dark mode animated dashboard visualizing annual emissions pathways versus corporate reduction commitments with a science-aligned target focus and dynamic metrics.
00:15
HD
Stock Market Data Analysis Fluctuating Graphs with Upward Trends
00:05
HD
Clean White Galton Board Simulation with Blue Balls Dropping into Gaussian Bell Curve Histogram, Probability Distribution Explainer for Math Lessons and Data Reports. Seamless Loop
00:14
HD
Seamless loop AI behavior curve modeling visualization with statistical distribution analysis, predictive forecasting systems, machine learning calibration and quantitative intelligence analytics.
00:10
HD
A digital revenue projection interface displaying expanding hexagonal nodes with fluctuating charts and scatter plots in a dark computer simulation environment for quantitative data trend analysis
00:06
HD
A digital bio interface simulation showing red blood cells flowing through a vascular vessel with pulsing circular gauges and fluctuating quantitative data panels in black
00:06
HD
Displaying kinetic harvesting patterns across digital circular gauges showing geometric floral motifs while glowing neon ring indicators track quantitative data values on a dark gradient interface
00:06
HD
D-dimer test report close up 4k footage showing quantitative blood, plasma lab results, with medical record design, sample data
00:10
HD
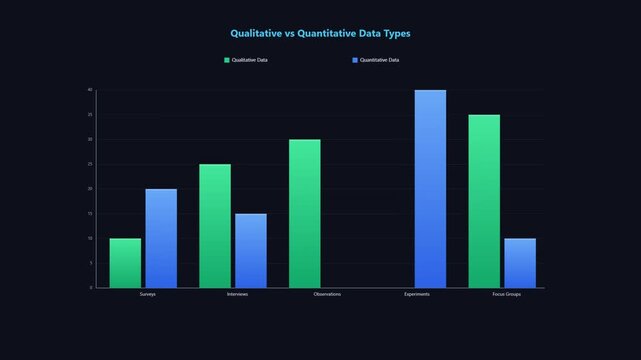
Animated bar chart comparing qualitative and quantitative data types
00:10
HD
Business analytics data displays growth trends over time with bar graphs and line charts
00:10
HD
Expansive wide angle surveying a bull market trading terminal featuring a glowing green financial data interface inside a comprehensive quantitative trading panels displaying English metrics.

00:10
HD
Bar chart displays fluctuating quantitative data points using a mix of green and dark red vertical columns on a clean white background.
00:06
HD
A digital screen displays stock market data with green and red bars representing trading activity. Numbers and lines show financial trends over time. This content is commonly used in finance settings.
00:10
HD
Multidimensional Quantitative Factors in Dynamic Radar Chart Rotation
00:10
HD
High frequency algorithmic trading UI with quantitative execution matrix displaying green candlestick charts and automated auto buy server cluster nodes
00:59
HD
Explore the realm of business data analytics with this image showcasing a user engaging with advanced analytical metrics on a modern laptop, driving insights and strategic decisions. Cipher
00:10
HD
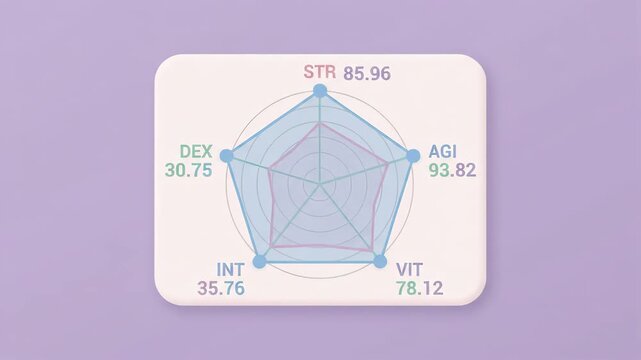
digital radar chart displaying comparative quantitative data values on floating white rectangular card set against soft purple solid background
00:06
HD
Scotland pound sterling Scottish money banknotes helicopter money dropping. Scotch 20 GBP notes abstract 3d concept of inflation, money printing, finance, economy, crisis and quantitative easing.
00:20
HD
Minimalist animated bar chart showing sales data or consumer trends across categories like electronics, fashion, home, and beauty for business analysis and marketing reports
00:08
HD
Animated Bell Curve Histogram Chart Representing Statistical Data Distribution
00:11
HD
Floating numerical digits randomly moving in dark blue space seamless loop animated background with white in a digital space, representing data analytics and quantitative information
00:15
HD
Line graph steadily increases over time depicting growth and progression
00:10
HD
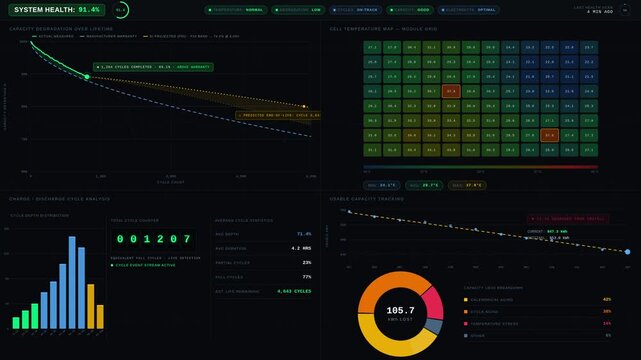
An advanced energy storage health dashboard showcasing degradation, temperature, cycles, and capacity metrics with a clinical dark mode design and vibrant health-coded accents.
00:15
HD
Seamless loop retracement overlap visualization, quantitative market confluence analysis.
00:10
HD
Random numeric digits drift black analytical grid mathematics visual. finance, statistics, calculation, market analysis, research, database themes, forecasting, computing quantitative presentations.
00:20
HD
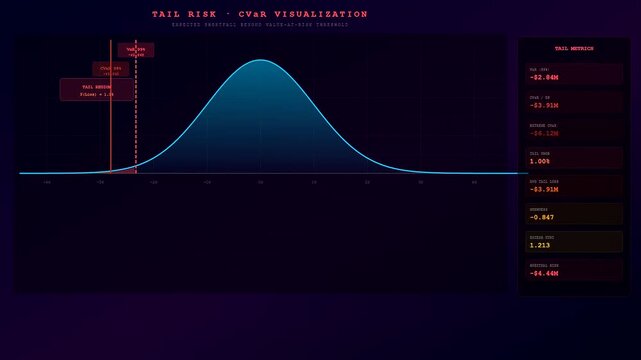
a quantitative risk assessment dashboard displays statistical probability curves with changing mathematical metrics on a dark glowing interface that visualizes predictive financial market data trends
00:06
HD
Minimalist digital interface displaying partial progress and quantitative loss metrics
00:10
HD
Data Counting, Numerical Statistics, Measurement, Digital Information and Quantitative Progress
00:10
HD
Chart displays business metrics and colored bar graphs on a clean modern dashboard interface featuring quantitative data analysis for corporate financial growth.
00:10
HD
Digital displays showing probability modeling with shifting bell curves and statistical data points on a dark interface representing complex quantitative analysis of various research tests
00:06
HD
People learning to count, process data, and improve quantitative expertise through teaching and practical application, symbolizing education in numbers
00:17
HD
Animated order flow two sides colliding drawn as a clean dark mode trading dashboard in deep blue. Smooth 4K seamless loop with blank data panels and room for text. Widescreen 16:9 footage for financi
00:07
HD
This scene displays a digital representation of stock market trends with colorful bars and lines. The patterns show changes in stock values and trading volume over a specific period.
00:10
HD
Ecommerce safety stock dashboard featuring demand variability analysis, reorder thresholds, and real-time KPIs in a modern quantitative finance aesthetic with animated visuals.
00:15
HD
A digital screen displays Organoid Growth Monitoring metrics using a progressive heatmap interface that tracks cellular development patterns through changing color gradients over a period of time
00:06
HD
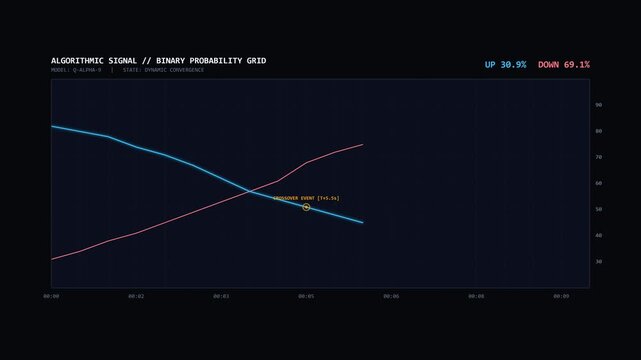
Institutional quantitative finance background showing two converging signal lines with exact crossover event marker, dynamic UP/DOWN probability shift, and seamless loop in 4K 16:9 with fixed layout s
00:10
HD
Digital screen displaying machine learning loss function graph with training progress metrics and epoch iteration status highlighted against dark technical background
00:06
HD
Barbados Dollar barbadian money banknotes helicopter money dropping. 50 BBD notes abstract 3d concept of inflation, money printing, finance, economy, crisis and quantitative easing.
00:20
HD
Qualitative and quantitative in balance - balancing stones on a scale symbolizing harmony, equity and equilibrium between qualitative and quantitative. Harmonious and beneficial situation.
00:10
HD
Clean White Galton Board Simulation with Green Balls Dropping into Gaussian Bell Curve Histogram, Probability Distribution Explainer for Math Lessons and Data Reports. Seamless Loop
00:14
HD
Business professional reviewing customer satisfaction ratings and feedback on a laptop screen while conducting market research analysis for improvements. Qubit
00:14
HD
Digital counter display showing rapidly increasing numbers for data analysis and statistics presentation
00:05
HD
Bar chart and quantitative performance metrics on dark interface
00:15
HD
Algorithmic Robo Advisor Investment Portfolio Rebalancing and Tax Loss Harvesting Engine Visualization
00:05
HD
Data science analytical line chart with drift detection threshold for monitoring system performance a digital analytics interface displays a visualizing and metrics for software tracking
00:10
HD
Digital displays showing quantitative risk assessment metrics update sequentially in a looping animation sequence featuring bright green glowing bar graphs and central floating shield icons
00:06
HD
Quantitative Analyst Working on a Laptop to Boost Ecommerce Conversion and Payment Flows While Male Specialists Track Neural Network, Freight and Threat Defence Walls in a Big Data Command Centre.
00:10
HD
Expansive wide angle surveying a corporate fintech dashboard featuring a analytical blue institutional trading platform inside a comprehensive quantitative trading panels displaying English metrics.
00:10
HD
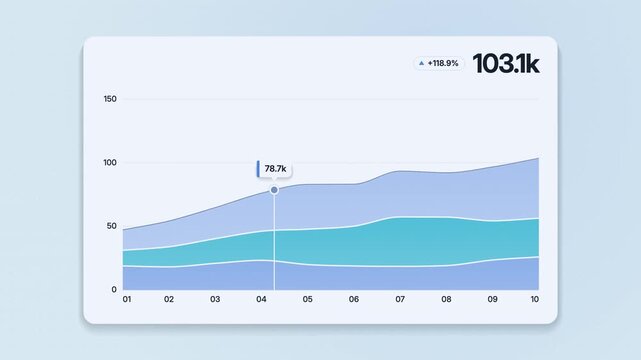
A stacked area chart displays data across ten time points showing multiple colored bands indicating quantitative measures in relation to a vertical scale
00:08
HD
Abstract Digital Stock Market Data Display with Fluctuating Financial Numbers on Black Background
00:20
HD
People engaging in the quantitative proficiency development process, analyzing data, managing controls, and improving skills for strategic business insights and performance evaluation
00:17
HD
Seamless 4K looping finance animation: tight spread chart narrow zone. Flat vector trading terminal with grid, axis ticks and blank readout cards in deep blue on a deep dark background, leaving copy s
00:07
HD
A candlestick chart used in finance to analyze market trends. The chart displays price movements in a visual format, focusing on fluctuations.
00:10
HD
Algorithmic Quantitative Trading Data Dashboard Showing Financial Market Predictions and Buy Signals
00:10
HD
a colorful decibel meter showing fluctuating audio waves with quantitative digital vitals and neon colored bars displayed on a dark virtual interface for analytical monitoring
00:06
HD
Royal blue color with futuristic head up display (HUD UI) technology interface screen and chat panel advanced data analysis algorithms dashboard display technology 3D background
00:20
HD
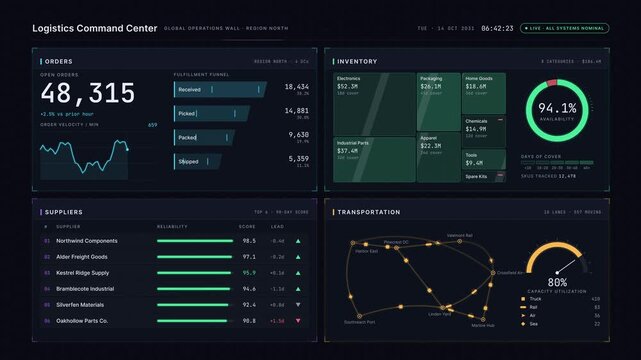
A sophisticated enterprise logistics command center wall display featuring real-time tracking of orders, inventory, suppliers, and transportation with a dark-mode interface and vibrant accents.
00:15
HD
mathematical equations and algebraic formulas drifting on clean white background for academic e learning, science intro, engineering, and scientific research
00:20
HD
Scattered data point cluster rotating within a 3D wireframe grid space
00:10
HD
Financial Data Stream with Green and Red Numbers Moving On Digital Display
00:15
HD
Premium dark electricity demand forecast dashboard with confidence bands, peak alerts, and real-time load analysis for utility operations. for commercial creative technology and business use.
00:15
HD
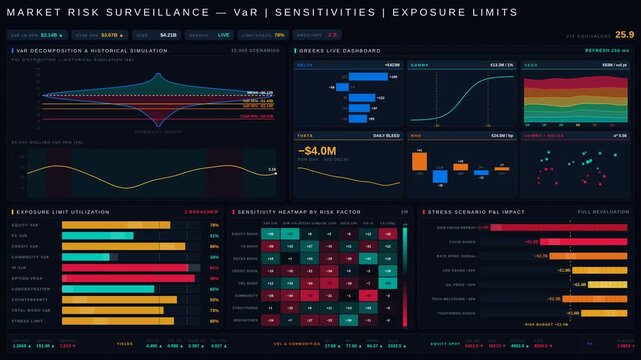
A dynamic and visually engaging market risk dashboard showcasing Value at Risk, sensitivities, and exposure limits in a dark and electric design, perfect for finance professionals.
00:15
HD
Parallel coordinates connecting business metrics in cyan
00:10
HD
Seamless loop AI signal processing and predictive analytics visualization with dynamic data waveforms, machine learning optimization, algorithmic intelligence systems and quantitative forecasting.
00:10
HD
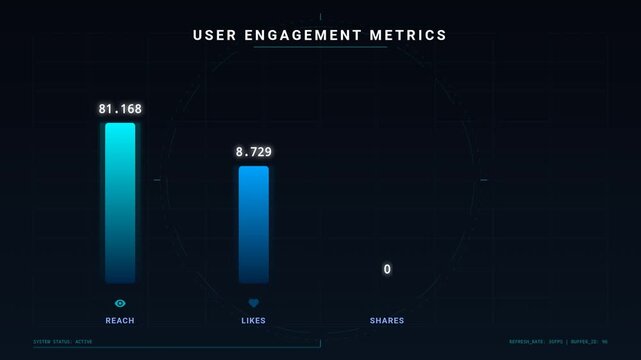
Social Media User Engagement Metrics Dashboard Display
00:10
HD
A quantitative risk assessment interface shows changing statistical data and fluctuating bar charts across three separate panels in a dark digital space for financial analysis
00:06
HD
Business data analytics concept featuring a clipboard report, calculator, and ascending bar graph, illustrating quantitative analysis, performance measurement, financial statistics, trend evaluation,
00:10
HD
Machine learning AI big data analytics computing algorithms
00:16
HD
Coomassie blue, a blue protein-binding dye used for electrophoresis, biochemical staining, protein visualization, quantitative assays, microscopy, and laboratory research
00:14
HD
Plexus neural network mesh with floating financial data and red target crosshair, financial technology, and investment analysis concepts.

00:20
HD
Animated stock market chart with changing financial data bars and line graph motion.
00:15
HD
Seamless 4K looping finance animation: volatility squeeze view contracting bands. Flat vector trading terminal with grid, axis ticks and blank readout cards in deep blue on a deep dark background, lea
00:07
HD
Bars in various heights represent data points on a chart while a line moves upward to show increasing trends. This represents analysis in business or finance.
00:10
HD
Minimalist animated bar chart showing sales data or consumer trends across categories like electronics, fashion, home, and beauty for business analysis and marketing reports
00:08
HD
Detailed quantitative econometrics research process visualizing data analysis, financial statistics, and economic trends for business intelligence and market insights
00:17
HD
Animated red color futuristic globe with futuristic head-up display (HUD UI) technology interface screen and chat panel, advanced data analysis algorithms dashboard display, black technology 3D back
00:20
HD
Abstract seamless 3D loop featuring rising and falling columns, white markers and floating numbers over a black grid. Minimalist visualization of statistics, financial reports and data technology.
00:10
HD
A modern digital bar chart showcasing a "Monthly Trend" with varying heights and shades of purple, indicating fluctuations over time on a dark background.
00:05
HD
Green financial growth chart upward trend economic progress data visualization abstract background
00:05
HD
AI FinOps and Quant Trading Workflow Animation with Market Analysis, Risk Management and Smart Order Execution
00:10
HD
Safe-haven currency for investment, financial concept : US 100 USD dollar banknotes on a flag of USA, depict most popular asset for central bank reserve / global money for using or paying in the world
00:32
HD
Quantitative Financial Analyst Word Cloud
00:11
HD
Tornado chart comparing sensitivity of business factors in slate
00:10
HD
Financial Stock Market Trading Chart Animated Line Graph Data Analysis
00:05
HD