En länk till val av lösenord har skickats till: För att komma åt dina inköp behöver du ett lösenord.
Få 3 videor eller 25 bilder med en kostnadsfri provperiod
Nya filter har lagts till
Sortera efter

7 775 resultat för data feed i videor

Close up male eyes in glasses reflecting smartphone news feed scrolling rapidly at night. Concept information overload constant online news monitoring, endless search for digital information in media
00:13
HD
Digital financial stock market data feed with scrolling numbers, stock exchange tickers, and up-down indicators on a dark background
00:10
HD
Layered collage of blurred screens and notifications with counters and icons, visualizing social media overload, constant engagement and the overwhelming flow of digital content.
00:10
HD
Extreme close-up of a thumb swiping up a touchscreen on a social app news feed in a dark setting. The screen illuminates the finger while scrolling posts photos and video content.
00:17
HD
Offshore fish farm with feed boat, smart aquaculture interface, AI monitoring, automated feeding control, and digital management of marine fish production

00:13
HD
Projecting holographic globe hovering above floor map in glass atrium, data feed intensifying links
00:05
HD
Accountants Review Bank Statements Together
00:15
HD
Glass workflow nodes route a glowing data pipeline into three lanes feeding a live output chart, seamless loop
00:16
HD
Ultra-high resolution industrial AI agent operations center dashboard visualizing multi-agent system workflows in a futuristic factory control room. professional stock footage for technology,.

00:15
HD
A rotating wireframe globe with glowing blue nodes is accompanied by a live green financial ticker and data feed against a dark background, creating a high-tech corporate atmosphere.
00:15
HD
Hand scrolling social media feed on smartphone screen with blue and red digital lighting creating focused modern mobile technology atmosphere
00:05
HD
A sleek 4K dashboard interface showcasing an AI autonomous vehicle sensor fusion system with lidar and radar data visualizations in a high-tech design.
00:15
HD
Tracking shot of security operator monitoring multiple surveillance screens and typing in dim control room at night
00:06
HD
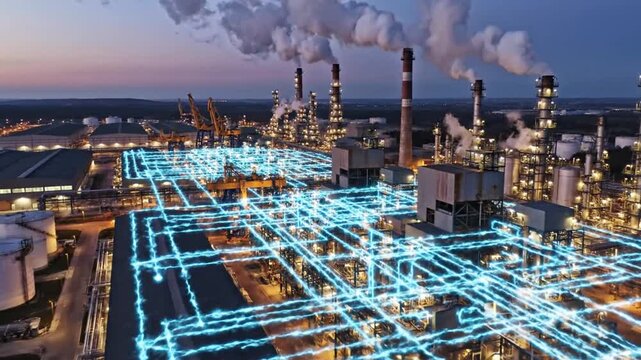
Smart industrial refinery plant with glowing data lines at dusk
00:08
HD
Glowing cyan neural pathway with intertwined magenta and gold connections feeding a dynamic binary data matrix on a dark background
00:15
HD
Power grid pylons feed a data center at dusk in flat animation
00:15
HD
Super Intelligence technology background. Man watching Artificial Intelligence data feed from a server room window.
00:14
HD
A woman with a continuous glucose monitor is eating in a cafe.
00:13
HD
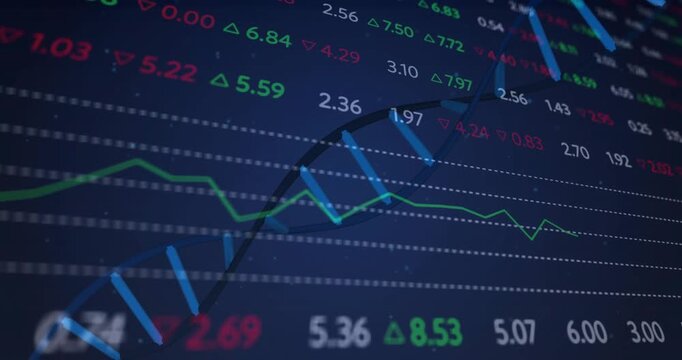
Opening dark blue dashboard, numeric tickers updating and helix wave rising to show market trends
00:10
HD
Older man using a laptop to answer social media quiz questions illustrating the dangers of oversharing personal data and cybersecurity risks
00:22
HD
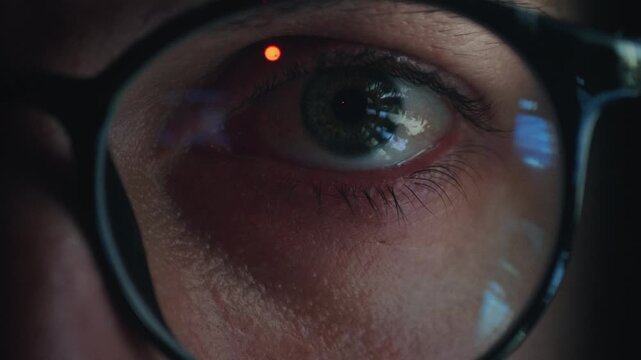
Information overload reflected in human eye behind glasses as glowing screen light flickers in pupil. Close up Eye scans endless data and news feeds showing information overload and digital stress.
00:14
HD
Virtual Tour panoramic walkthrough HUD interface animation with waypoint markers
00:15
HD
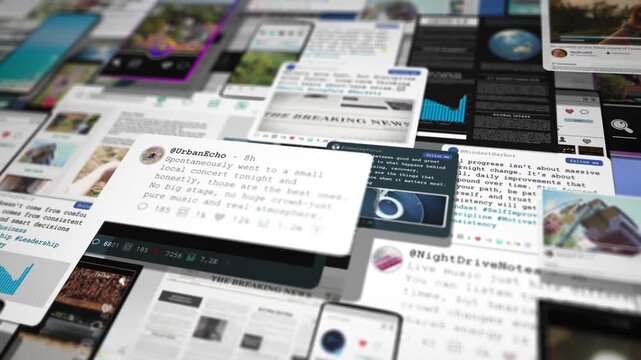
Cinematic collage of social media feeds, news and digital interfaces floating in layered perspective, visualizing online overload for marketing, media and tech campaigns
00:10
HD
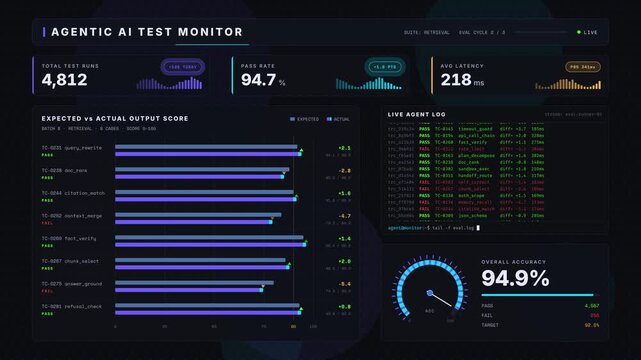
Cinematic dark mode agentic AI testing dashboard loop showing dual bar chart comparisons and live terminal log feed with glowing accents for commercial creative technology and business use.
00:15
HD
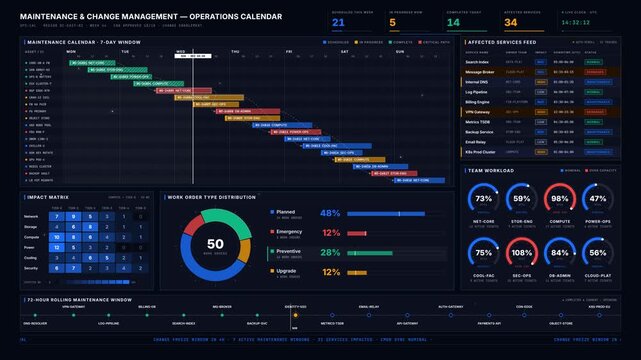
4K animated data center maintenance dashboard with Gantt chart, impact heatmap, and service status feed on dark navy IT operations console background for commercial creative technology and business.
00:15
HD
Explore a detailed industrial IoT sensor network map dashboard, featuring a schematic layout with color-coded sensor nodes and real-time data feed for monitoring facility operations.
00:15
HD
Vertebral video Close-up of female hands holding a smartphone and scrolling through social media feed or watching a video, showcasing daily technology usage lifestyle.
00:24
HD
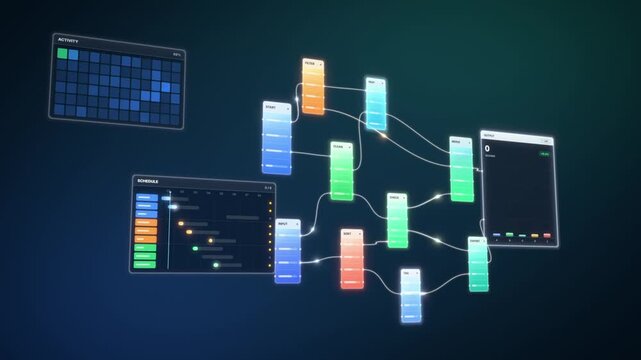
Node based data pipeline workflow builds node by node as glowing pulses feed a live output chart
00:15
HD
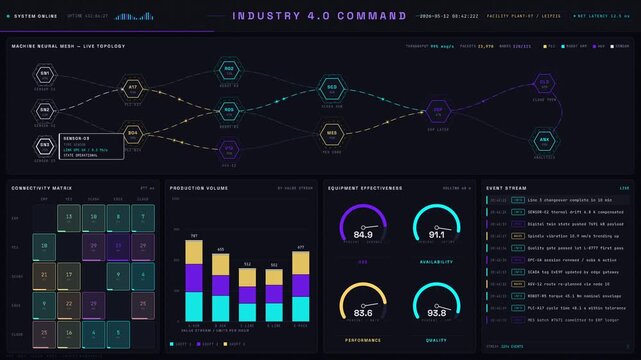
A sleek 4K dark-mode Industry 4.0 manufacturing dashboard displays real-time neural network data flows between PLC, robot arms, and AGVs with animated hexagonal nodes and animated bezier paths.
00:15
HD
Futuristic green cyber terminal text stream and encrypted data telemetry loop
00:15
HD
Close-up vertical footage of an inkjet printer printing charts on white paper, technology concept
00:06
HD
Real-time AI vision dashboard for manufacturing defect classification featuring a neon color scheme and dynamic data visualization elements. for commercial creative technology and business use.
00:15
HD
Close Up of Smartphone With Calorie Counter Application Surrounded by Fresh Fruits and Vegetables, Healthy Nutrition and Diet Planning
00:16
HD
Team of Stockbrokers Work at Desks With Multi-monitor Setups Displaying Stock Exchange Feeds, Tracking Market Charts, Financial Data and Trading Analytics to Drive Investment Growth.
00:11
HD
Man monitor surveillance camera feeds and data analytics for plant security. Industrial control room operator at desk.
00:08
HD
Rotating holographic globe responding to incoming data feed on textured desktop
00:05
HD
A vibrant 4K cyber attack monitoring center visualizes malware, phishing, and intrusion alerts with a tri-color threat system and dynamic data feeds in real-time.
00:15
HD
Blue and orange scrolling code ticker bands on angled view assembling
00:15
HD
On data feed 3D node network pulsing, connections shifting, charts updating, visualizing markets
00:12
HD
Digital reach projection interface displays complex graphical data feeds within a dark environment featuring animated nodes and rhythmic glowing lines for modern system monitoring analytics
00:06
HD
Extreme close up of eye in glasses reflecting smartphone content. Algorithm influence concept visualizes how AI algorithms shape content feeds decisions behavior and digital consumption patterns
00:17
HD
Decentralized ledger blockchain network data feed HUD interface with nodes.
00:10
HD
Layered digital screens with social media feeds and profile interfaces floating in depth, highlighting content consumption, algorithm driven recommendations, and immersive mobile browsing experience.
00:10
HD
Complex seismic mapping interface displays active data feeds with glowing red rings gauges and digital charts in a dark futuristic control room setting
00:06
HD
Camera Settings and Satellite Data Interface with System Active Display.
00:15
HD
A bioinformatics interface displays digital bacterial colony growth patterns with vibrant neon circular light trails and changing statistical data points captured in this futuristic screen feed
00:06
HD
Global memory shortage visualization. AI data centers consuming DRAM production in animated server hall sequence.
00:10
HD
Data pipeline converges raw data streams into glowing lines that feed live analytics dashboard panels
00:16
HD
A vertical financial data feed ticker displays continuously scrolling market information with distinct columns and a dark background, resembling a Bloomberg terminal interface.
00:15
HD
Live Poll Results Filling In With Animated Voting Progress Bars And Percentage Counters
00:15
HD
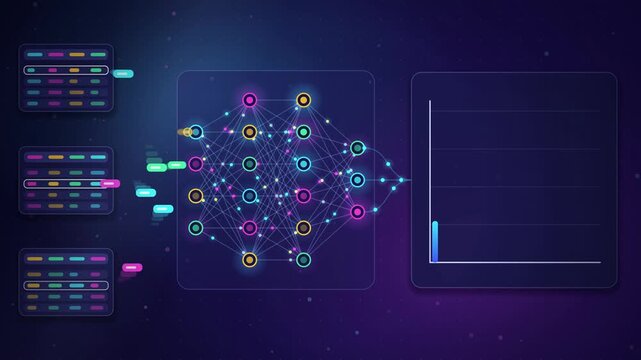
AI sales forecast animation, data tables feed a neural network that predicts future growth on a chart
00:16
HD
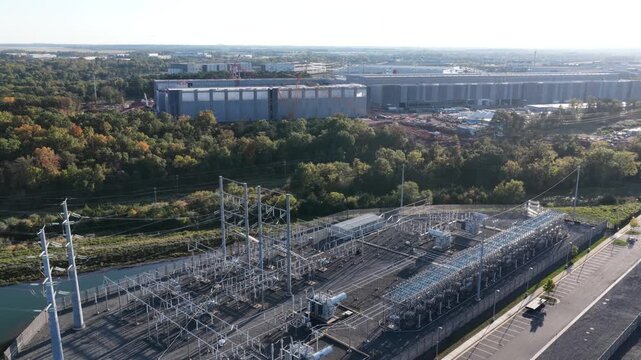
High voltage electrical substation beside a canal of water feeds power to the massive data center buildings behind a band of autumn trees in Ashburn, Virginia. Aerial view
00:08
HD
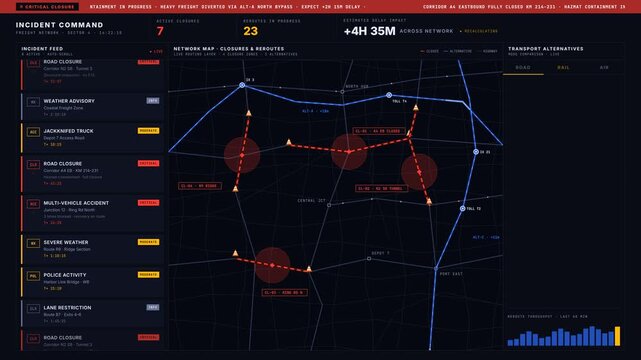
High-urgency 4K logistics incident command dashboard featuring route closures, alternative transport options, and real-time data visualization on a dark slate interface with amber and red accents.
00:15
HD
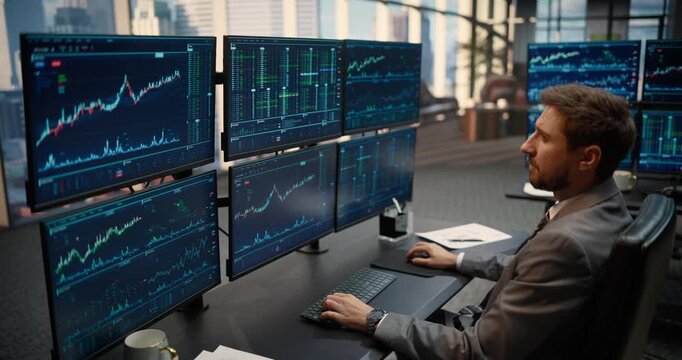
Portrait of Male Investor Working at a Desk Analyzing Stock Exchange Feeds, Candlestick Charts and Investment Analytics on Computer Screens to Track Market Trends, Capital Growth
00:15
HD
Futuristic Digital Interface with Blue Grid Display and Live Data Feed
00:10
HD
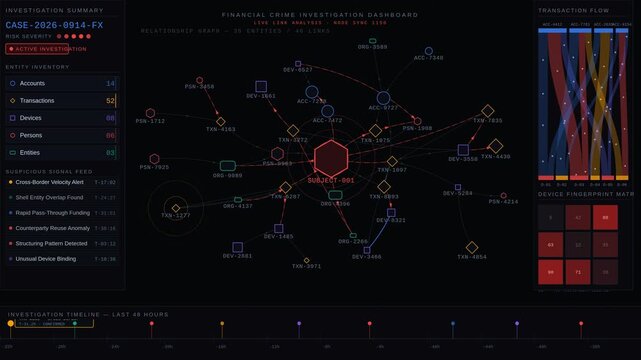
Explore a premium dark-mode financial crime investigation dashboard featuring dynamic visualizations of accounts, transactions, devices, and entities in a forensic intelligence style.
00:15
HD
Real-time data table, monitoring screen for tracking multiple assets simultaneously
00:13
HD
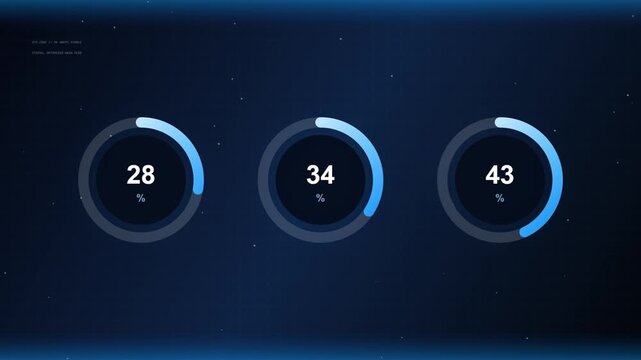
Minimalist Animated Motion Graphics Design Featuring Three Circular Progress Meters Displaying Fluctuating Percentage Statistics on a Blue Digital Background
00:10
HD
On data feed updating, globe rotating, pulsing rings, charts rising, showing realtime analytics
00:12
HD
A broadcast switcher control interface displaying live data feeds on glowing screen panels for professional video production environment showing changing metrics and technical signal processing levels
00:06
HD
Close up of male eye in glasses reflecting fast scrolling smartphone news feed at night. Man reads breaking news and endless information stream, concept of information overload digital media addiction
00:16
HD
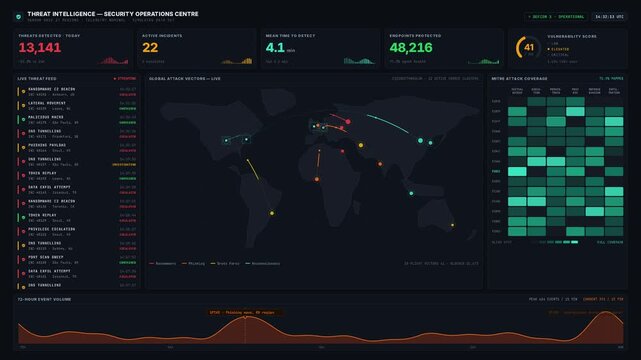
A high-stakes cybersecurity SOC dashboard displays real-time threat intelligence with a world map and live incident feed, illustrating a cold, precise monitoring atmosphere.
00:15
HD
A dense arrangement of digital screens and social media elements illustrates the constant influx of information, emphasizing content overload, multitasking, and digital consumption habits.
00:13
HD
Stock index background with financial market graphs and data numbers moving
00:14
HD
Scrolling code ticker bands on full scene assembling
00:10
HD
Complex synthetic data animation showing network traffic graphs and glowing metric feeds moving across dark digital screens with colorful UI elements
00:06
HD
Premium dark mode Security Operations Center dashboard animation tracking real-time alerts, incidents, and analyst workload with data visualizations for commercial creative technology and business.
00:15
HD
Animated motion graphics showing a thin white progress bar labeled "Refreshing..." reaching 97% over a dark blue background. Represents a nearly completed page reload, data sync, feed update,
00:06
HD
Premium 4K manufacturing performance dashboard displaying production loss waterfall, recovery priority rankings, and operational intervention forecasts with animated data visualization.
00:15
HD
Social media viral video view counter climbing to one million views with live analytics HUD
00:15
HD
Showing glass wall in office casting market graphs and tickers as data feed starting for monitoring
00:05
HD
A monochromatic digital terminal visualizing an active 911 emergency call, displaying audio waveforms, caller tracking metrics, and priority status tracking.
00:20
HD
Glowing data cables feed futuristic computer core as intricate cube slowly turns. Blue light traces network connections, creating dramatic visualization of digital processing and connectivity.
00:05
HD
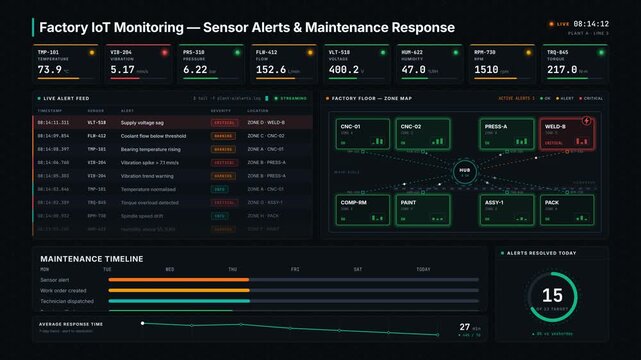
4K factory IoT monitoring dashboard with live sensor alerts, maintenance timeline, and industrial data visualization in dark mode for commercial creative technology and business use.
00:15
HD
Data streams feed monitored server cabinet cluster
00:11
HD
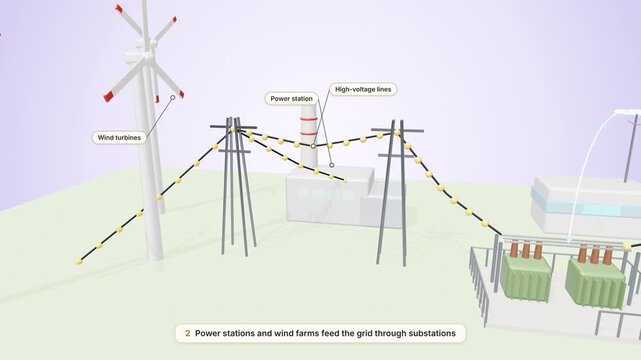
How a smart grid works, 3D explainer animation: wind farms and power stations feed substations, homes with rooftop solar send power back and smart meters report data
00:12
HD
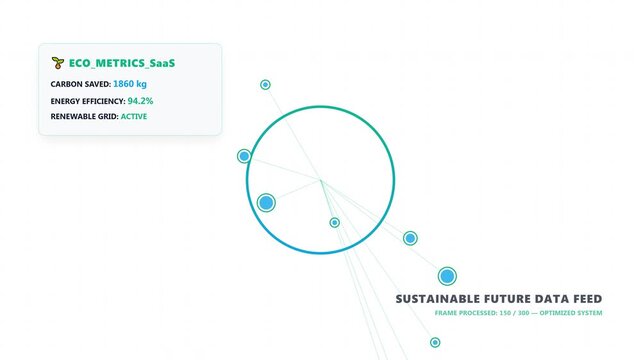
Sustainable future eco metrics data feed HUD interface with network nodes.
00:10
HD
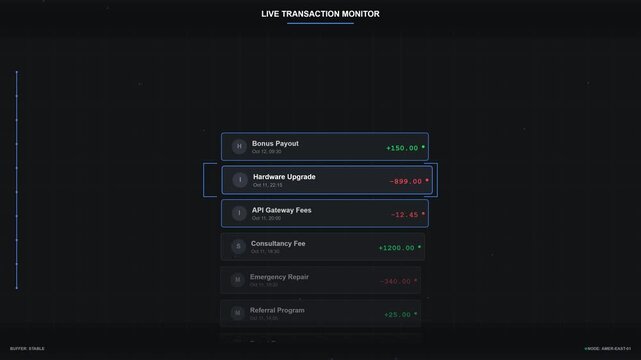
Digital Live Transaction Monitor Financial Data Feed UI
00:15
HD
Translucent HUD overlay receiving data feed and animating globe, radar, charts for tech monitoring
00:15
HD
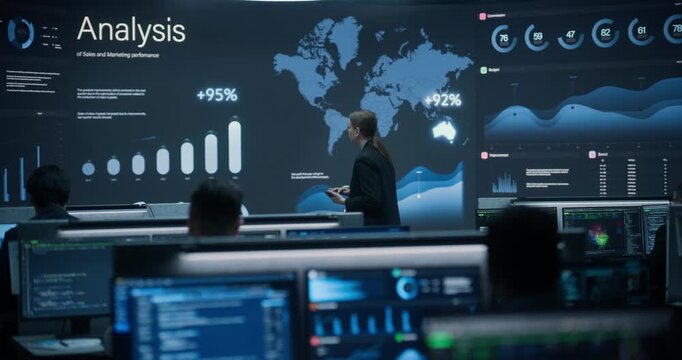
Wide Shot of Female Data Analyst With Tablet Studying Giant Sales Analysis Wall Screen in Modern Financial Control Room, While Analysts Monitor Global Trade, Banking Growth and Cybersecurity Feeds.
00:17
HD
Human eyes behind glasses reflecting smartphone screen with scrolling news feed at night. Concept of information overload digital media consumption, endless flow of online news updates and information
00:10
HD
Smartphone app screen with notification feed and data charts
00:08
HD
Complex network of digital content panels and mobile interfaces connected by lines, illustrating social media interaction, engagement metrics, and multi platform communication in a clean modern layout
00:10
HD
Latency visualization displayed as a bright oscillating multi colored bar graph interface providing real time data feed analytics across three distinct horizontal digital screen panel sections
00:06
HD
Older man using a laptop to answer social media quiz questions illustrating the dangers of oversharing personal data and cybersecurity risks
00:28
HD
Data Processing HUD Animation With Loading Progress Bar And Technical Interface Motion Graphics
00:15
HD
Digital dashboard with live feed metrics, purple data visualization, financial analytics and information monitoring, system progress tracking
00:09
HD
A sophisticated algorithmic trading dashboard displaying multiple oscillating wave patterns and color changing bar charts with live fluctuating metrics in a dark virtual interface environment setting
00:06
HD
Financial dashboard with real time approval metrics risk analytics in 4k, for corporate data analysis, business intelligence, financial technology, risk management
00:20
HD
Futuristic holographic globe interface displaying live telemetry data and charts
00:10
HD
4K enterprise answer dashboard UI with search results, evidence matrix grid, confidence charts, and animated data visualization on dark navy background.
00:15
HD
Seamless looping animation of a premium enterprise analytics dashboard. Features dynamic data visualization including breathing area charts, animated donut graphs, and real-time bar charts.
00:10
HD
Employee timesheets feeding into a 3D payroll engine that calculates salaries and payments
00:15
HD
AI Workforce Operations Center dashboard with intelligent alert feed and workload recommendation engine on dark space blue background with animated topology map.
00:15
HD
A sleek, interactive digital interface data streams screen, stock numbers in real-time. Graphs 3D pie charts bar diagrams financial data. Profits losses displayed bar charts, arrows trends. data point
00:05
HD
The sleek IoT dashboard in a modern pig farm displays data from smart sensors monitoring pig health, feed intake, and barn conditions, with a panoramic view of the automated farm i
00:10
HD
Person using smartphone, browsing through pictures on social network. Close-up Macro. Finger scrolling social media app feed, information search.
00:11
HD
Neural Network Brain and Gut Mesh Animation with Data Signals Between Nervous and Digestive Systems, Biotech Health. Seamless Loop Video
00:10
HD
Receiving data feed, dashboard cluster updating and animating in analytics data wall, with heatmaps
00:12
HD
Hologram Screens: Creative Indian Man Using Desktop Computer with Holographic Projection, Multiple Displays Show Websites, Video Streaming Services, Social Media Feed, e-Commerce, e-Learning Content
00:11
HD