Sälja
Priser
En länk till val av lösenord har skickats till:
För att komma åt dina inköp behöver du ett lösenord.
Alla
Bilder
Videor
Ljud
Mallar
3D
Kostnadsfritt
Premium
Hitta liknande:
Serie:
Modell:
Dokument:
Mina bibliotek
Sök liknande.
Dra en bild hit
eller
bläddra
Överför din bild...
Få 3 videor eller 25 bilder med en kostnadsfri provperiod
Kom igång
Få 3 videor eller 25 bilder med en kostnadsfri provperiod
Kom igång
Dölj panel
Visa panel
Nya filter har lagts till
Sortera efter
655 resultat för
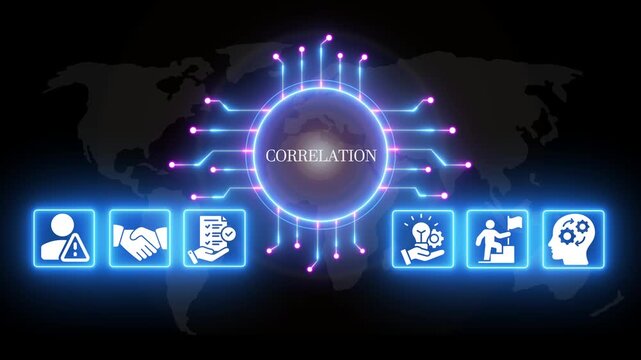
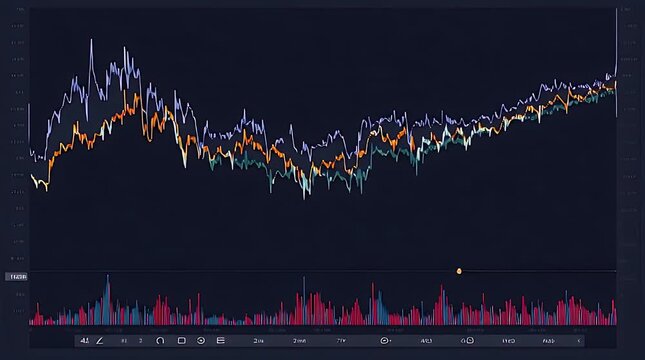
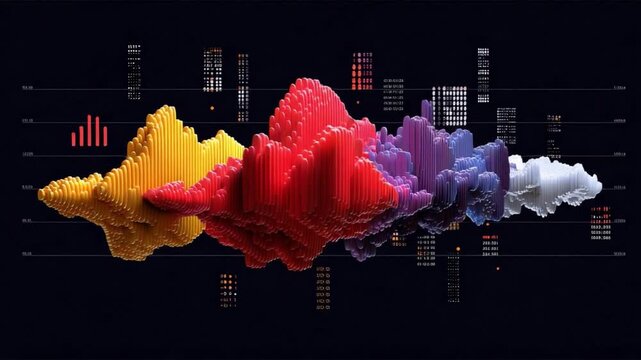
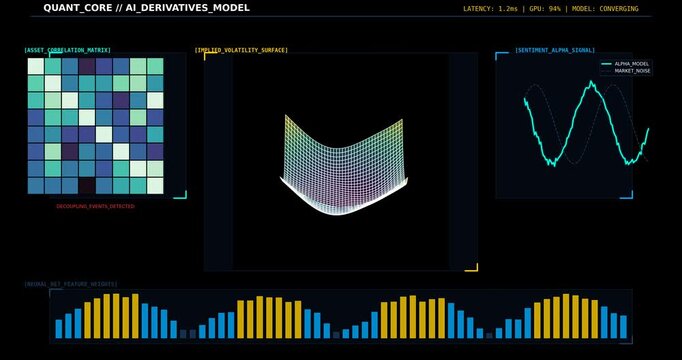
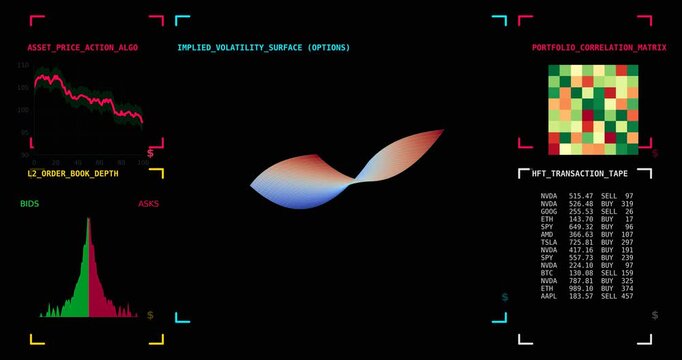
correlation
i videor
00:18
4K
HD
00:10
4K
HD
00:12
4K
HD
00:05
4K
HD
00:15
4K
HD
00:10
4K
HD
00:08
4K
HD
00:13
4K
HD
00:10
4K
HD
00:05
4K
HD
00:05
4K
HD
00:07
4K
HD
00:10
4K
HD
00:06
4K
HD
00:06
4K
HD
00:10
4K
HD
00:05
4K
HD
00:07
4K
HD
00:08
4K
HD
00:05
4K
HD
00:18
4K
HD
00:06
4K
HD
00:10
4K
HD
00:10
4K
HD
00:10
4K
HD
00:05
4K
HD
00:08
4K
HD
00:05
4K
HD
00:09
4K
HD
00:08
4K
HD
00:08
4K
HD
00:07
4K
HD
00:10
4K
HD
00:10
4K
HD
00:10
4K
HD
00:14
4K
HD
00:05
4K
HD
00:05
4K
HD
00:05
4K
HD
00:12
4K
HD
00:10
4K
HD
00:10
4K
HD
00:10
4K
HD
00:05
4K
HD
00:10
4K
HD
00:10
4K
HD
00:05
4K
HD
00:08
4K
HD
00:08
4K
HD
00:10
4K
HD
00:18
4K
HD
00:18
4K
HD
00:10
4K
HD
00:10
4K
HD
00:08
4K
HD
00:10
4K
HD
00:05
4K
HD
00:10
4K
HD
00:05
4K
HD
00:10
4K
HD
00:12
4K
HD
00:10
4K
HD
00:09
4K
HD
00:05
4K
HD
00:10
4K
HD
00:05
4K
HD
00:10
4K
HD
00:10
4K
HD
00:13
4K
HD
00:10
4K
HD
00:18
4K
HD
00:08
4K
HD
00:06
4K
HD
00:16
4K
HD
00:05
4K
HD
00:10
4K
HD
00:05
4K
HD
00:12
4K
HD
00:10
4K
HD
00:07
4K
HD
00:12
4K
HD
00:10
4K
HD
00:11
4K
HD
00:09
4K
HD
00:10
4K
HD
00:10
4K
HD
00:10
4K
HD
00:10
4K
HD
00:20
4K
HD
00:10
4K
HD
00:18
4K
HD
00:08
4K
HD
00:10
4K
HD
00:10
4K
HD
00:06
4K
HD
00:10
4K
HD
00:05
4K
HD
00:06
4K
HD
00:10
4K
HD
00:07
4K
HD
OK
OK
OK
Välj region
Om du väljer region kan språket och kampanjinnehållet på Adobe Stock-webbplatsen ändras.
Nordamerika
Canada - English
Canada - Français
El Salvador
México
República Dominicana
United States
Sydamerika
Argentina
Bahamas
Barbados
Bolivia
Brasil
Chile
Colombia
Costa Rica
Ecuador
Guatemala
Honduras
Jamaica
Nicaragua - English
Panamá
Paraguay
Perú
Trinidad and Tobago
Uruguay
Venezuela
Europa, Mellanöstern och Afrika
Algeria - English
Armenia - English
Azerbaijan - English
Bahrain - English
Belgium - English
Belgique - Français
België - Nederlands
Česká republika
Croatia - English
Cyprus - English
Danmark
Georgia - English
Deutschland
Eesti
Egypt - English
España
France
Greece - English
Iceland - English
Ireland
Israel - English
Italia
Jordan - English
Казахстан
Kenya - English
Kuwait - English
Киргизия
Latvija
Lebanon - English
Lietuva
Luxembourg - Deutsch
Luxembourg - English
Luxembourg - Français
Mauritius - English
Moldova - English
Hungary - English
Malta - English
Morocco - English
Nederland
Nigeria
Norge
Oman - English
Österreich
Россия
Polska
Portugal
Qatar - English
România
Saudi Arabia - English
Schweiz
Slovenija
Slovensko
Suisse
Suomi
Sverige
Svizzera
Таджикистан
Turkey - English
Turkmenistan - English
UAE - English
Україна
United Kingdom
Узбекистан
България
Asien och Stillahavsområdet
Australia
Indonesia - English
中國香港特別行政區
India
日本
한국
中華人民共和國澳門特別行政區
Malaysia - English
New Zealand
ไทย
Philippines
Singapore
Sri Lanka - English
台灣地區
Vietnam - English