Link do ustawienia hasła został wysłany na adres W przyszłości dostęp do zakupów będzie można uzyskać po podaniu hasła.
Bezpłatny okres próbny: otrzymasz 10 zdjęć stockowych oraz narzędzia do edycji oparte na SI
Dodano nowe filtry
Sortuj wg

182 039 wyników wyszukiwania „sales data visualization” w kategorii: wszystko

Wyświetl sales data visualization w kategorii Wideo (16108)
ait 
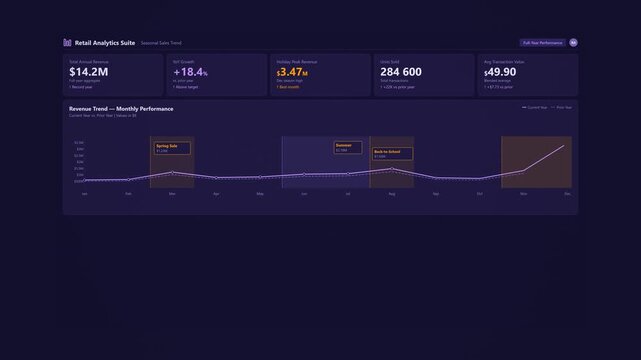
Account Service Dashboard
ait Bento Box Business Infographic Template For Dashboard Report, KPI Metrics, Data Visualization
neon line graph demonstrating significant financial growth and upward trend towards 100% success on a dark digital background, symbolizing business achievement and data visualization
00:09
Animated robot presenting an ecommerce analytics dashboard with dynamic charts, sales metrics, and data visualization. Looping motion graphic ideal for business, technology, and automation concepts.
00:10
Seasonal holiday sales trend chart: animated retail revenue performance with peak period spikes, category comparison and yearly growth data visualization
00:10
Digital sales funnel animation with data processing animation
00:12