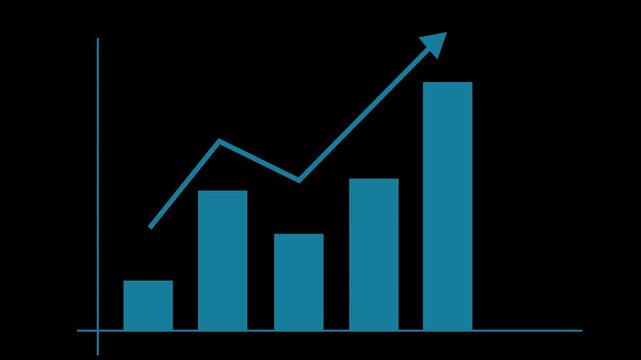


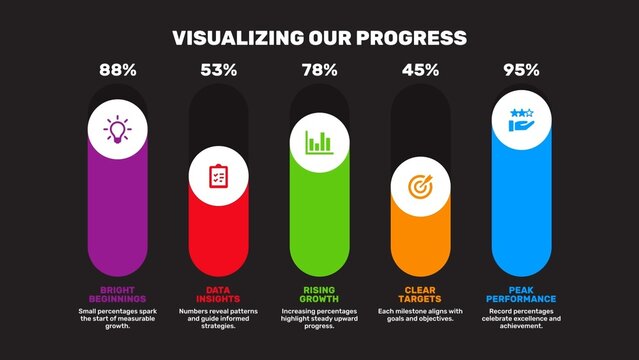
Bar Slider Professional Performance Tracker Infographic

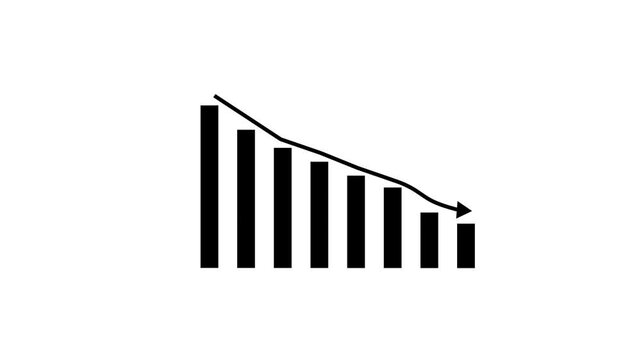

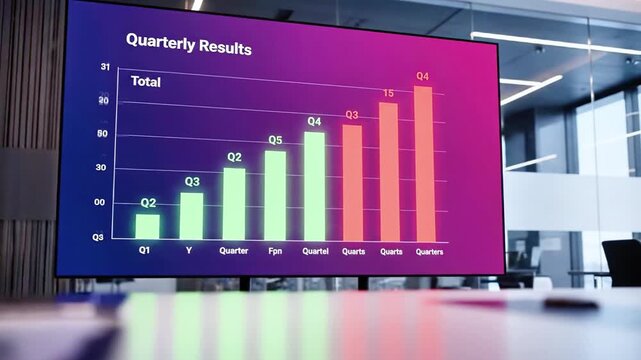
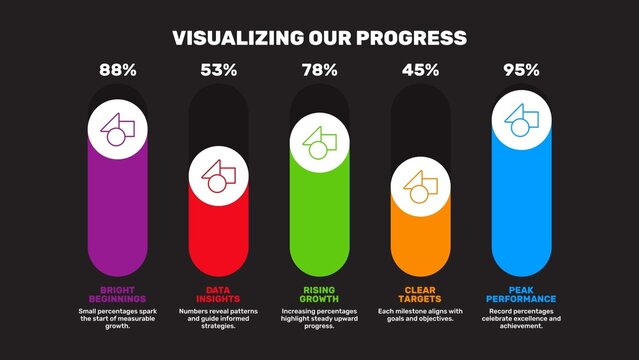
Dynamic Comparison Data Visualiser Graph
Bar Slider Professional Performance Tracker Infographic