Link do ustawienia hasła został wysłany na adres W przyszłości dostęp do zakupów będzie można uzyskać po podaniu hasła.
Bezpłatny okres próbny: otrzymasz 10 zdjęć stockowych oraz narzędzia do edycji oparte na SI
Dodano nowe filtry
Sortuj wg

34 816 wyników wyszukiwania „histograms” w kategorii: wszystko

Wyświetl histograms w kategorii Wideo (4647)
ait 
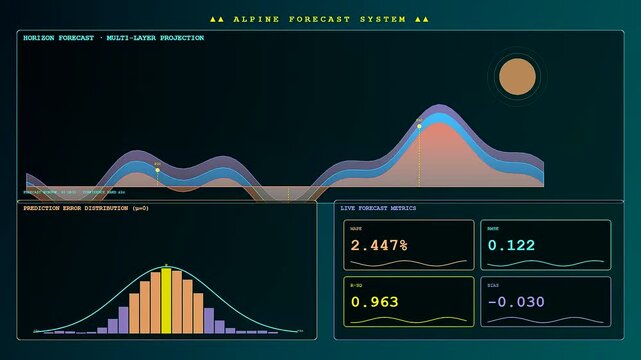
Histogram Infographic Vector – Data Distribution Chart, Frequency Bar Graph Template for Statistics, Analytics, and Reports
A futuristic interface featuring a Predictive Analytics Graph animates complex data points and shifting bar histograms through a sleek neon spectrum on a dark digital background
00:06
Neon Line Graphs and Bar Charts Display a Dynamic Market Trend Scene.
00:08
ait 
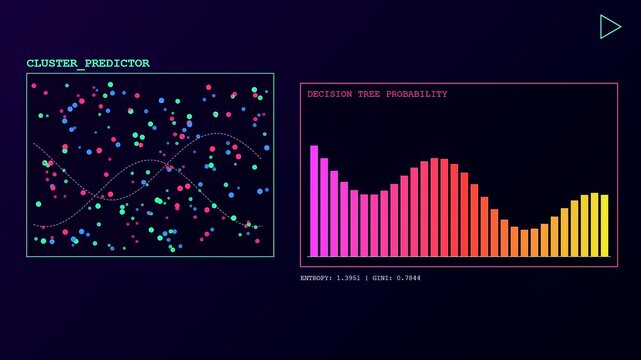
Histogram Graph Infographic Template with Bold Colors
Business Background With Glitch FX
Animation of a glitch technology business and market data analysis and reports, with infographics layout, bar stats, charts and diagrams
00:14
A sophisticated data dashboard featuring a dynamic predictive analytics graph with fluctuating curves, updating numerical metrics, and shifting histograms designed for advanced business intelligence.
00:06
Call agent responding via headset as finance overlays rising with graphs, candlesticks, histograms
00:12
Blue financial chart with glowing candlestick and line graph showing upward trend and dynamic data visualization evoking optimism trading analysis + digital data visualization with glowing
00:08
Data nodes popping over urban canopy as glowing lines forming triangle mesh showing network growth
00:12