Link do ustawienia hasła został wysłany na adres W przyszłości dostęp do zakupów będzie można uzyskać po podaniu hasła.
Uzyskaj 10 obrazów Stock w ramach bezpłatnego okresu próbnego
Dodano nowe filtry
Sortuj wg

170 904 wyniki wyszukiwania „compare chart” w kategorii: wszystko

Wyniki w kategorii wideo: 13 901
indt Comparison Infographic Presentation Template, Business Slide Deck with Data Charts, Product & Feature Comparisons, Pricing Tables and Performance Analysis
ait Comparison Infographic Presentation Template, Business Slide Deck with Data Charts, Product & Feature Comparisons, Pricing Tables and Performance Analysis
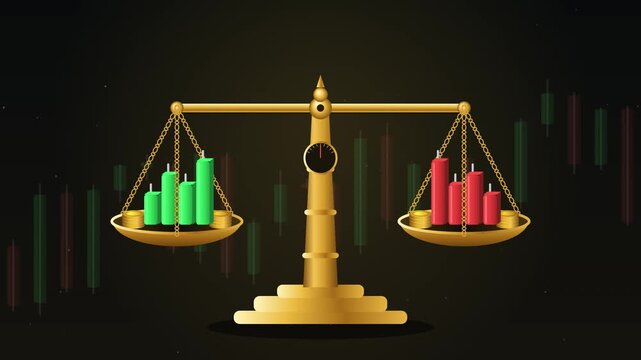
Golden balance scale weighing green and red candlestick charts for financial market risk analysis
00:10
HD
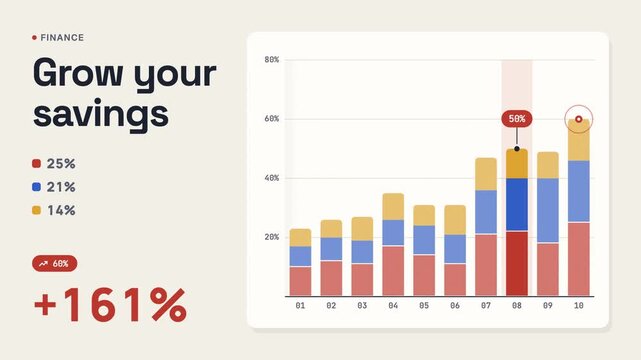
Three finance panels pair savings figures with stacked bar charts, while colored segments and percentage labels compare values across ten numbered intervals
00:10
HD
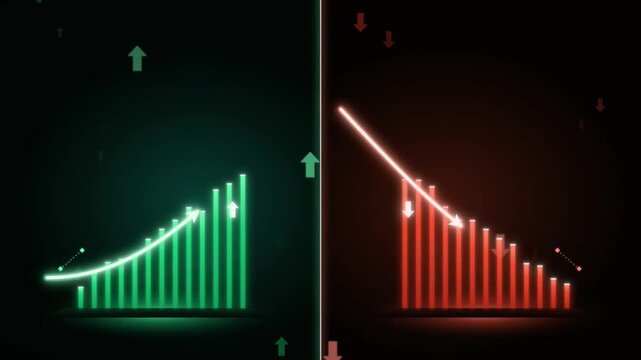
Split screen financial comparison animation with green growth and red decline bar charts
00:15
HD
psdt Bento Box Business Infographic Template For Dashboard Report, KPI Metrics, Data Visualization
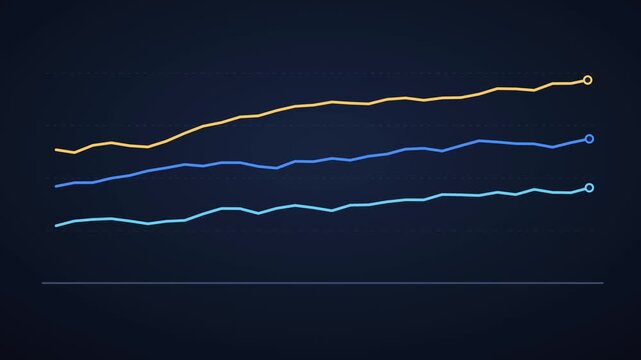
Three trend lines drawing in sequence for multi series comparison
00:12
HD
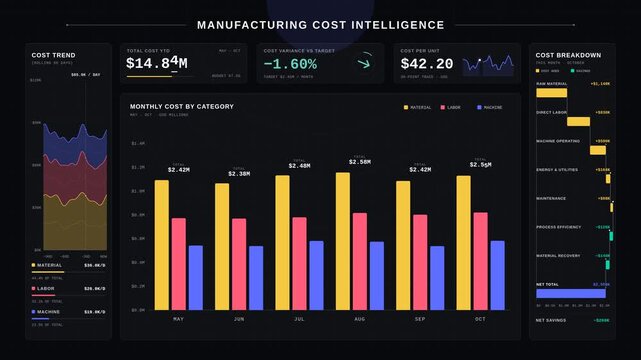
Executive manufacturing cost dashboard comparing material labor and machine operating expenses with animated bar charts and KPI metrics on dark background.
00:15
HD
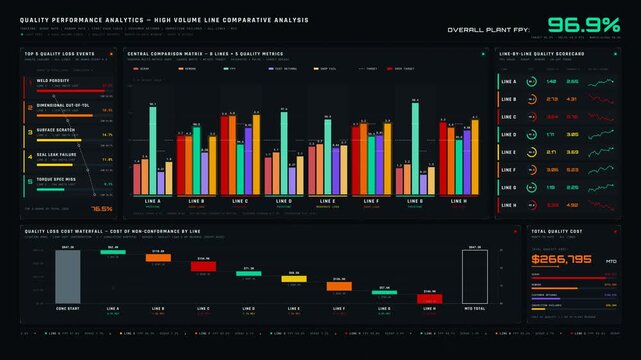
4K production performance dashboard comparing quality losses across high volume lines with animated bar charts and cost waterfall analysis. for commercial creative technology and business use.
00:15
HD
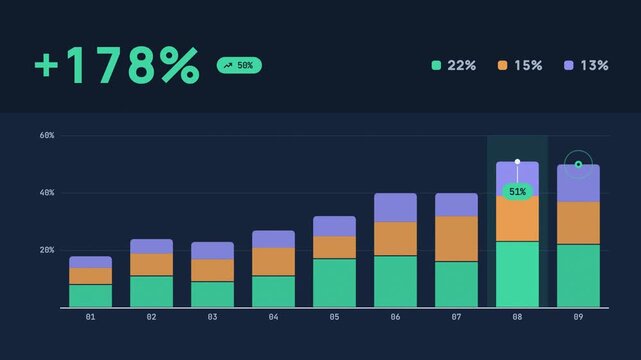
Three stacked bar charts compare rising percentage values across nine numbered intervals, with green orange and violet segments arranged on a dark navy background
00:10
HD
ait Bento Box Business Infographic Template For Dashboard Report, KPI Metrics, Data Visualization
Animation of multiple charts visualizing the analysis of large amounts of data
00:14
HD