Sprzedawaj
Ceny
Link do ustawienia hasła został wysłany na adres
W przyszłości dostęp do zakupów będzie można uzyskać po podaniu hasła.
Wszystko
Obrazy
Wideo
Audio
Szablony
3D
Bezpłatne
Premium
Znajdź podobne:
Seria:
Model:
Moje biblioteki
Znajdź podobne.
Przeciągnij obraz tutaj
lub
przeglądaj
Trwa przesyłanie obrazu...
Uzyskaj 10 obrazów Stock w ramach bezpłatnego okresu próbnego
Zacznij bezpłatny okres próbny
Uzyskaj 10 obrazów Stock w ramach bezpłatnego okresu próbnego
Rozpocznij bezpłatny okres próbny
Ukryj panel
Pokaż panel
Dodano nowe filtry
Sortuj wg
15 033 wyniki wyszukiwania „
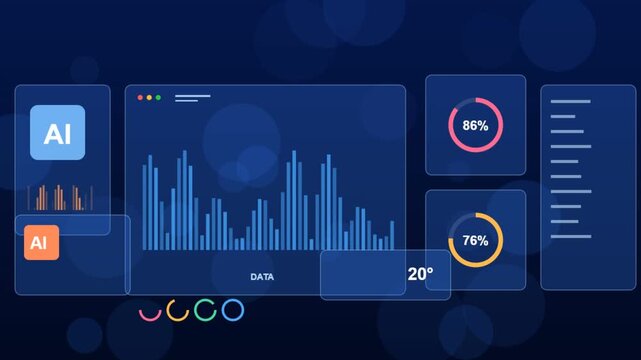
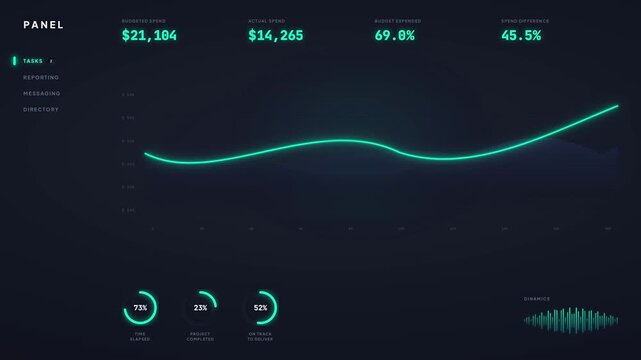
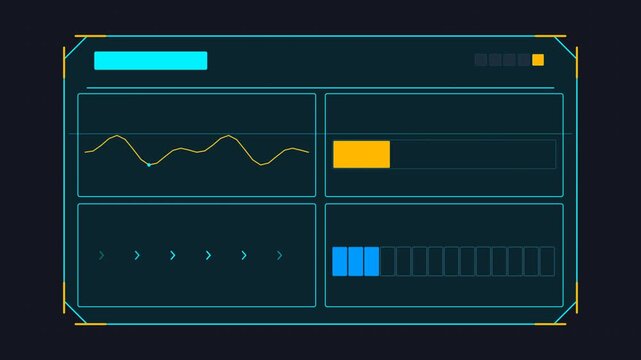
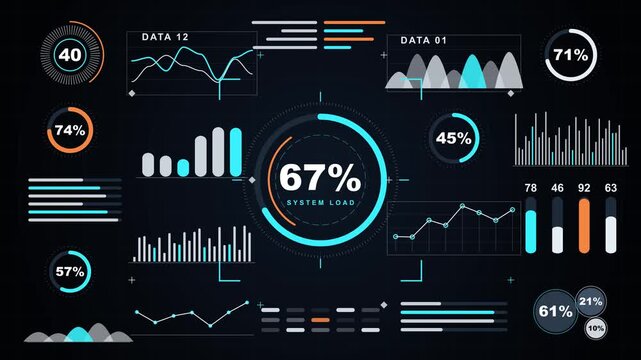
chart data graph hud ui
” w kategorii: wszystko
Wyniki w kategorii wideo: 5 166
00:10
HD
00:20
HD
00:10
HD
00:08
HD
00:10
HD
00:10
HD
00:10
HD
00:32
HD
00:10
HD
00:10
HD
00:10
HD
00:08
HD
00:15
HD
00:05
HD
00:06
HD
00:12
HD
00:10
HD
00:08
HD
00:10
HD
00:11
HD
00:10
HD
00:06
HD
00:08
HD
00:13
HD
00:08
HD
00:10
HD
00:08
HD
00:16
HD
00:08
HD
00:21
HD
00:05
HD
00:10
HD
00:07
HD
00:15
HD
00:10
HD
00:11
HD
00:08
HD
00:10
HD
00:11
HD
00:06
HD
00:12
HD
00:10
HD
00:10
HD
00:10
HD
00:20
HD
00:10
HD
Wypróbuj również:
chart data graph hud ui
w kategorii obrazy
,
chart data graph hud ui
w kategorii wideo
,
chart data graph hud ui
w kategorii szablony
,
chart data graph hud ui
w kategorii Premium
OK
OK
OK
Wybierz region
Wybór regionu może spowodować zmianę języka i treści promocyjnych na stronie usługi Adobe Stock.
Ameryka Północna
Canada - English
Canada - Français
El Salvador
México
República Dominicana
United States
Ameryka Południowa
Argentina
Bahamas
Barbados
Bolivia
Brasil
Chile
Colombia
Costa Rica
Ecuador
Guatemala
Honduras
Jamaica
Nicaragua - English
Panamá
Paraguay
Perú
Trinidad and Tobago
Uruguay
Venezuela
Europa, Bliski Wschód i Afryka
Algeria - English
Armenia - English
Azerbaijan - English
Bahrain - English
Belgium - English
Belgique - Français
België - Nederlands
Česká republika
Croatia - English
Cyprus - English
Danmark
Georgia - English
Deutschland
Eesti
Egypt - English
España
Finland - English
France
Greece - English
Hungary - English
Iceland - English
Ireland
Israel - English
Italia
Jordan - English
Казахстан
Kenya - English
Kuwait - English
Киргизия
Latvija
Lebanon - English
Lietuva
Luxembourg - Deutsch
Luxembourg - English
Luxembourg - Français
Mauritius - English
Moldova - English
Malta - English
Morocco - English
Nederland
Nigeria
Norge
Oman - English
Österreich
Россия
Polska
Portugal
Qatar - English
România
Saudi Arabia - English
Schweiz
Slovenija
Slovensko
Suisse
Sverige
Svizzera
Таджикистан
Turkey - English
Turkmenistan - English
UAE - English
Україна
United Kingdom
Узбекистан
България
Azja / Ocean Spokojny
Australia
Indonesia - English
中國香港特別行政區
India
日本
한국
中華人民共和國澳門特別行政區
Malaysia - English
New Zealand
ประเทศไทย
Philippines
Singapore
Sri Lanka - English
台灣地區
Vietnam - English