Link do ustawienia hasła został wysłany na adres W przyszłości dostęp do zakupów będzie można uzyskać po podaniu hasła.
W ramach bezpłatnego okresu próbnego uzyskasz 3 wideo lub 25 obrazów
Dodano nowe filtry
Sortuj wg

1 901 wyników wyszukiwania „quant” w kategorii: wideo

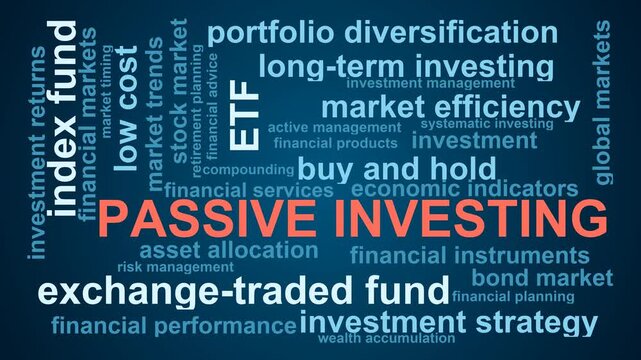
Passive Investing Word Cloud
00:11
HD
Futuristic AI robot analyzing stock market charts and financial data on a digital trading dashboard.
00:12
HD
Swiss Platinum Holographic Order Book Trading Stock Market Motion Graphics Loop
00:05
HD
A vibrant and intricate mountain range, created using computer graphics. Macro shot of dynamic convexity + skew factor graphs driven by AI, cinematic future quant finance, ai driven investment fund
00:05
HD
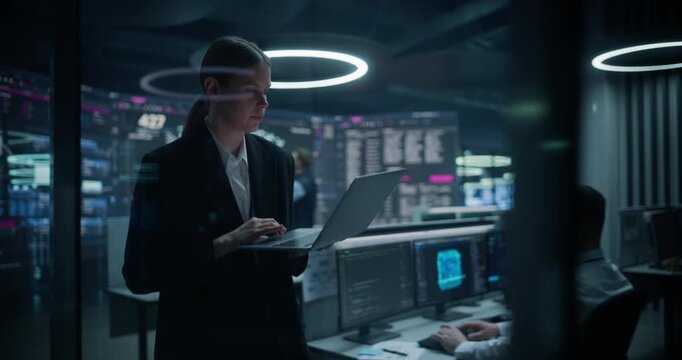
Quantitative Analyst Working on a Laptop to Boost Ecommerce Conversion and Payment Flows While Male Specialists Track Neural Network, Freight and Threat Defence Walls in a Big Data Command Centre.
00:10
HD
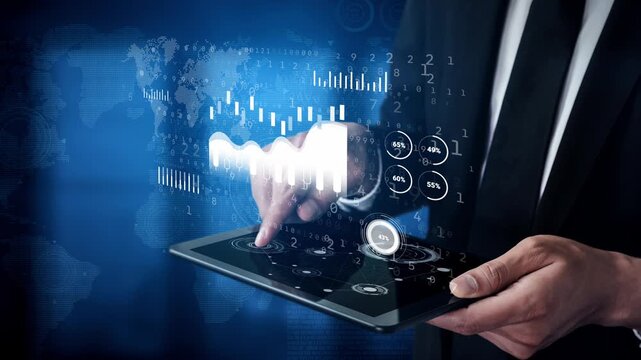
Business Professional Using Tablet with Digital Interface and Global Analytics in Background for Technology and Innovation Themes. Entropy.
00:10
HD
Expansive wide angle surveying a corporate fintech dashboard featuring a analytical blue institutional trading platform inside a comprehensive quantitative trading panels displaying English metrics.
00:10
HD
Evaluating corporate numerical statistics through quantitative analytics models
00:18
HD
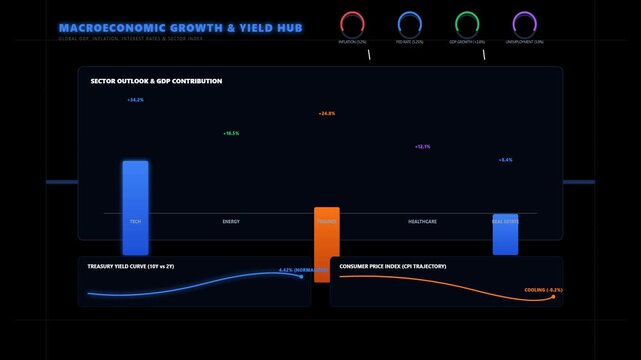
Macroeconomic Growth and Market Yield Hub Financial Data Dashboard with Dynamic Analytics Charts
00:10
HD
Focused display of a sophisticated multiasset riskreturn frontier generated by quantum algorithms with blurred financial dashboards creating depth.
00:05
HD
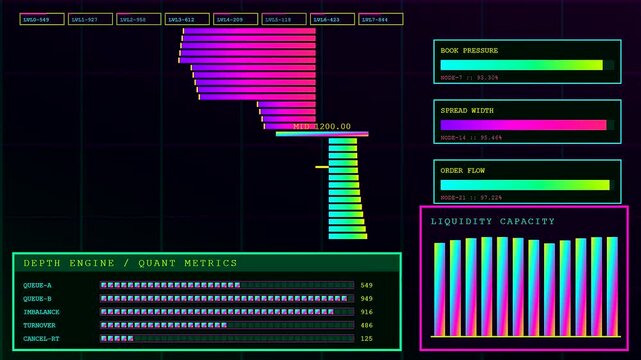
Data flow visualization showing algorithmic trading metrics with neon gradient bar charts flickering on a dark digital interface during complex financial market analysis for modern traders
00:06
HD
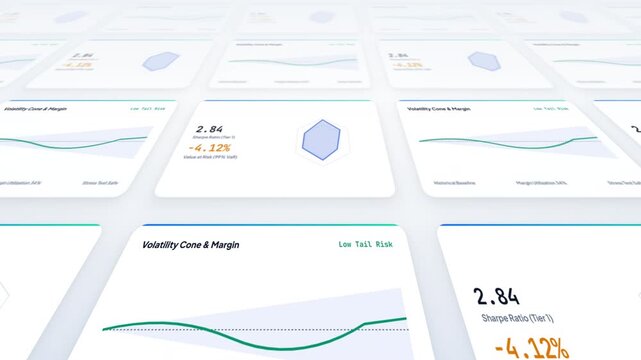
Quant Hedge Fund Risk Analysis Sharpe Ratio Radar 3D Isometric Dashboard 4K Loop on Clean Background
00:10
HD
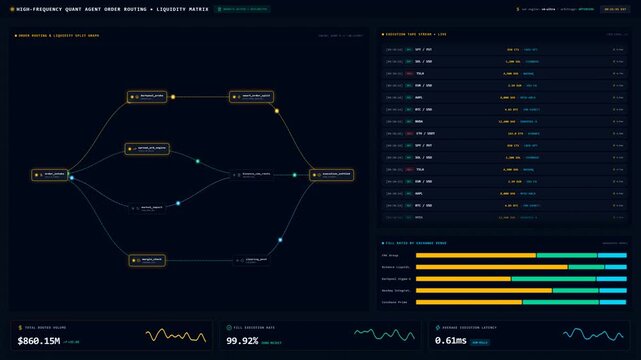
Quant Trading Order Routing and Liquidity Matrix Dashboard
00:12
HD
Digital Financial Candlestick Chart Animated Growth Loop
00:30
HD
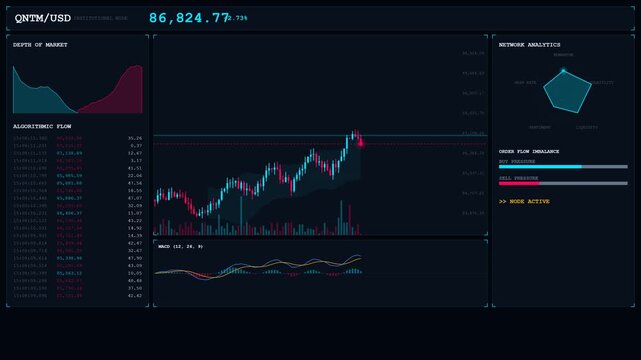
An ultra-complex 4K institutional quant trading terminal. Features algorithmic order flow, Depth of Market (DOM) mountain charts, MACD oscillators, Bollinger Bands, and a procedural polygon radar scan
00:10
HD
Digital ESG Statistics Amid Financial Terrains
00:05
HD
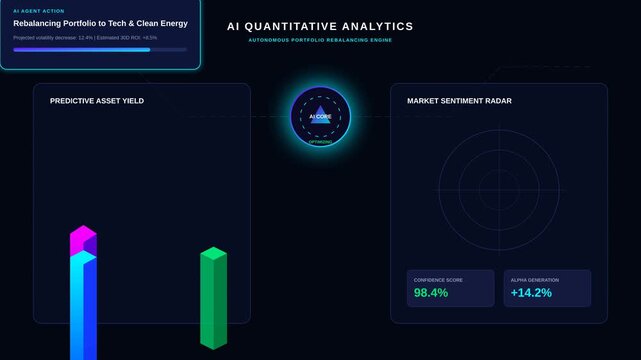
AI Quantitative Analytics Dashboard Displaying Portfolio Rebalancing and Market Sentiment Data
00:10
HD
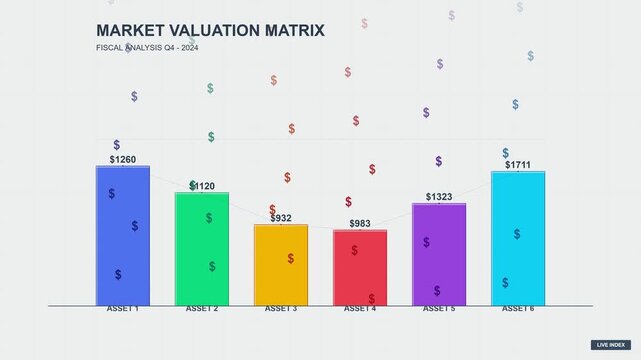
Dynamic Market Valuation Matrix Bar Chart Showing Financial Asset Performance
00:10
HD
High Frequency Algorithmic Auto Trading System POV Fast Coding 4K Animation
00:15
HD
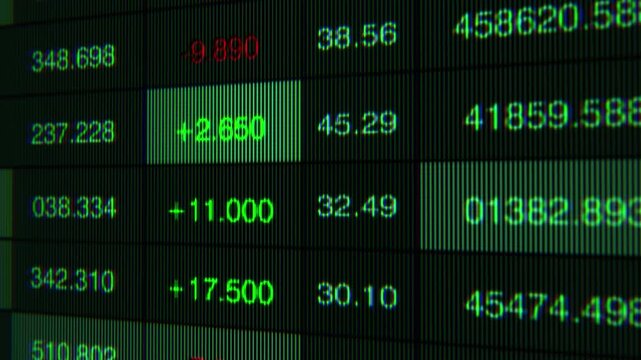
Detailed Analysis of Stock Market Data: A Close-Up of Numerical Fluctuations and Trends with Color-Coded Indicators Reflecting Market Changes
00:20
HD
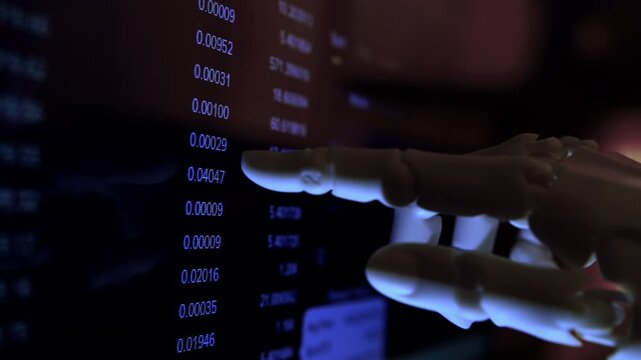
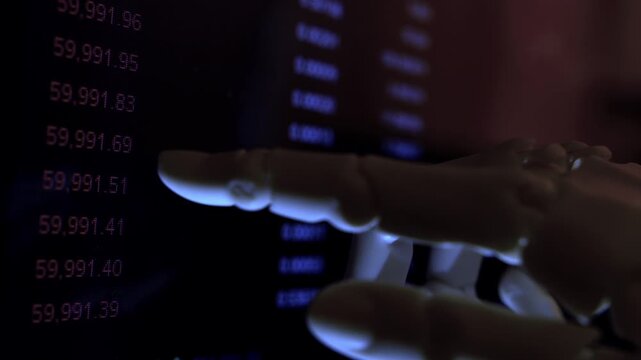
AI humanoid robot arm reading financial charts on a monitor. Premium low-key close-up shot of artificial intelligence in business.
00:16
HD
Real Time Stock Market Trading Terminal Interface Motion Graphics
00:10
HD
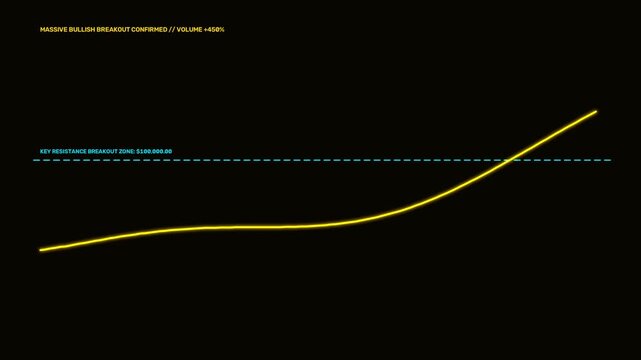
Bullion Gold Bullish Resistance Breakout Trading Stock Market Motion Graphics Loop
00:05
HD
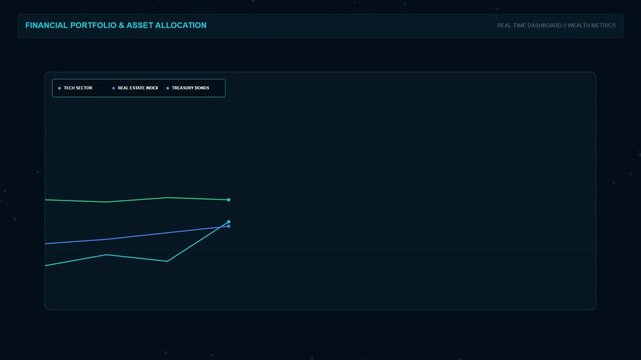
Financial Portfolio and Asset Allocation Dashboard Analytics
00:15
HD
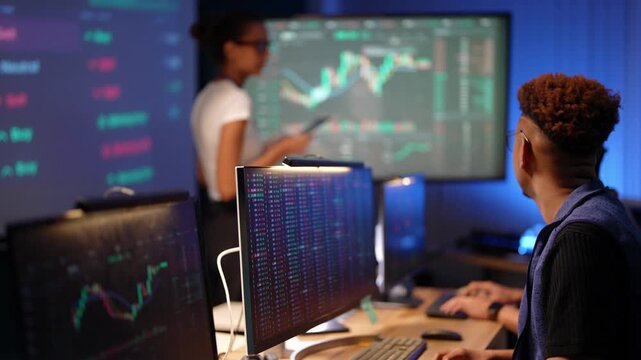
Black developer with glasses and a fade haircut focuses on his trading monitor then turns toward a Latina analyst checking a stock chart on her tablet beside the large wall screen
00:10
HD
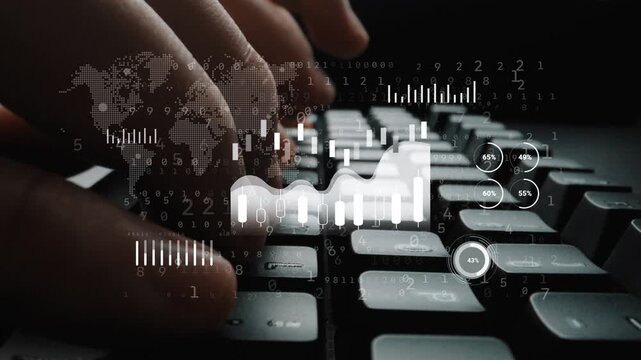
Hands Typing on Keyboard with Digital Overlay of Global Data and Statistics, Technology Concept for Cybersecurity and Analytics. Entropy.
00:10
HD
Dual perspective view over a corporate fintech dashboard featuring a analytical blue institutional trading platform inside a complex holographic neural networks displaying English metrics.
00:10
HD
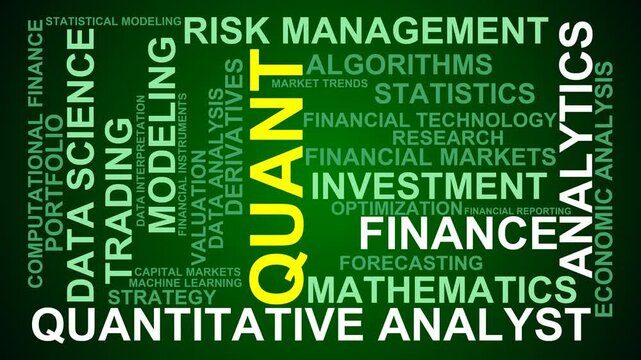
Quant Word Cloud
00:11
HD
Digital financial candlestick chart interface
00:10
HD
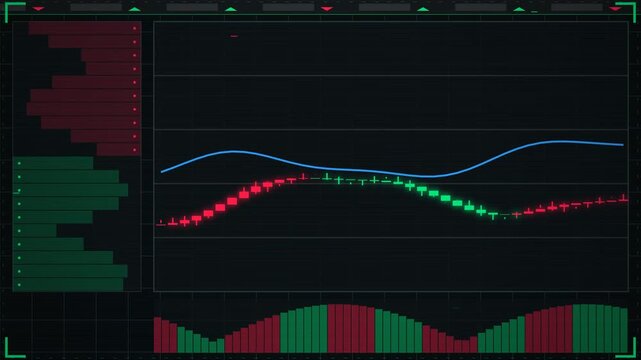
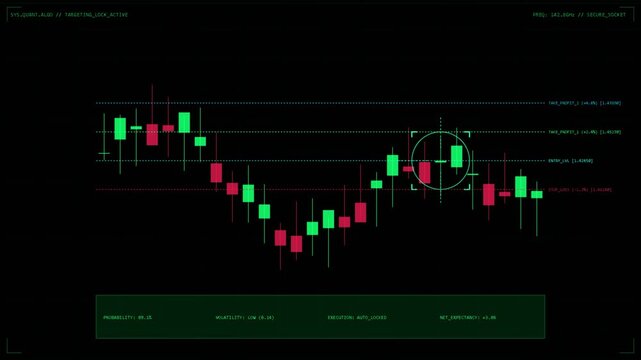
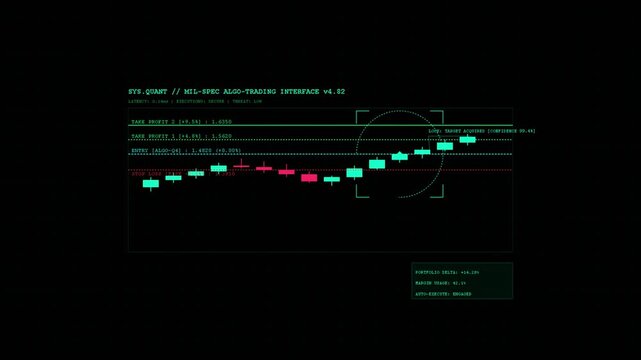
Cyber Sci-Fi HUD Financial Algorithmic Trading Screen Display
00:10
HD
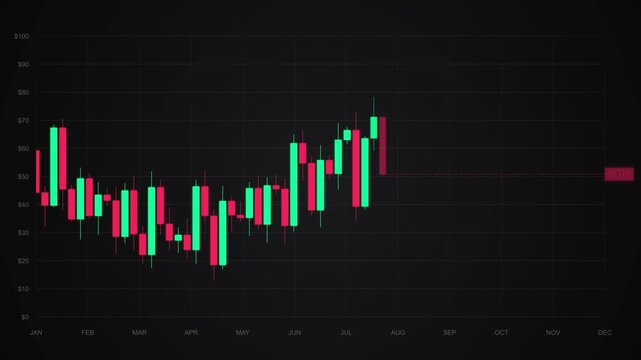
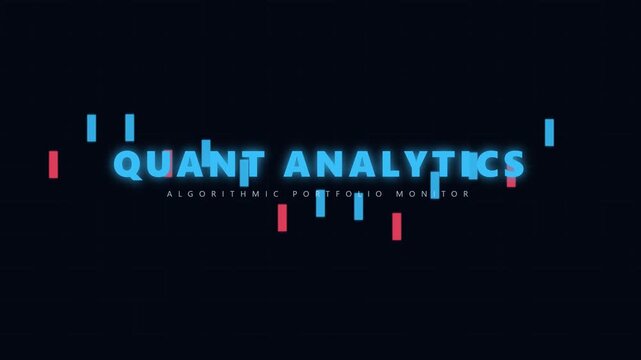
Quant analytics text animation with financial candle chart bars
00:08
HD
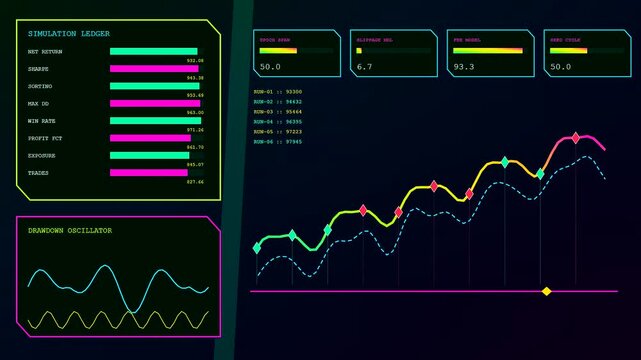
Three screens displaying algorithmic trading analytics with changing financial line charts and glowing data ledger interface panels on a dark purple digital monitor display surface
00:06
HD
Digital algorithmic trading interface dashboard
00:10
HD
Animated Japanese Candlestick Chart Fluctuating Over Time
00:30
HD
AI Neural Wealth Intelligence and Global Trading Core Loop
00:10
HD
Capturing the dynamic movement of stock market trends, this video showcases vibrant charts with colorful candlestick patterns, ideal for illustrating financial data analysis tools.
00:10
HD
Futuristic finance and stock market with grid and wavy lines background
00:20
HD
Animated Fibonacci Retracement Chart Showing Market Technical Analysis
00:10
HD
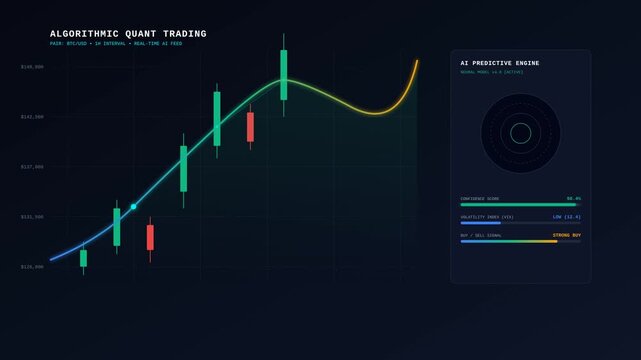
Algorithmic Quant Trading Chart Showing Real Time Financial Market Analysis Data Visualization UI
00:10
HD
Digital financial trading chart with candlestick patterns
00:10
HD
AI robotic arm analyzing high-frequency financial data on a monitor. Close-up footage with shallow depth of field in dim light.
00:38
HD
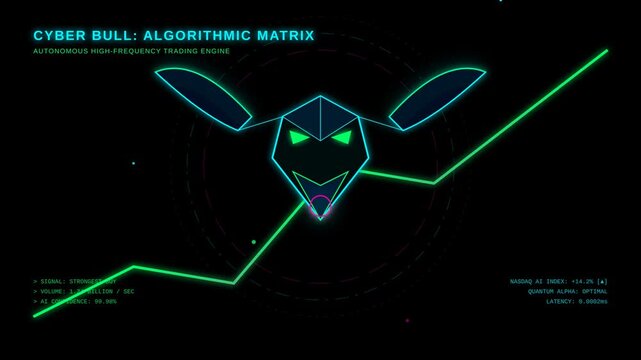
An Innovative Cyber Bull Infographic Showcasing an Algorithmic Trading Matrix with Autonomous High-Frequency Strategies in a Digital Landscape
00:10
HD
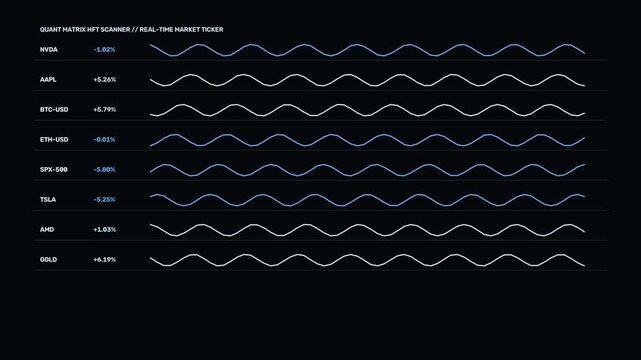
Swiss Platinum Algorithmic Ticker Matrix Trading Stock Market Motion Graphics Loop
00:05
HD
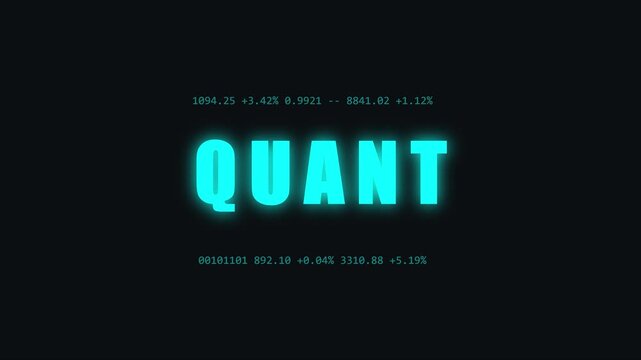
Quant trading concept with glowing neon text and financial market data analysis animation 4k background
00:10
HD
Dynamic Financial Candlestick Chart Animation Growing Over Time.
00:10
HD
Close-up of Hands Typing on Keyboard with Digital Data Overlay and Graphical Elements Representing Technology and Analytics. Entropy.
00:10
HD
High-speed sequence tracking a bull market trading terminal featuring a glowing green financial data interface inside a rapid flow of algorithmic capital metrics displaying English metrics.
00:10
HD
Quantitative Investing Word Cloud
00:11
HD
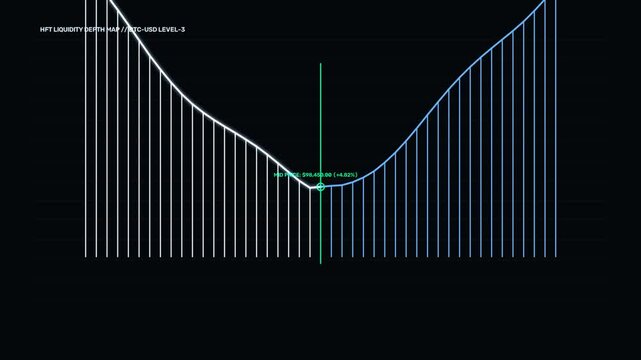
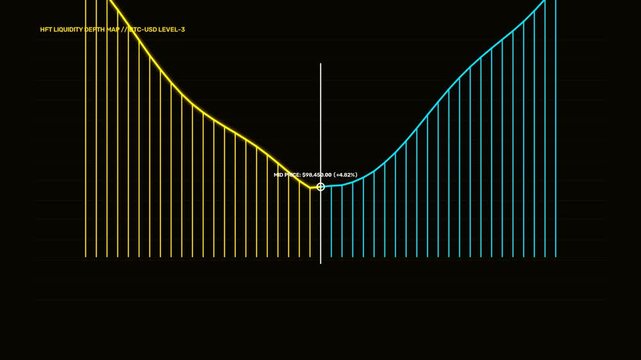
High Frequency Trading Order Book and Volumetric Market Flow Data
00:10
HD
Video of fresh fruit and vegetables over wooden background
00:12
HD
Psychedelic 3d animated purple background
00:20
HD
a colorful algorithmic trading display showing fluctuating digital market metrics and latency graphs on a dark grid interface during a session of rapid financial monitoring activity
00:06
HD
Stock market chart shows data trends over time with bars indicating price movements in trading activity.
00:10
HD
Stock Market Candlestick Chart Trend Visualization
00:10
HD
Digital animation of data processing against swirly light trails on blue background
00:10
HD
Journey through an electrifying digital landscape filled with vivid color contrasts as market trends pulse, revealing data insights and analytics that shape decisions in real time.
00:10
HD
Senior Analyst Scrutinizes Investment Portfolios And Risk Assessments Amid Dim Blue Ambient Lighting
00:10
HD
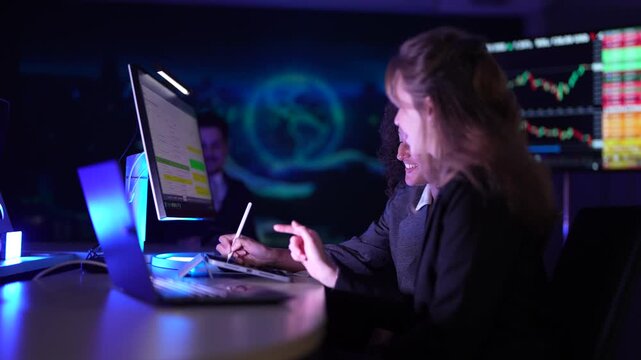
Female fintech data scientists analyzing real-time cryptocurrency market volatility charts. Quantitative analysts developing high-frequency algorithmic trading strategies on multi-screen dashboard set
00:20
HD
Dynamische Quantenfelder mit Partikelinterferenzen
00:10
HD
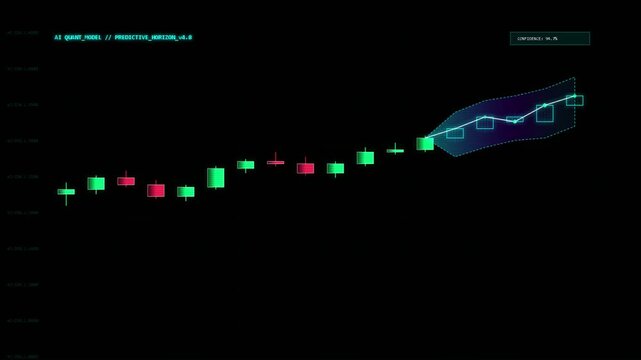
Ai financial predictive chart with candlestick data analysis
00:10
HD
Micro-chip quantum processor, micro-processor with board electronic CPU. Wireframe low poly mesh technology. Available in 4K FullHD and HD video
00:20
HD
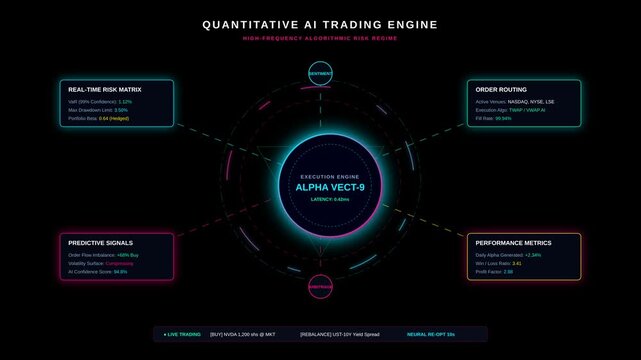
High-Frequency Algorithmic Trading Matrix with Quantitative AI Insights for Real-Time Risk Management in 4K Visual Presentation
00:10
HD
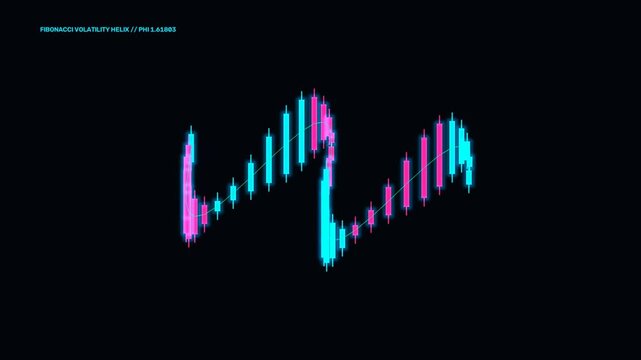
Quant Cyan Fibonacci Candlestick Helix Trading Stock Market Motion Graphics Loop
00:05
HD
aerial push in over quant church near fries virginia
00:21
HD
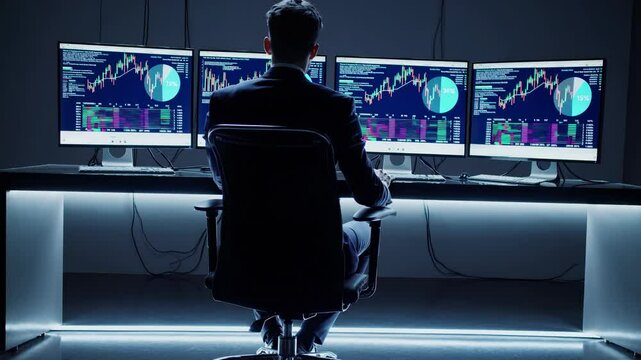
A Male Quant Engineer Analyzing Machine-Learning Trading Patterns
00:10
HD
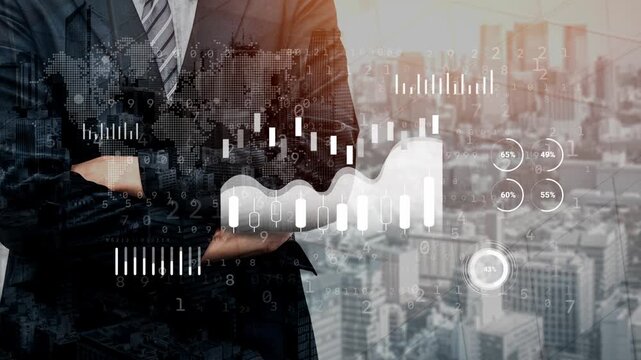
Businessman in Suit Overlooking Cityscape with Digital Visualization of Data Analytics and Global Market Trends in Background. Entropy.
00:10
HD
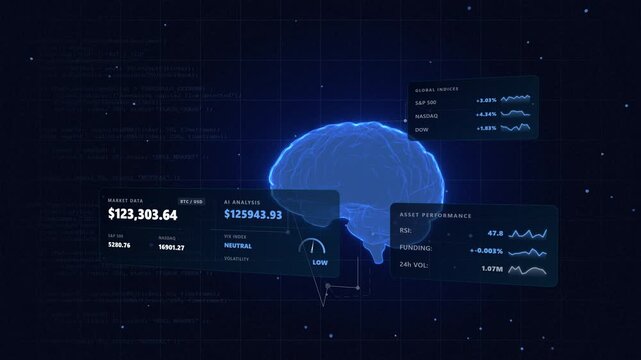
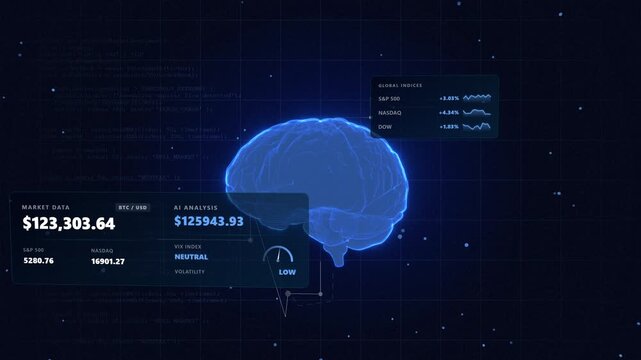
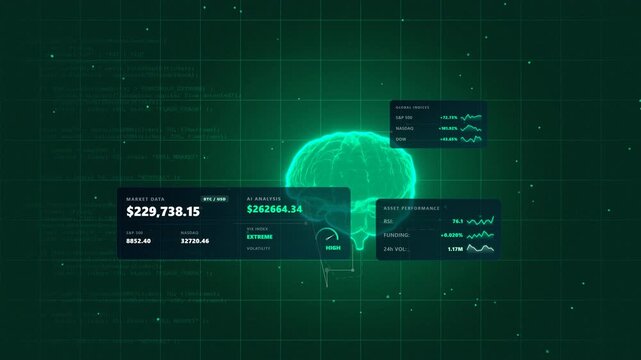
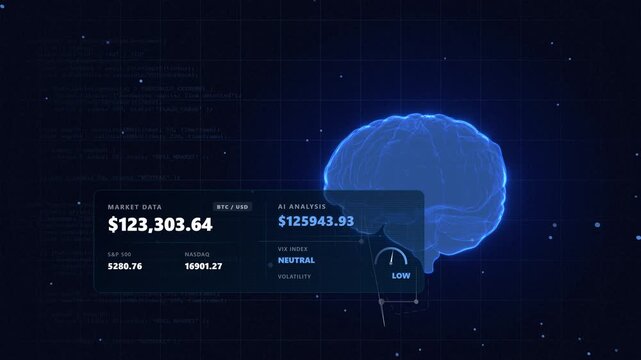
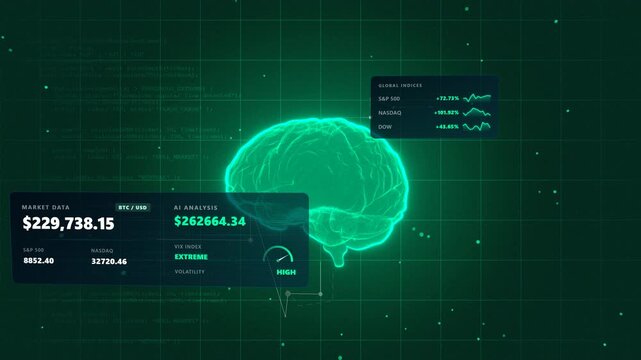
Cinematic focus on a corporate fintech dashboard featuring a analytical blue institutional trading platform inside a rotating cybernetic brain with data nodes displaying English metrics.
00:10
HD
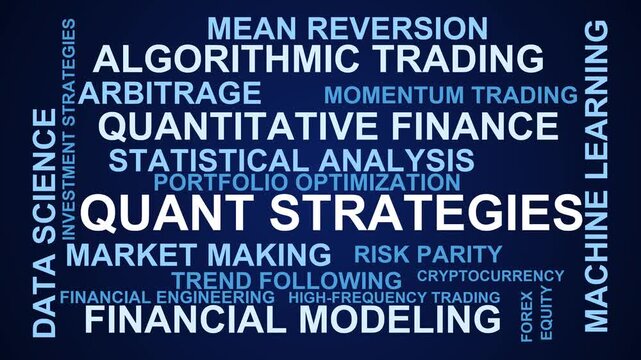
Quant Strategies Word Cloud
00:11
HD
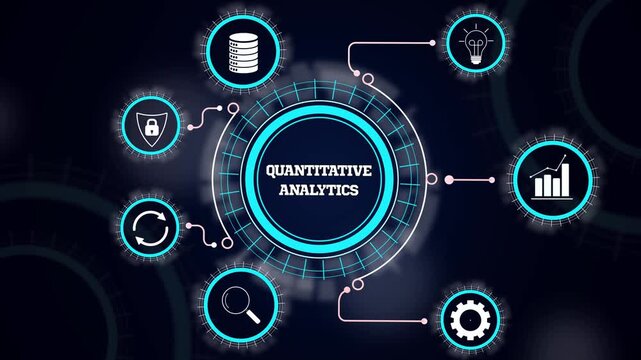
Quant technology concept with connected icons and text| Advanced 4K Business Visualization
00:10
HD
Professional desk monitors trading data on screens. Analytics tools display future crypto trends. Technology supports decisions. Trading charts shift in real-time using crypto analytics data streams
00:09
HD
Statistics, financial market data, analysis and reports, numbers and graphs
00:30
HD
Abstract fractal forms morph and oscillate (Loop)
00:08
HD
Atom with orbiting electrons, looped animation
00:10
HD
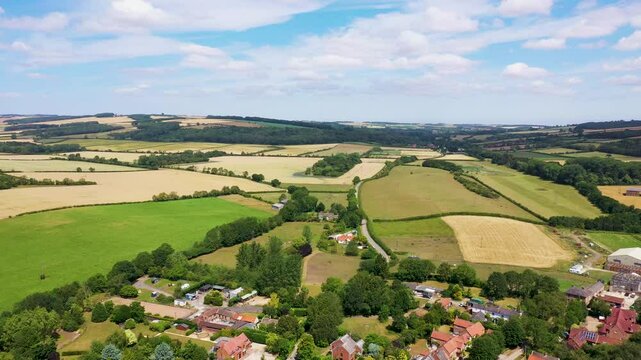
Aerial drone footage of the beautiful village of Burnby in the East Riding of Yorkshire, near York in the UK showing the quant little village alongside farmers fields and hill's in the summer time
00:23
HD
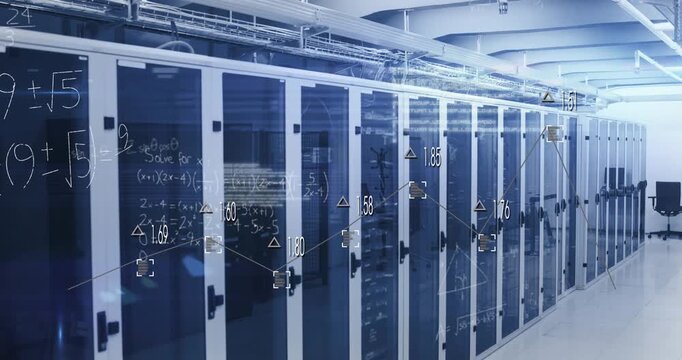
Animation of equations, graphs with digits, database and lens flare over server room in background
00:12
HD
Establish business risk assessment models with quantitative analytics and data driven insights to evaluate vulnerabilities and implement effective mitigation measures systematically. in  Photo Stock
00:05
HD
Stevenson Dam Hydroelectric Plant During Winter Time In Monroe, Connecticut
00:16
HD
Female fintech data scientists analyzing real-time cryptocurrency market volatility charts. Quantitative analysts developing high-frequency algorithmic trading strategies on multi-screen dashboard set
00:12
HD
Wissenschaftliches Labor mit Quantenforschung
00:10
HD
Animation of glass, spirals of golden abstract curved lines and shapes developing in a spiral. Organic view. 3D rendering.
00:10
HD
A digital display of stock market data with vibrant colors and reflections.
00:10
HD
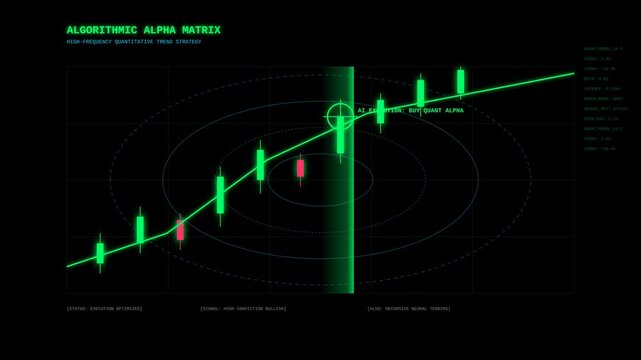
Abstract Visualization of Algorithmic Alpha Matrix Showing Quantitative Trends in 16x9 Format with 4K Resolution Ideal for Data-Driven Insights and Analyses
00:10
HD
Bullion Gold Holographic Order Book Trading Stock Market Motion Graphics Loop
00:05
HD
Dreamy dolly into a picturesque and quant European capital city with pedestrian and car traffic taking advantage of the beautiful day
00:30
HD
Video of fresh fruit and vegetables with heart shaped copy space over wooden background
00:16
HD
Businesswoman using smartphone with digital interface overlaid on city skyline, data analysis, technology and finance concept, urban landscape background. Entropy.
00:10
HD
Dual perspective view over a bull market trading terminal featuring a glowing green financial data interface inside a complex holographic neural networks displaying English metrics.
00:10
HD
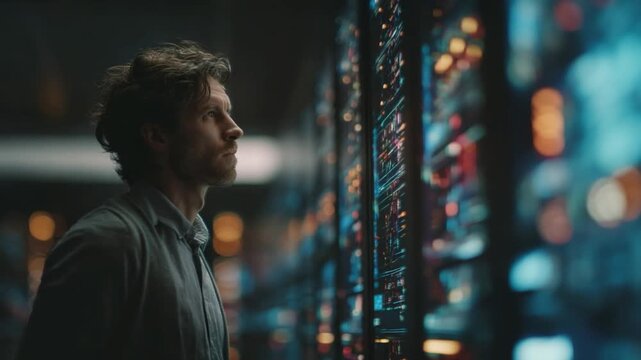
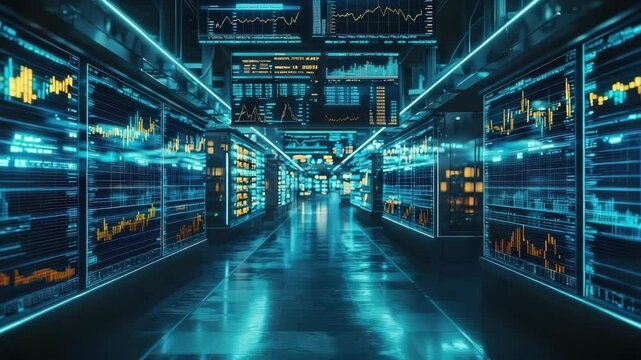
A futuristic data center hallway lined with digital screens displaying colorful financial charts and analytics in neon lighting.
00:10
HD
Colorful data stream illuminates the digital landscape, showcasing vibrant numbers and intricate patterns in a futuristic world. Generative AI
00:21
HD
power energy rotating atom cell element background
00:20
HD
Untitled Project3D Animated Looped Circuit Board Room Floor and Ceiling blue neon grid (electrified field). Retro futuristic animation element. Board electronic CPU Wireframe low poly mesh technology
00:06
HD
Abstract fractal forms morph and oscillate (Loop)
00:06
HD
DodgerBlue RoyalBlue LightSkyBlue PowderBlue
00:10
HD
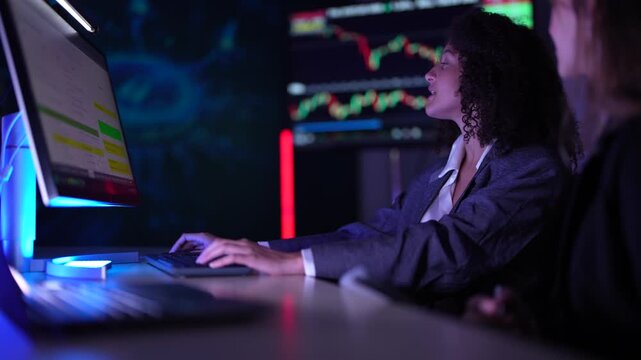
Professional trader showcases confidence financial analysis, analyzing market trends and investment strategies with focused determination
00:05
HD
The globe is rotating against a city background
00:15
HD
Fictional stock market tickers illuminated in vibrant colors, showcasing financial data in a futuristic environment, Stock market fictional tickers 3D render
00:10
HD
Two Men Meet At An Abandoned Factory During Winter Time In Derby, Connecticut
00:12
HD
Female fintech data scientists analyzing real-time cryptocurrency market volatility charts. Quantitative analysts developing high-frequency algorithmic trading strategies on multi-screen dashboard set
00:30
HD
Quantenmechanische Netzstrukturen mit Datenübertragung
00:10
HD
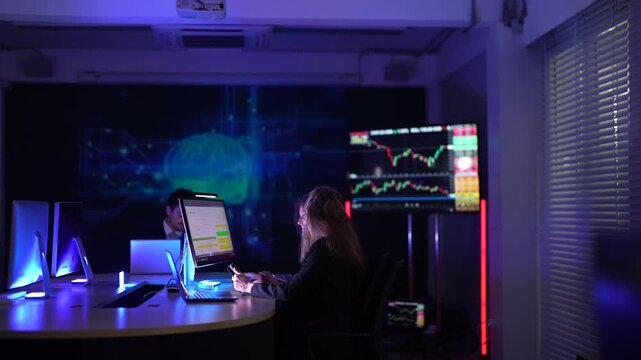
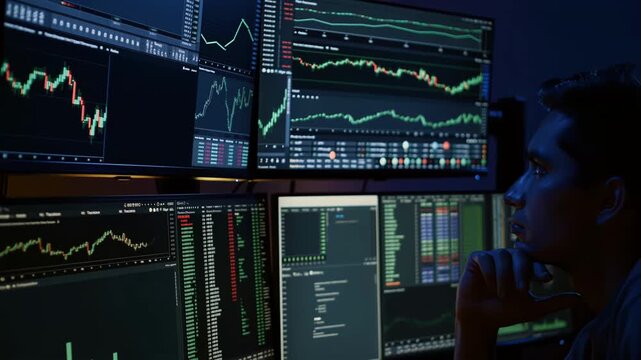
night trading desk monitors display charts. focused male trader reviews candlestick patterns, live tickers, portfolio analytics and code terminals on multi screen setup in dimly lit room, blue glow
00:05
HD