Link do ustawienia hasła został wysłany na adres W przyszłości dostęp do zakupów będzie można uzyskać po podaniu hasła.
W ramach bezpłatnego okresu próbnego uzyskasz 3 wideo lub 25 obrazów
Dodano nowe filtry
Sortuj wg

6 690 wyników wyszukiwania „normal distribution” w kategorii: wideo

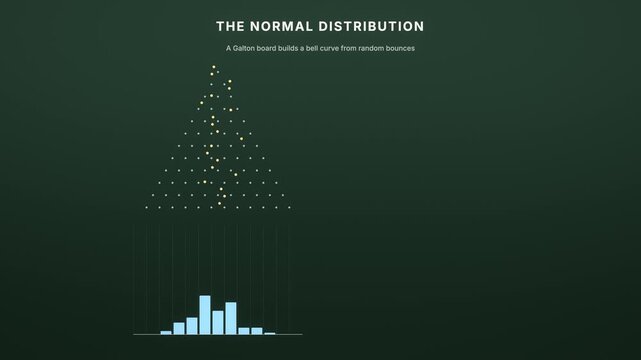
Galton board balls building a normal distribution bell curve on a chalkboard, seamless loop
00:15
HD
Bell curve graph and grid animation on green screen
00:05
HD
Logistics, supply chain and digital network for business distribution, warehouse management and global shipping. Technology, internet and connection with data icons, automation and parcel delivery fl
00:06
HD
Dense magenta points open center, sparkling strands into black backdrop. neon particle portal animation adds luminous texture to cinematic intros, visual effects, creative video edits motion titles.
00:10
HD
A uniform field of tiny black dots evenly distributed across a clean white background, creating a subtle speckled texture and a minimalist pattern
00:10
HD
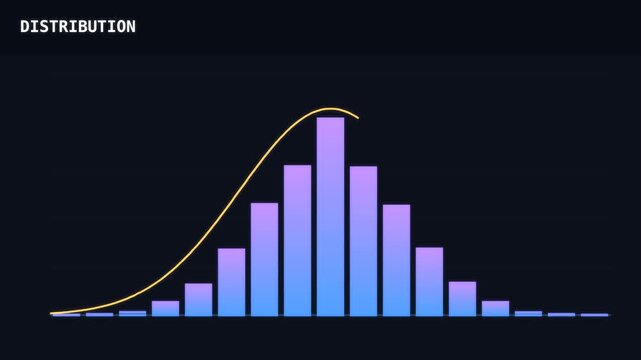
Animated normal distribution bell curve and rising bar graph for probability statistics on dark background.
00:10
HD
Skid of Concrete Bricks, Close Up
00:12
HD
A vibrant heat map displays thermal energy distribution with a colorful gradient, showcasing temperature variations on black background. Loop animation
00:20
HD
Animated Bell Curve Diagram With Shaded Central Area
00:08
HD
A digital Wage Stream interface displays fluctuating neon graphical data distribution patterns within a synthetic dark environment featuring multiple moving flow paths and vibrant pulsing bar charts
00:06
HD
a quantitative risk assessment dashboard displays statistical probability curves with changing mathematical metrics on a dark glowing interface that visualizes predictive financial market data trends
00:06
HD
Normal Distribution Statistical Distribution Animation Labeled Alpha Channel 4K
00:07
HD
Aerial view of massive logistics distribution centre rooftop with integrated solar panel array and HVAC cooling units.
00:16
HD
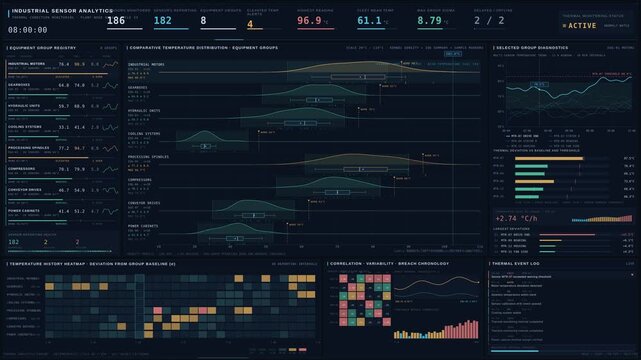
Premium 4K industrial sensor analytics dashboard comparing temperature patterns across equipment groups with detailed thermal telemetry and condition monitoring visualizations.
00:15
HD
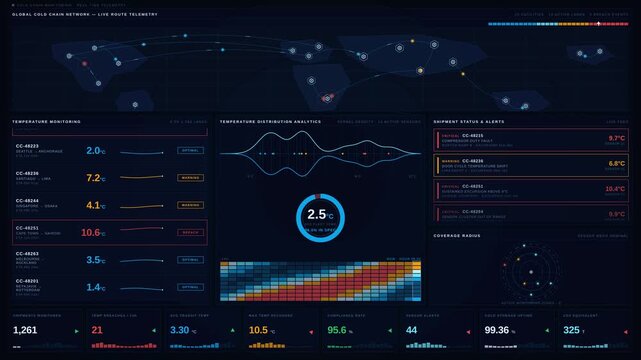
Experience a high-tech cold chain monitoring dashboard in dark mode showcasing temperature locations and shipment statuses with animated frost patterns and dynamic visuals.
00:15
HD
Policy scenarios fan out from 4.25 toward hike and hold branches
00:08
HD
Stakes of fresh chicken eggs in red plastic trays at wholesale market, large group of raw eggs for food industry and retail business, poultry farm production concept.
00:10
HD
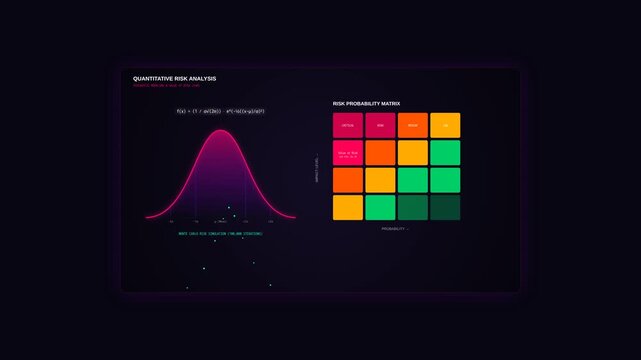
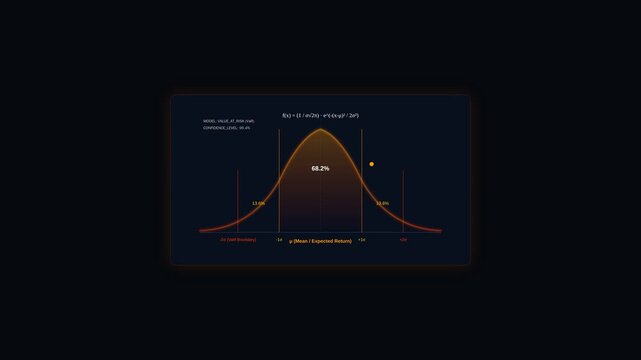
Quantitative Risk Analysis Dashboard Showing Normal Distribution Graph and Probability Matrix Grid
00:10
HD
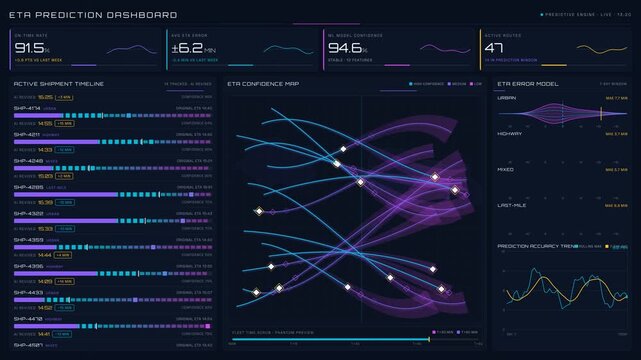
Innovative ETA Prediction Dashboard with Active Shipment Timeline, ETA Confidence Map, and Error Distribution Visualization in Deep Oceanic Colors professional stock footage for technology, business,.
00:15
HD
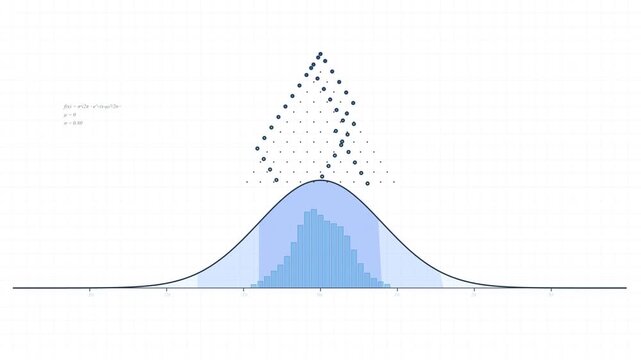
Galton Board Bean Machine Bell Curve Statistics Reveal
00:15
HD
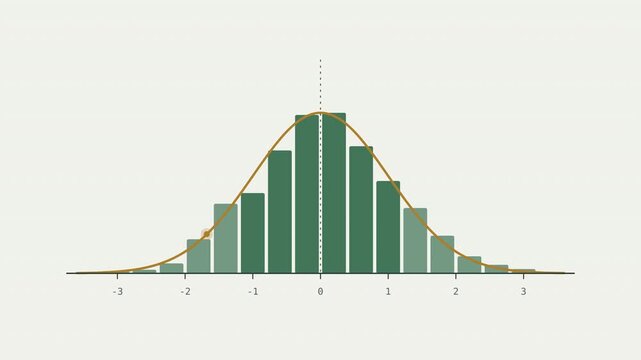
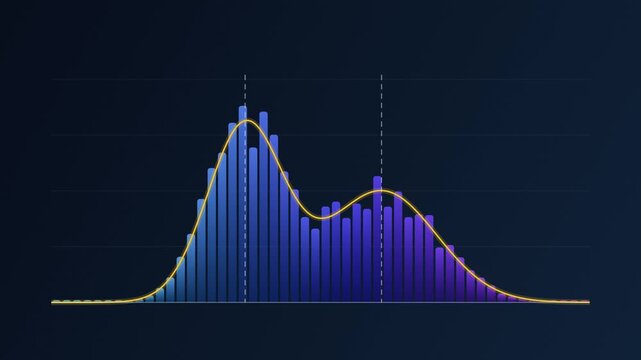
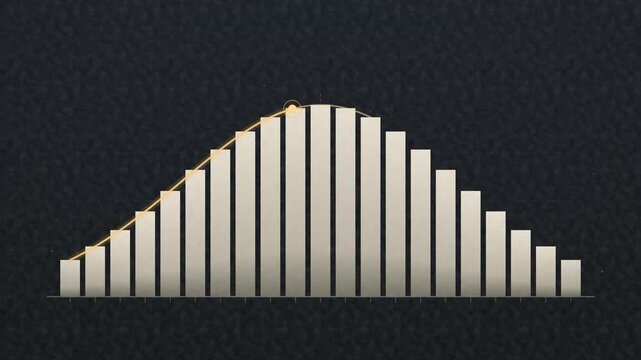
Animated histogram with bell curve overlay
00:10
HD
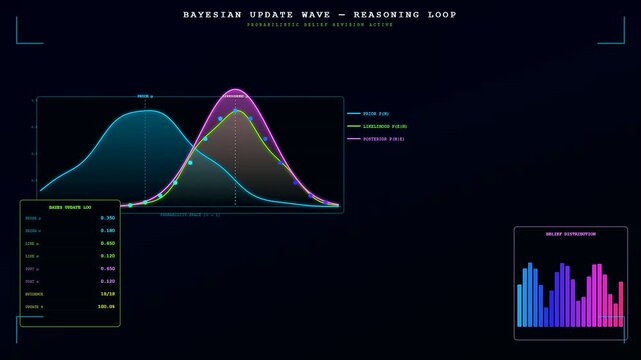
A digital reasoning loop shows probability distribution curves moving across three sequential screens within a dark interface featuring glowing cyan pink and green line charts
00:06
HD
Blue Ink Math and Physics Formulas Scrolling on Grid Paper With Layered Depth, Handwritten Equations Education Background
00:10
HD
Aerial view of rows of new cars parked at the Civitavecchia Port, showing the organized automotive storage area with various vehicle colors and patterns in Civitavecchia, Lazio, Italy.
00:14
HD
Light blue surface covered with small scattered curved lines creating a minimalist pattern of floating marks
00:09
HD
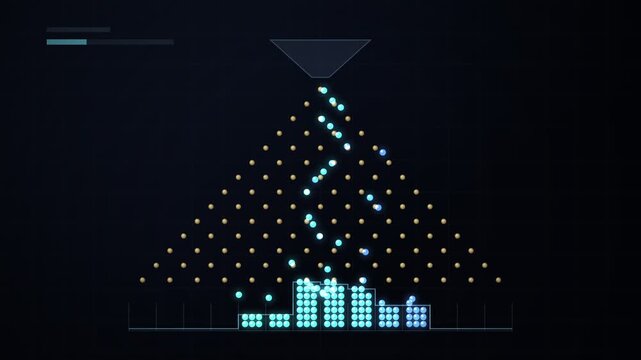
Galton Board Animation Forming Normal Distribution Bell Curve with Mint and Gold Data Blocks, Statistics and Probability Infographic for Education Videos. Seamless Loop
00:14
HD
An overhead drone perspective reveals the dense distribution of cormorant nests on Lake Huron. The birds create a distinct pattern across the island landscape and green shrubs.
00:15
HD
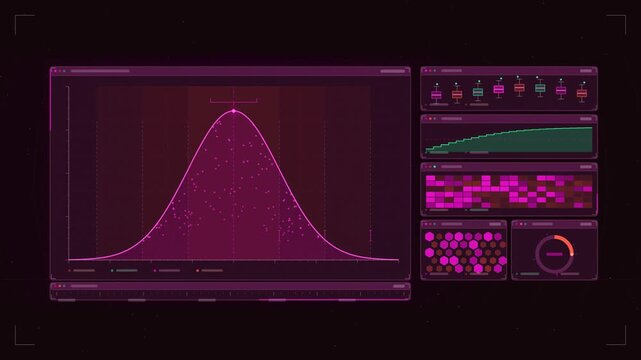
Data dashboard interface displaying statistical bell curve distribution, predictive analytics, market trends, performance metrics, financial reports
00:09
HD
Red Abstract Particles Scattered on White Background
Minimal Red Dust Particles on Clean White Background
Abstract Red Speckles and Floating Particles
00:15
HD
Histogram Distribution Curve
00:10
HD
Seamless black truck pattern moving across white background
00:10
HD
Statistical Analysis Visualization Featuring A Gaussian Distribution Curve And Mathematical Probability Density Function For Data Modeling
00:10
HD
Scattered alphanumeric characters shifting through dark space with varied brightness and sparse distribution
00:23
HD
Aerial view of industrial pipes for gas, water, and oil running parallel across a green landscape, showcasing a continuous flow of infrastructure and nature in harmony
00:13
HD
Abstract geometric pattern of black and white squares and rectangles in a random distribution, creating a digital mosaic effect
00:10
HD
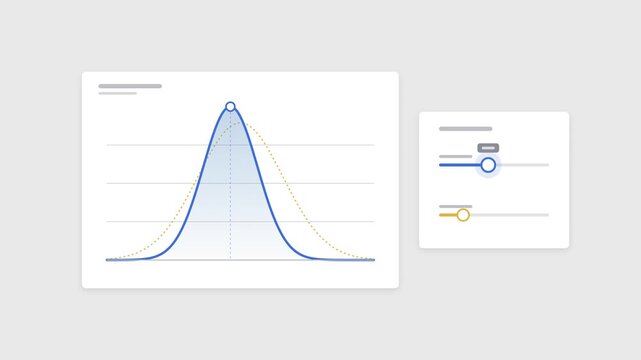
Bell Curve Reshaping As Two Sliders Are Dragged
00:08
HD
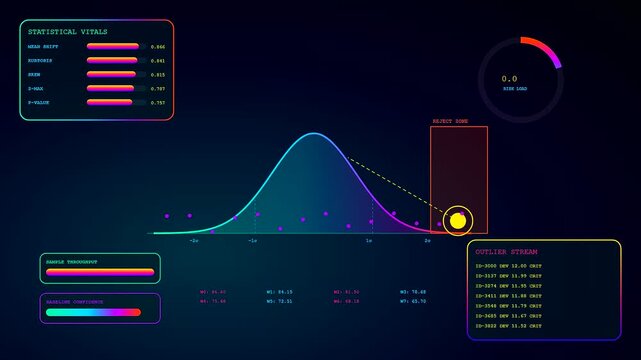
Three panel digital interface showing anomaly detection with statistical vitals and oscillating bell curve graphs displayed on a dark glowing gradient background screen during analysis
00:06
HD
Normal Distribution Bell Curve Animation Visualizing Statistical Probability and Data Variance
00:10
HD
Multiple bright points of light are arranged in vertical patterns against a dark void.
00:30
HD
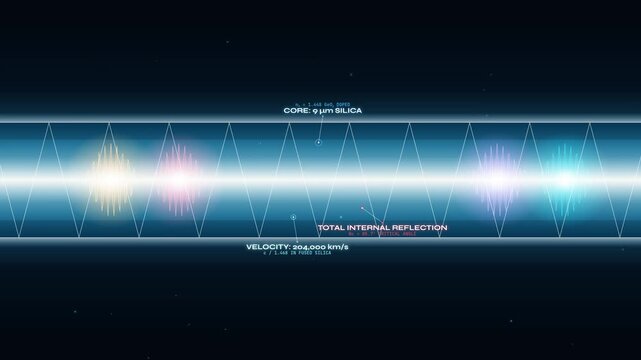
Technical 2D animation detailing the structure and physics of a submarine fiber optic cable, showing core, cladding, armor, light velocity, total internal reflection, and transoceanic transmission
00:59
HD
Dense Field of White Dots on a Dark Black Background pattern
00:12
HD
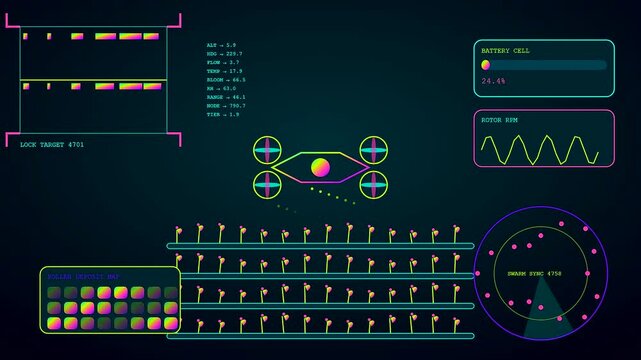
A digital vertical agritech drone interface displays real time swarm telemetry monitoring crop health and pollen distribution patterns across a dark neon blue computer screen monitor
00:06
HD
Probability distribution simulation with falling beads on a galton board
00:05
HD
News typographic pattern with repeating word graphic, broadcasting media template for journalism or information distribution design.
00:10
HD
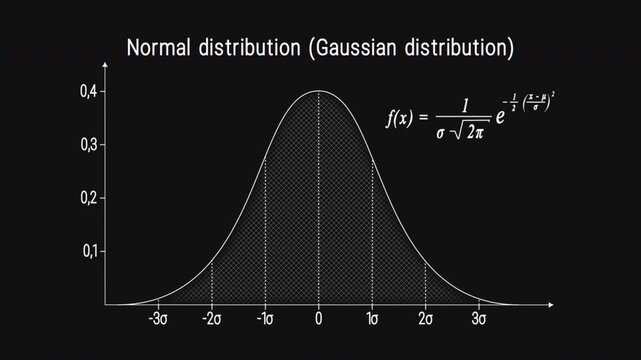
Animations of graphs and formulas for the normal distribution (or Gaussian distribution). Probability theory. Probability density function. Game theory. Mathematical expectation. Standard deviation.
00:21
HD
Aerial view of gantry cranes moving shipping containers at port terminal
00:10
HD
Top down aerial reveals colorful cargo rows as the drone glides at sunset
00:14
HD
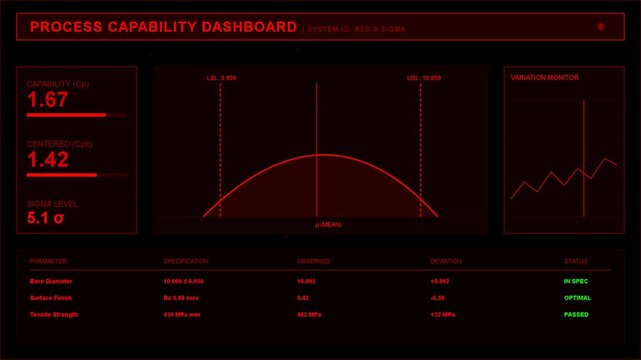
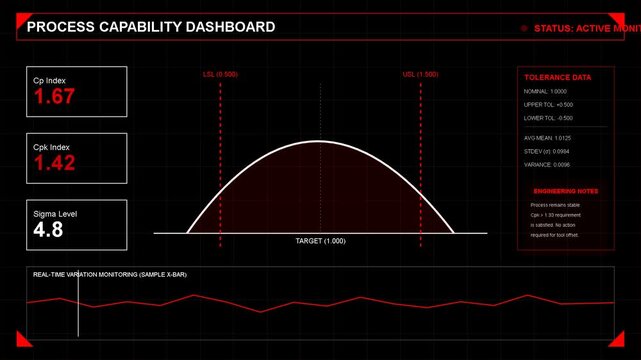
Process capability dashboard with red bell curve distribution chart, statistical data visualization, manufacturing quality control, industrial performance analysis
00:09
HD
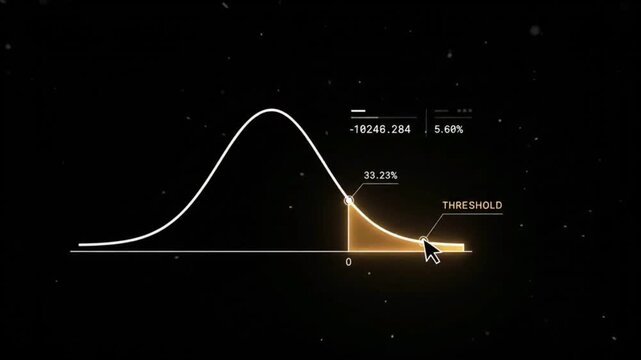
Futuristic Digital Gaussian Bell Curve Data Visualization Value at Risk, Financial Risk Analysis with Volatility Distribution
00:05
HD
Block chain concept. Abstract patterns of distribution of information to everyone on the network. As a chain of connected information with everyone on the network safely
00:10
HD
Black and white pixelated pattern with scattered dots on a dark background
00:10
HD
Reflective fragments receiving impulse rotating down and scattering across transparent background
00:20
HD
Business team analyzing digital data trends and statistics with interactive charts and global map visualization in a modern office environment Gluon.
00:15
HD
normal distribution curve graph animation on white background representing statistics and data analysis
00:10
HD
A/B Test Traffic Split With Distribution Curves Separating To Significance Animation
00:15
HD
Particle texture animation scatters subtle luminous dust specks. Generative ambient graphic design layers shape particle texture animation. Digital backdrops use the texture.
00:12
HD
Aerial view of rows and rows of parked trailers creating a geometric pattern of silver and gray, Greensburg, Indiana, United States.
00:34
HD
Portfolio Risk Analysis Chart Visualizing Normal Distribution and Statistical Confidence Intervals
00:10
HD
Educational animation demonstrating the Law of Large Numbers and the Central Limit Theorem with dynamic graphs and mathematical equations converging into a normal Gaussian distribution bell curve
00:59
HD
Growing Bell Curve Animation Illustrating Data Statistics And Normal Distribution On A Dark Blue Background
00:10
HD
Abstract network of glowing blue nodes and connecting lines evolving across three frames, representing data flow and connections
00:10
HD
Glowing 3D Histogram Bars Morphing Through Statistical Distributions With Data Particles
00:15
HD
Abstract Black and White Dot Pattern with Warped Effect.
00:10
HD
Digital displays showing probability modeling with shifting bell curves and statistical data points on a dark interface representing complex quantitative analysis of various research tests
00:06
HD
Detailed close-up of a dark circular spiral heating plate on an electric stove, highlighting industrial design, metallic ridges, and heat distribution surface.
00:11
HD
Neon blue circular loading progress bar animation with 68% percent counter, digital interface for ui ux and technology projects on black background 4k video
00:07
HD
95 percent circular ring progress bar animation on black alpha channel background
00:05
HD
95% Neon Progress Circle – Glowing Percentage Counter & Loading Animation
00:10
HD
Sea freight is active. Ships fit sea freight. We use sea freight.
00:12
HD
Clean White Galton Board Simulation with Green Balls Dropping into Gaussian Bell Curve Histogram, Probability Distribution Explainer for Math Lessons and Data Reports. Seamless Loop
00:14
HD
Animation of a Galton Board Simulation Forming a Normal Distribution Bell Curve Probability Chart
00:10
HD
Dynamic statistical normal distribution curve rising and falling
00:09
HD
Blue Statistical Distribution Chart with Bars and Curve
00:10
HD
Animated Bell Curve Histogram Chart Representing Statistical Data Distribution
00:11
HD
Plastic ground reinforcement grid prepared for soil filling
00:10
HD
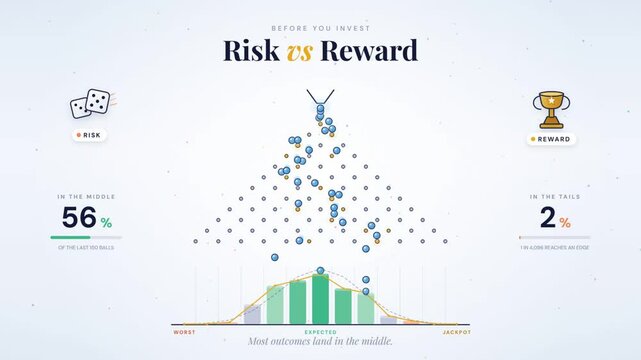
Risk and reward infographic with falling balls forming a bell curve normal distribution
00:18
HD
Aerial view of automotive logistics facility in Italy.
00:10
HD
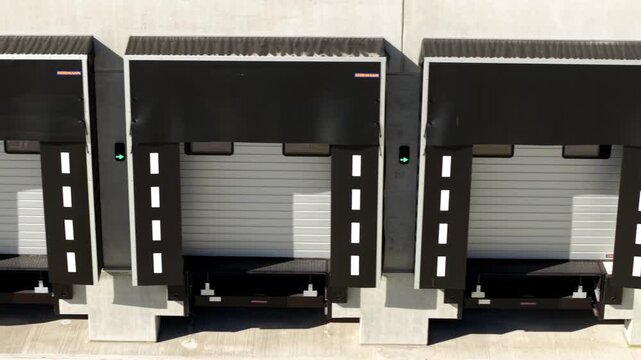
High angle close up aerial view focusing on the industrial loading bay doors and docking stations at a large commercial distribution centre, UK.
00:10
HD
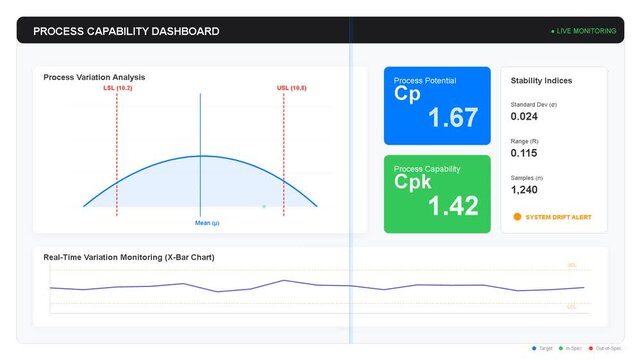
Data dashboard interface displaying statistical process control, bell curve, Cp and Cpk performance metrics, manufacturing analytics, quality monitoring
00:09
HD
Abstract scientific data visualization with glowing graph curve on digital screen.
00:10
HD
Abstract animated normal distribution curve forming samples drawn as violet and blue lines and shapes on a deep dark background. Seamless looping 4K motion graphics video with free space for text, ide
00:07
HD
Normal Distribution Curve Visualization with Animated Data Points
00:05
HD
Blue circuit paths converge platform, glowing cubic components board. digital network backdrop for electronic engineering, connected systems, hardware infrastructure, data communication innovation.
00:20
HD
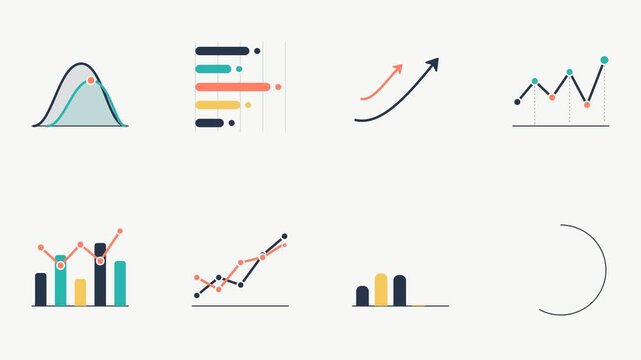
Flat design animated business infographic elements featuring bar graphs, line charts, growth arrows, bell curve, and pie chart on a light background
00:09
HD
Abstract blue circles arranged on a dark background in a looping motion render
00:15
HD
Animated Bell Curve Histogram Statistics Motion Graphic
00:11
HD
95% efficiency glowing hexagon infographic animation 4k neon
00:10
HD
 95% OFF Neon Text Seamless Loop 4K with Black Background Animated Promotional Typography for Video Editing
00:20
HD
Handwritten Math Formulas and Graphs Being Written on Grid Paper Notebook, Camera Sliding Over Physics and Statistics Notes
00:25
HD
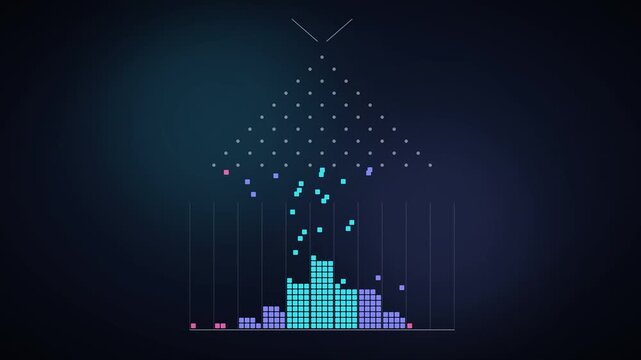
Galton Board Animation Forming Normal Distribution Bell Curve with Cyan and Purple Data Blocks, Statistics and Probability Infographic for Education Videos. Seamless Loop
00:14
HD
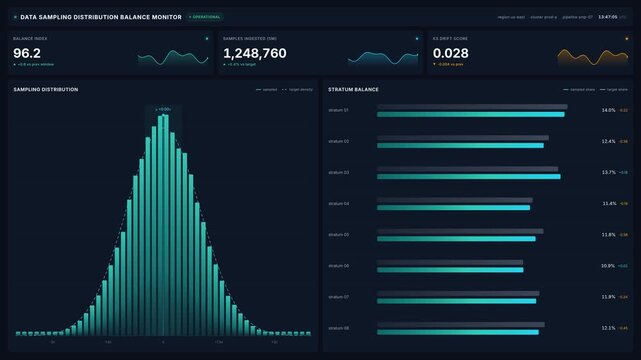
Data sampling distribution balance monitor with histogram bell curve stratum bars, for statistics, quality control, 4k machine learning performance data
00:20
HD
Television interference noise. Analog TV
00:14
HD
Symmetrical histogram bar chart graph bar animation
00:07
HD
3D financial bar chart with bell curve trend line: dynamic business growth and market data analysis
00:10
HD
Delivery trucks parked in a large parking lot at sunset
00:10
HD
Self drawing animation of Gauss probability law, normal distribution diagram curve. Copy space. White background.
00:25
HD
Aerial view of neatly stacked shipping containers showcasing a vibrant tapestry of colors and patterns in an industrial landscape, Setubal, Portugal.
00:18
HD
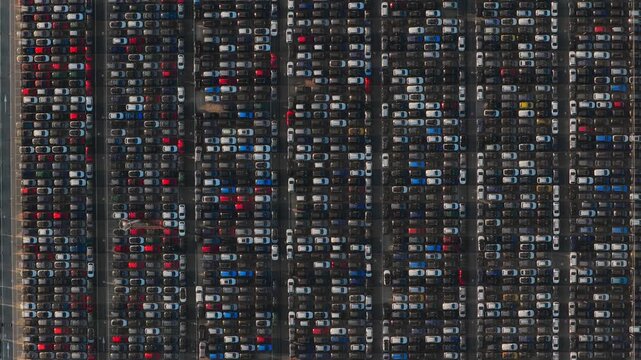
Thousands of new cars parked in perfect rows at a factory parking lot, an endless automotive background representing mass production, car dealership inventory, and the automotive industry
00:13
HD
Digital process capability dashboard with statistical bell curve, data metrics, quality control charts, industrial monitoring, analytics interface
00:09
HD
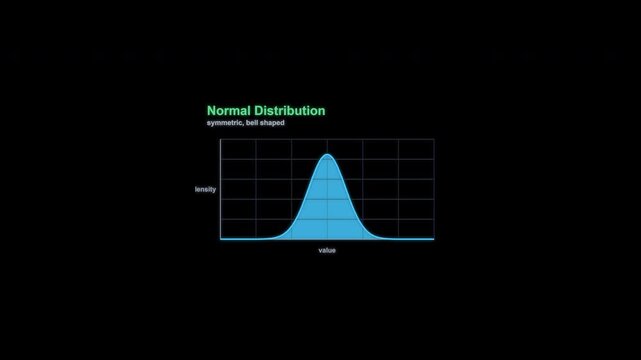
Glowing Blue Neon Line Forming Bell Curve Graph on Grid
00:07
HD