Link do ustawienia hasła został wysłany na adres W przyszłości dostęp do zakupów będzie można uzyskać po podaniu hasła.
W ramach bezpłatnego okresu próbnego uzyskasz 3 wideo lub 25 obrazów
Dodano nowe filtry
Sortuj wg

7 280 wyników wyszukiwania „negative chart” w kategorii: wideo

Declining graph with downward arrow against backdrop of towering high-rise buildings in modern city. Represents financial downturn, falling property value and reduced real estate investment returns.
00:12
HD
Neon-style bar chart showing descending bars with downward arrow animation
00:10
HD
Downward trend graph animation video on a white background
00:06
HD
Candlesticks indicating market crash on digital graph, suitable for finance or investment related design projects and presentations.
00:10
HD
Financial Market Downtrend Graph with Percentage Loss Indicators and Falling Data Visualization
00:09
HD
Glowing red neon downward graph with arrow indicating decline, loss, and negative trends on a dark, abstract background, perfect for conveying risk, crisis animation.Right-directional arrow loop.4k
00:10
HD
A glowing red line graph showing a downward trend on a dark grid background
00:07
HD
Decline graph blue arrow on dark grid. Downward trending decline graph for data. Statistical decline graph for financial loss and negative business trend visualizations art.
00:10
HD
Stock market trading graph in red as 3D illustration background showing economy trading trends, financial crisis, economic development and investment decline concept
00:20
HD
Diverging bar chart compares positive and negative signals
00:10
HD
Declining bar chart animation showing falling financial data and negative stock market trends concept
00:10
HD
Red Downward Arrows Falling Background Animation, Stock Market Crash, Economic Crisis, Financial Loss
00:15
HD
Declining bar chart with downward trend, Blue bar chart with falling line graph decline in business data, finance performance and analytics animation
00:07
HD
Stressed businessman silhouette facing financial market crash with red downward trend charts in this cinematic motion background video clip
00:05
HD
Glowing white neon downward graph with arrow indicating decline, negative trends on a dark, black background, perfect for conveying risk, crisis animation. Dawon-directional arrow loop.
00:12
HD
Animated declining line graph arrow showing financial loss or market downturn chart decline
00:10
HD
4K motion graphic animation of a glowing neon red bearish line chart plummeting with market crash volatility, dynamic negative percentage HUD badge counter, on black background for screen overlay.
00:10
HD
Black color arrow rising transparent channel. Abstract arrow growth chart of economy icon black color animated down to up arrow animation, on a white background, direction animation,with video
00:05
HD
Stock Market Chart, Beautiful 3d Animation of Japanese Candlestick Graph in Time Lapse. Seamless Looping Ultra HD 4K 3840x2160
00:30
HD
Glowing green neon downward graph with arrow indicating decline, loss, and negative trends on a dark, abstract background, perfect for conveying risk, crisis animation,4k video
00:10
HD
Economic caution visualized with fluctuating market graph, alert symbols, and negative data trends. Represents financial risk, market volatility, and economic uncertainty. Muxer
00:22
HD
Financial Loss Graph Animation Showing A Dramatic Stock Market Crash With Falling Red Chart Line, Negative Dollar Values, Downward Arrows. Concept Of Economic Recession, Volatility, Investment Failure
00:19
HD
Neon Red Falling Line Graph with Downward Arrows and Declining Trend Animation
00:10
HD
Glowing graph with arrow indicating decline, Arrow business graph icon animation background. Business growth arrow and graph chart animation.
00:05
HD
Seamless loop of seven 3D colorful arrows emerging from the front left edge, sliding deep into perspective, and folding upwards. Positioned on the left to provide clean white negative space
00:06
HD
Down arrow business graph chart animation. Loss business graph icon animation.  on black background. 4k video
00:10
HD
Stock market crash chart showing global recession.
00:07
HD
Animated stock market chart arrow falling down on a white background
00:10
HD
Business recession, market loss, investment downturn, and economic crisis data visualization, decrease in stats and economy concept showing financial decline
00:16
HD
financial statistics chart bars arrow down, decreasing graph, drop market, white arrow falling down, downward trend arrow, business analysis and market decline concepts animation, 4k video
00:10
HD
Red declining line chart with downward arrow on black background, representing loss, market decline, and negative business trend motion graphic.
00:10
HD
Financial bar chart showing economic decline with downward arrow animation on grid background business
00:10
HD
red line graph financial market crash with negative trend symbols. Suitable for financial articles, presentations, and reports.
00:07
HD
Businessman suffering financial crisis with red stock market crash graph in background motion video for professional corporate investment projects
00:05
HD
Bar chart animation displays declining columns with a falling trend arrow. Downturn loss data routes across bar chart. Evaluation consoles monitor active chart.
00:06
HD
Declining bar chart with downward trend, Blue bar chart with falling line graph decline in business data, finance performance and analytics animation
00:07
HD
Declining bar chart motion graphic showing negative financial trend
00:07
HD
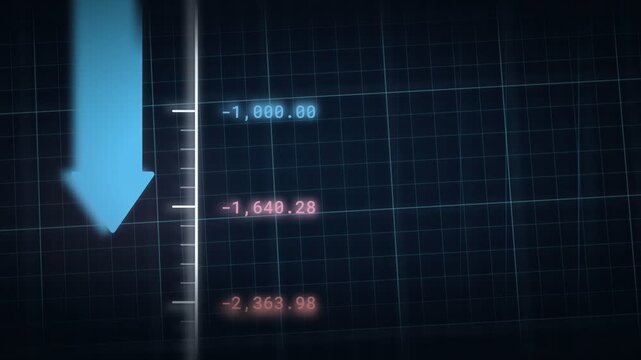
Falling red arrow beside a scale of negative numbers on a dark grid, shifting from blue to red as losses grow, market crash and recession animation
00:10
HD
Revenue decline line graph showing negative business growth and financial loss
00:06
HD
Blue neon line graph descending sharply with a bright light at the end on black chart down
00:07
HD
Financial market crash on an AI advisory console as growth flips negative and risk index climbs
00:20
HD
Economic caution visualized with fluctuating market graph, alert symbols, and negative data trends. Represents financial risk, market volatility, and economic uncertainty. Elide
00:14
HD
Glowing white neon downward graph with arrow indicating decline, negative trends on a dark, black background, perfect for conveying risk, crisis animation. up-directional arrow loop.
00:12
HD
Glowing graph with arrow indicating decline, Arrow business graph icon animation background. Business growth arrow and graph chart animation.
00:05
HD
Bar chart animation displays financial market decline with negative data. Corporate business losses track on this active bar chart. Economic downturn marks the chart.
00:08
HD
Gradient blue bar chart shows a downward trend. Rendered in a cool, minimalist style
00:10
HD
Global stock market decline with a red downward zigzag line, world map silhouette and negative numerical count on a dark financial grid, representing falling markets and economic losses
00:09
HD
Worried coworkers react with shock to falling performance metrics in report files during a rooftop lounge meeting, while businesspeople analyze negative KPI charts in the terrace workspace.
00:15
HD
Depressed stock market loss and bankruptcy financial crisis recession, economic downturn, negative trading performance, investment risk crash, and business debt pressure concept
00:15
HD
glowing  downward chart financial trend with  arrow pointing down on a dark black background representing economic loss and market decline.4k video
00:10
HD
Neon sign Financial business Loss down graph chart icon animated. Graph shows downward arrow, symbolizing decline, loss, market drop, risk, or negative growth.4k animation motion graphics video.
00:10
HD
Chinese paper money, yuans in various denominations. China money as a business background for your design
00:13
HD
Glowing red neon downward graph with arrow indicating decline, loss, and negative trends on a dark, abstract background.Motion graphics of concept
00:10
HD
Corporate loss statistic chart animation down arrow hud digital ui
00:06
HD
Downward Arrow with Red Neon Glow on Dark Black Background Featuring Zigzag Declining Trend Line in Minimal Financial Chart Style
00:10
HD
Neon white financial downtrend graph line animation on black background, stock market crash concept, economic recession indicator, business data visualization, minimalist glowing chart
00:10
HD
Neon glowing zigzag line with upward arrow on black background, global business shape line animation,Global real estate growth neon line graph with heart
00:08
HD
Declining bar chart with downward trend, Blue bar chart with falling line graph decline in business data, finance performance and analytics animation
00:08
HD
Neon green arrow pointing down on black grid background, concept of stock market crash and economic decline.
00:05
HD
Stroke and Fill Breathing Seamless Loop of Dark blue zigzag line graph trending downwards representing decline or negative trend with Transparent Alpha Channel for Motion Graphic
00:10
HD
Financial market downtrend graph animation: declining economic chart arrow showing loss, recession, and negative business performance
00:10
HD
Economic caution visualized with fluctuating market graph, alert symbols, and negative data trends. Represents financial risk, market volatility, and economic uncertainty. Muxer
00:12
HD
Abstract downward chart with a falling line and arrow decline loss or a negative business trend animation
00:07
HD
Glowing graph with arrow indicating decline, Arrow business graph icon animation background. Business growth arrow and graph chart animation.
00:05
HD
Blue digital stock market crash downward graph.
00:08
HD
Bear Market Financial Chart with Falling Trend Lines, Red Loss Percentages and Economic Downturn Data Background
00:12
HD
Close-up analysis of declining financial percentages on a digital spreadsheet screen with stylus pen highlighting negative market performance and fluctuating economic data
00:22
HD
Red stock market index chart showing severe financial crash and declining prices
00:12
HD
Crisis financial business market graph table, and economic crash recession display, arrow is pointing downwards as the line chart falls, economic recession, and global investment collapse
00:12
HD
Red neon financial downtrend graph animation with falling arrow
00:11
HD
Downward arrow animation displays negative currency values on dark. Financial investment loss telemetry tracks across downward arrow. Economic downturn marks arrow.
00:09
HD
Chinese paper money, yuans in various denominations. China money as a business background for your design
00:18
HD
Glowing green neon downward graph with arrow indicating decline, loss, and negative trends on a dark, abstract background, perfect for conveying risk, crisis animation.Right up arrow icon 4k video.
00:10
HD
Red financial chart graph showing market crash economic downturn risk and business loss concept
00:10
HD
Hand displaying red downward financial chart illustrating economic decline loss risk and negative market trend
00:05
HD
Animated graphic with red x over blue bar charts on green background symbolizing data rejection or negative trends
00:05
HD
Neon blue bar chart showing a downward trend with a diagonal arrow pointing down, symbolizing financial loss, decrease in stock, or negative business growth.
00:10
HD
Digital bar chart animation showing declining business performance and negative financial growth trend
00:10
HD
A red stock market graph with a downward trend displayed on a futuristic grid background with blue lines and dots, conveying a sense of financial decline or crisis.
00:08
HD
Financial bar chart declining with downward arrow animation on black background, decline business economy
00:07
HD
Financial market downtrend graph: white arrow showing economic decline on digital grid background crash
00:10
HD
A robotic hand interacts with digital graphs and charts, representing financial trends and analysis, highlighting the intersection of technology and finance in modern data interpretation. Salient
00:14
HD
downward trending red line graph showing stock market crash, financial crisis, data analysis, economic recession, dark background with glowing particles
00:06
HD
Glowing graph with arrow indicating decline, Arrow business graph icon animation background. Business growth arrow and graph chart animation.
00:05
HD
Declining bar chart visualizes negative corporate revenue metrics. Technical bar chart displays falling stock market investment values. Financial crisis concept with digital bar chart.
00:11
HD
Modern colorful glowing line graph showing a downward and upward trend on a black background. Minimal financial chart concept representing market decline, loss, crisis, or negative growth.
00:06
HD
Abstract downward chart with a falling line and arrow decline loss or a negative business trend animation
00:07
HD
Falling red arrow beside a scale of negative numbers on a dark grid, shifting from blue to red as losses grow, market crash and recession animation
00:03
HD
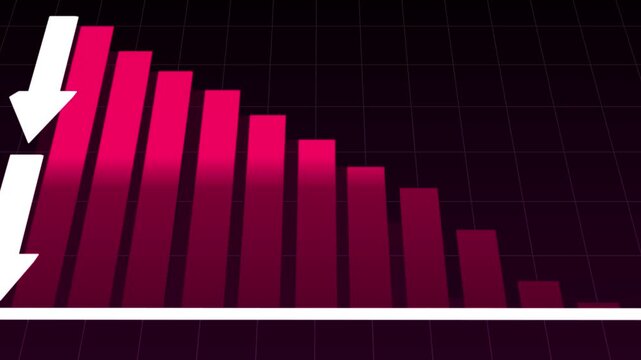
Animated red bar chart with white downward arrows on a dark grid background, illustrating declining performance, falling sales, market downturn, financial losses, and negative business statistics.
00:10
HD
Minimalist bar chart animation showing a declining financial market trend
00:10
HD
blue up business arrow graph and red down business loss financial decline economic fall recession black background animation.
00:12
HD
Red line financial market downtrend graph animation economic loss and stock market crash concept chart
00:10
HD
Animated Declining Bar Chart with Three Vertical Bars on Transparent Background
00:15
HD
Red financial chart showing market crash, stock drop, and economic crisis with downward arrow trends
00:10
HD
Stock Market Downtrend Analysis Financial Chart Display
00:15
HD
Businesswoman feeling distressed while viewing the latest stock market results on a computer screen, receiving bad news from her partner and grappling with emotions of anxiety and disappointment
00:10
HD
4K animated zigzag downward arrow with white background and green screen. Perfect for business risk presentations, market drops, infographic, motion graphics, or overlays.
00:19
HD
Glowing red neon downward graph with arrow indicating decline, negative trends on a dark, black background, perfect for conveying risk, crisis animation. up-directional arrow loop.
00:12
HD
Clean corporate infographic animation comparing profit and loss with green and red 3D bar charts growing from a central axis on white background, seamless loop
00:16
HD
Red downward arrow symbolizing economic decline, ideal for financial reports, presentations, articles, and social media posts on negative trends.
00:08
HD