Link do ustawienia hasła został wysłany na adres W przyszłości dostęp do zakupów będzie można uzyskać po podaniu hasła.
W ramach bezpłatnego okresu próbnego uzyskasz 3 wideo lub 25 obrazów

Dodano nowe filtry
Sortuj wg

4 508 wyników wyszukiwania „interface statistic vector” w kategorii: wideo

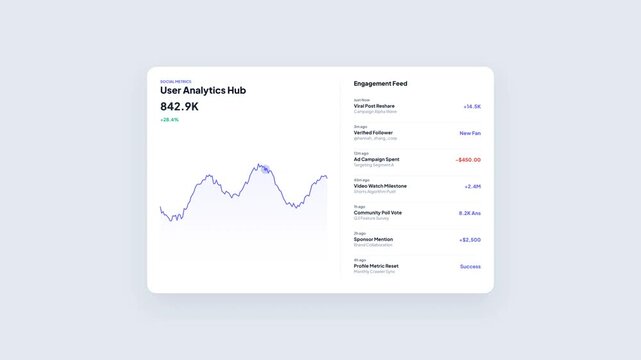
User Analytics Hub Marketing Social Performance Dashboard with Moving Line Graph Trend and Engagement Feed Activity Stream Notification Animation
00:08
HD
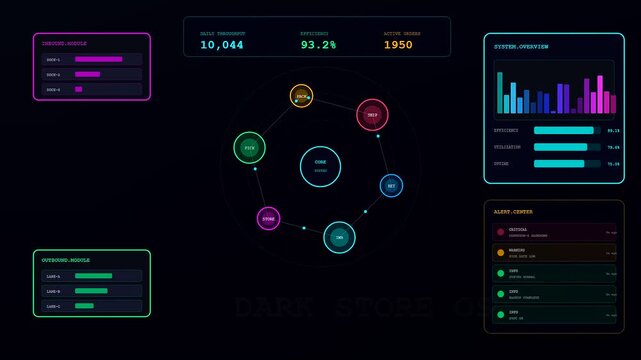
This futuristic digital user interface demonstrates Dark Store Automation with colorful interactive data charts performance statistics and system nodes on a dark background
00:06
HD
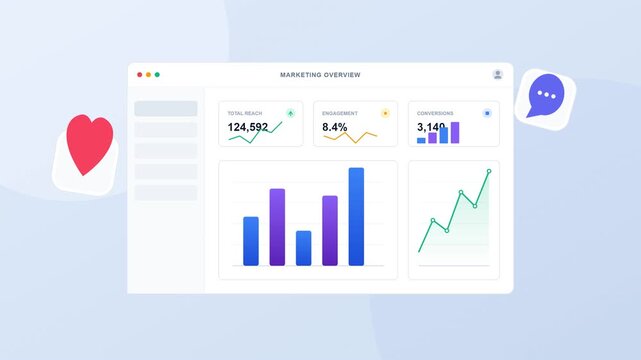
Marketing Overview Dashboard and Social Media Icon Set
00:15
HD
Animated counter display shows rising new customer statistics with minimalist digital motion graphics on a clean dark interface video clip
00:05
HD
Modern Tech Interface Featuring Vibrant Neon Bar Graphs and Fluctuating Curve Lines for High-Tech Data Visualization and Real-Time Business Performance Monitoring.
00:06
HD
Modern flat vector animation showing a laptop with a sales analytics interface and floating ecommerce icons, representing business data, online retail, sales performance, marketing, and digital commer
00:10
HD
Website app UI infographic dashboard animation, abstract light mode user interface elements analytics loop, modern desktop application data presentation stock clip video
00:15
HD
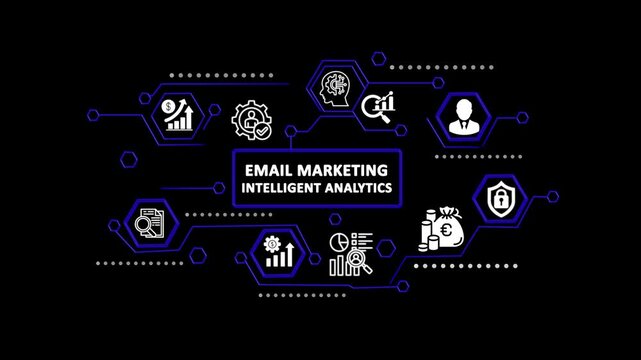
Email Marketing Intelligent Analytics Dashboard with Cyber Security, Business Data Protection and Technology Network Interface 4K Motion Graphics
00:10
HD
Flat design tablet dashboard with animated charts and metrics
00:05
HD
Epidemiology monitoring dashboard mapping infectious disease outbreaks and public health transmission data.
00:14
HD
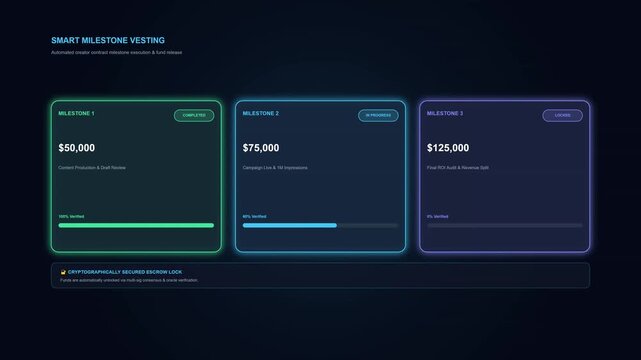
Modern dark mode dashboard interface displaying financial milestones vesting progress charts with green blue and purple card indicators graphic vector
00:10
HD
Email icon animation isolated on alpha channel background
00:06
HD
Modern UI vector animation displaying dashboard analytics interface with interactive charts and search magnifying glass graphic
00:11
HD
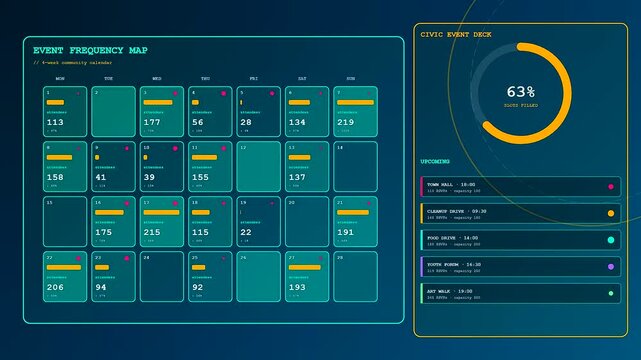
This futuristic interface displays a Realtime Trend Visualization of event frequency and city statistics through shifting data points and updating charts across a digital display.
00:06
HD
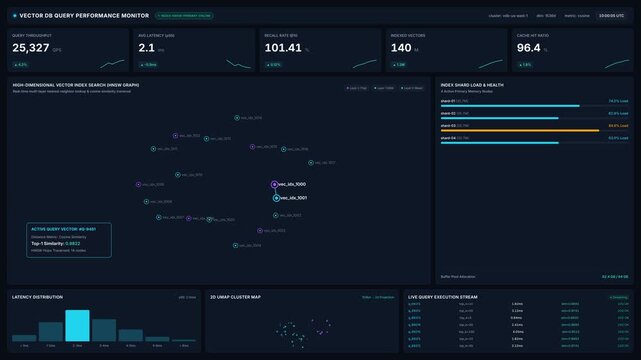
Vector database query performance monitor dashboard for throughput metrics, latency graphs, vector similarity search results, for big data analysis, cloud computing, system optimization
00:20
HD
Futuristic glowing hud interface loading bar with financial charts and icons motion.
00:10
HD
Flat vector statistics dashboard UI faithfully matching the reference on solid chroma green background: white rounded panel with soft shadow; dark charcoal sidebar pill with hamburger, triangle, green
00:12
HD
Financial Growth Analytics Dashboard - Modern Business Infographic Data Visualization
00:10
HD
Flat design icons representing data search, software debugging, and business reporting.
00:10
HD
Animation of blue squares with white markers over grid background
00:10
HD
Data analytics dashboard motion graphics video showing financial charts and growth statistics within interface design
00:08
HD
A digital smart grid management display showing electrical transmission lines across a dark landscape with numerical data floating over utility poles in a continuous scrolling motion
00:06
HD
Modern digital interface with global connection icons and data symbols
00:10
HD
Abstract Financial Stock Market Charts Displaying Multiple Rising Trends Over Dark Background
00:20
HD
Modern abstract bar chart interface on dark blue background
00:12
HD
Modern flat vector animation featuring a laptop dashboard with social media, engagement, and analytics icons. Ideal for digital marketing, audience growth, performance tracking, and business insights
00:10
HD
Dark Theme Marketing Automation Dashboard with Analytics Charts and Data Visualization.
00:08
HD
Ai malware classification pipeline dashboard for real-time statistics decision tree metrics, for cybersecurity monitoring, automated threat detection, software intelligence
00:20
HD
Advanced AI neural render processing hud progress loading panel animation seamless background overlay a high-tech digital interface showing artificial intelligence rendering progress, tensor
00:15
HD
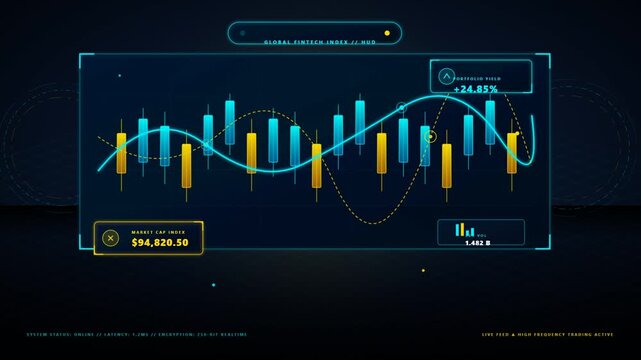
Futuristic financial stock market graph trading data interface hud screen
00:15
HD
Dynamic business dashboard UI interface design vector illustration showing financial analytics charts and modern motion render graphics
00:10
HD
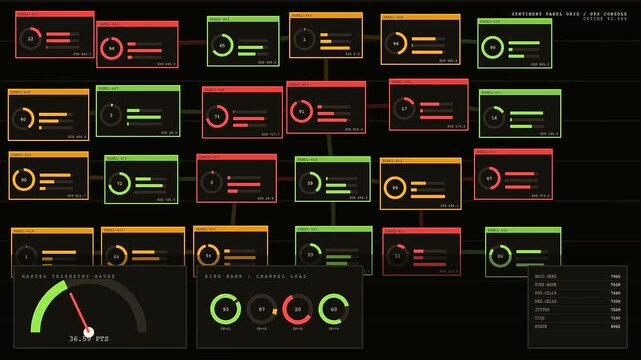
a sentiment analysis dashboard displays complex digital telemetry metrics across a dark grid interface featuring glowing gauges with circular status indicators for monitoring system load and flow
00:06
HD
Animated infographics displaying dynamic financial analytics charts and statistics in vector motion footage loop
00:11
HD
Futuristic data analytics infographic background loop, abstract hud interface with digital business icons, motion graphics of statistics concept.
00:15
HD
Digital speedometer animation hud interface dashboard motion graphic loop
00:06
HD
3D business infographic line graph with data animation elements on a white background. Futuristic financial chart HUD interface loop.
00:12
HD
Flat vector statistics dashboard UI faithfully matching the reference on solid chroma green background: light rounded panel with soft shadow; full-height dark charcoal sidebar with hamburger, triangle
00:12
HD
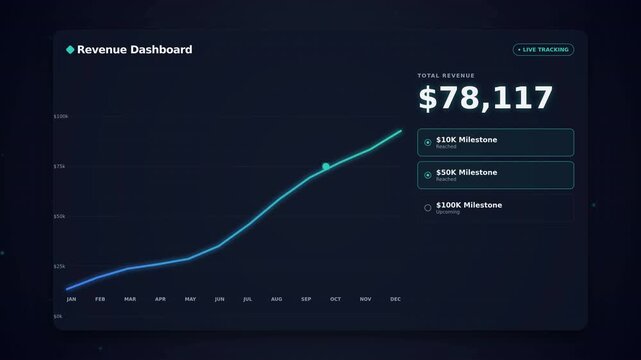
Sleek financial interface with a rising revenue line graph and milestone achievements, representing business growth and income tracker analytics for corporate presentations and SaaS marketing.
00:10
HD
Dynamic pricing interfaces display complex stock data with financial lists and digital graphs appearing in a colorful neon UI design for modern e commerce analytical software
00:06
HD
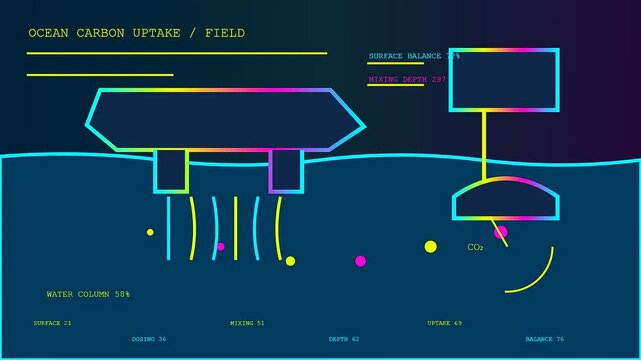
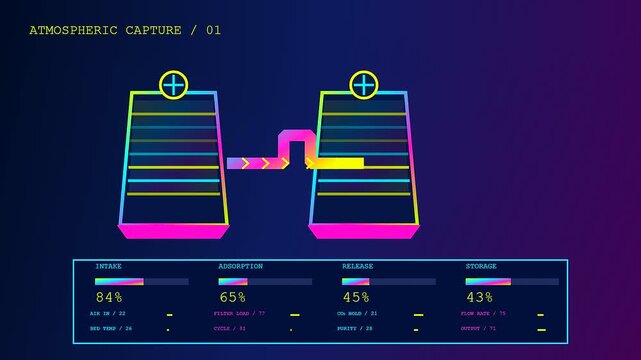
Digital carbon capture interface showing animated ocean surface levels and automated atmospheric dosing metrics displayed across a sequence of fluid graphical data visualization panels in neon colors
00:06
HD
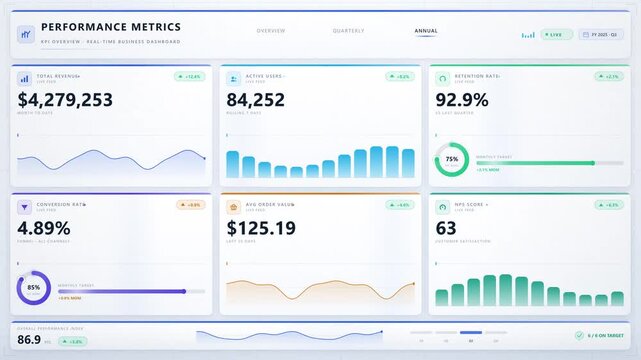
Modern business analytics dashboard interface showing data visualization with abstract charts and progress bars for management software and financial reporting.
00:10
HD
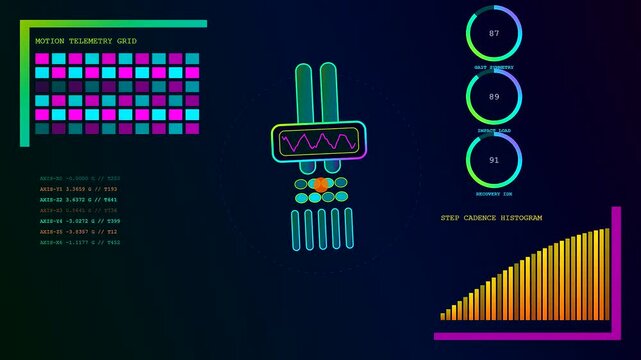
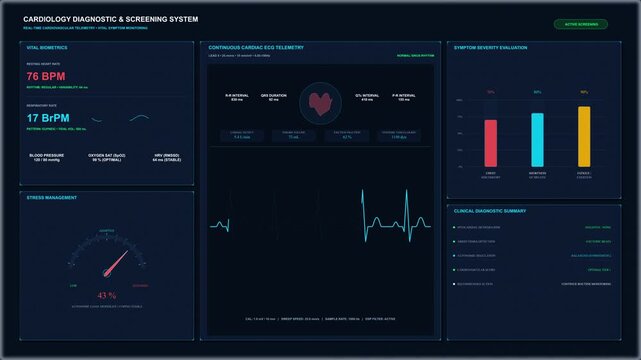
A digital biometric telemetry readout displays complex motion data statistics on a dark interface showing fluctuating waves and neon bars for analytical motion tracking research purposes
00:06
HD
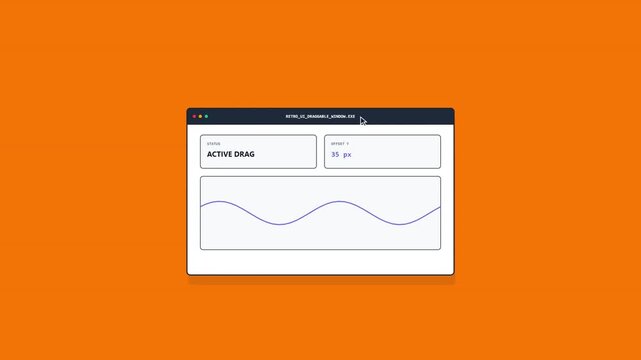
Animated minimalist user interface design illustrating active drag interaction with a blue sine wave graph and pixel offset data display on a vibrant orange background for tech concepts.
00:10
HD
Financial dashboard interface with budget tracking elements
00:15
HD
Digital dashboard displays user achievements with progress chart star icons and locked status labels on clean interface against dark minimalist abstract background
00:06
HD
Modern flat vector animation featuring a business analytics dashboard with social media, audience engagement, and performance tracking icons. Ideal for digital marketing, reporting, growth monitoring,
00:10
HD
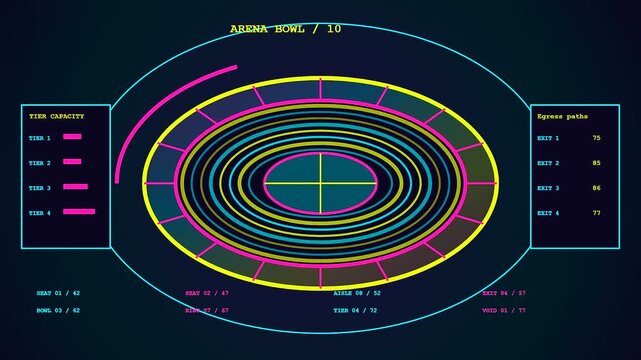
Bim modeling software displays digital stadium arena capacity statistics and egress path data with shifting neon concentric circles in a futuristic diagnostic interface observation monitor screen
00:06
HD
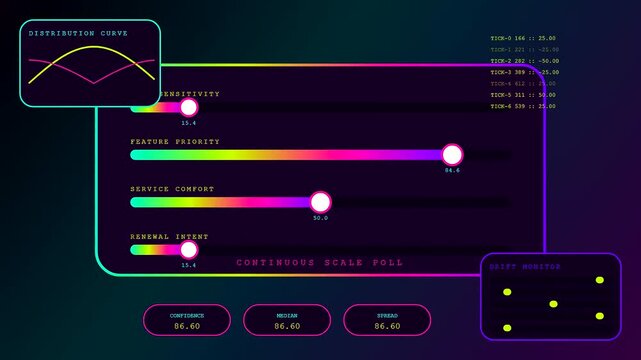
A digital interactive poll interface featuring adjustable sliders and shifting line charts shows data fluctuations for user input metrics on a dark glowing gradient grid surface
00:06
HD
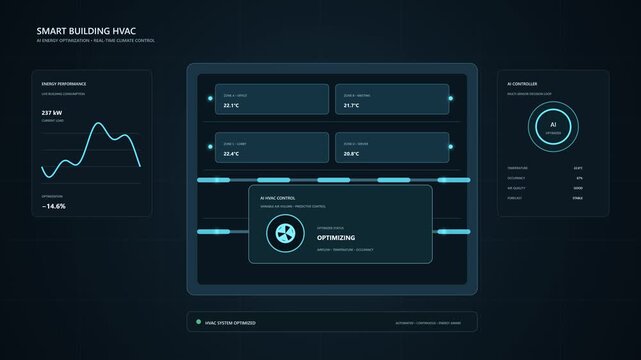
Smart building HVAC energy optimization interface
00:10
HD
Extracting actionable insights from complex datasets using a futuristic big data analytics screen overlay asset
00:18
HD
Set of glowing blue neon data charts and digital info graphs with futuristic interface elements
00:10
HD
Futuristic digital dashboard interface displaying green vector charts
00:10
HD
Dark Mode Financial Analytics Dashboard UI with Colorful Data Charts and Graphs.
00:05
HD
Financial growth dashboard interface with line graph and chart analytics vector illustration concept
00:10
HD
gray and cyan analytics dashboard flat design animation loop
00:05
HD
Global healthcare management system tracking public wellness statistics and hospital support metrics.
00:14
HD
Smartphone interface displays analytical data dashboard with colorful animated graphs and modern user elements in this digital motion graphics video
00:10
HD
Dark mode business dashboard animation, sales funnel data visualization, financial growth bar chart and analytics interface
00:09
HD
Digital dashboard interface showing real-time data analytics with charts, graphs, and indicators, futuristic technology display
00:06
HD
Digital carbon capture interface displays moving data metrics across a blue gradient surface showing industrial flow cycles and volumetric loading levels within a monitoring system interface
00:06
HD
Modern digital dashboard user interface featuring colorful data visualization charts, progress tracking modules, and analytical business metrics in a clean software application layout.
00:10
HD
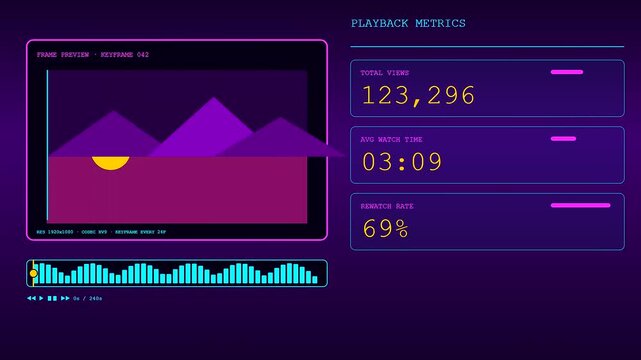
Digital playback analysis displays real time metrics showing abstract mountain diagrams with shifting waveforms and numerical streaming data points within a sleek dark violet interface
00:06
HD
a shimmering plasma turbulence flow drifts across dark space while digital interface data counters track particle movement paths in a cinematic cosmic simulation animation display
00:06
HD
Search engine optimization concept animation showing magnifying glass scanning website text and rising business growth charts in digital motion clip
00:11
HD
Business data dashboard interface with charts and indicators chart graph analysis report statistics chart graph analysis report statistics
00:08
HD
Animated flat design AI analytics dashboard displayed on a laptop with a friendly robot assistant, charts, and performance metrics. Ideal for artificial intelligence, automation, data analysis, and bu
00:10
HD
Dashboard interface with analytics charts and data visualization metrics on a dark background
00:10
HD
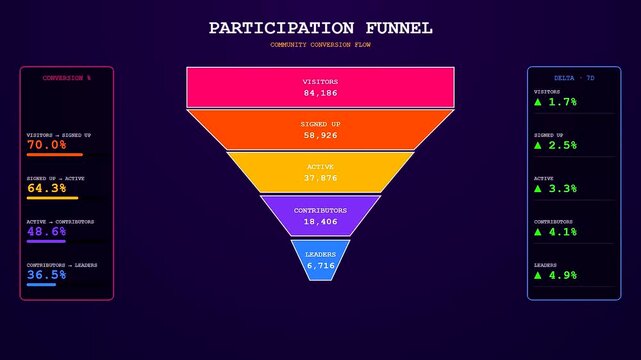
This dynamic motion graphic shows a Realtime Trend Visualization of a community funnel where user metrics and conversion rates shift smoothly over time during digital growth.
00:06
HD
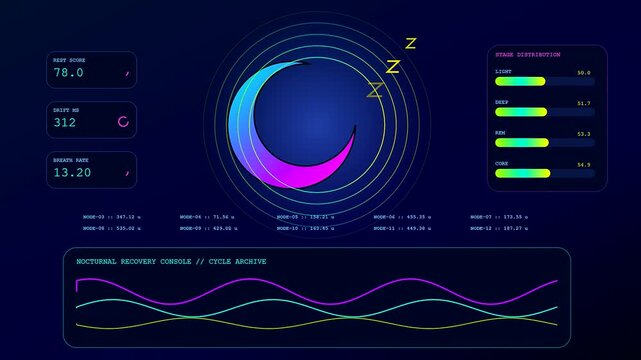
Displaying recovery analytics in a digital interface featuring glowing crescent moon icons with dynamic wave graphs and scrolling numerical values shown in a dark computer simulation
00:06
HD
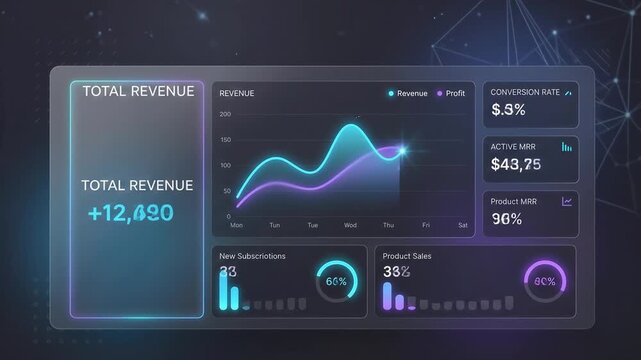
Dashboard displays glowing neon charts and analytics with smooth translucent textures in a modern dark digital interface.
00:07
HD
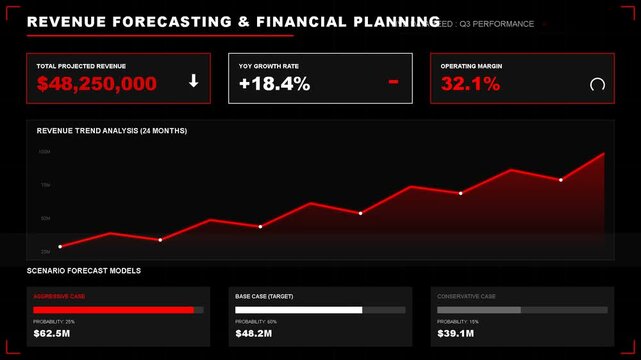
Digital dashboard interface showcasing revenue forecasting and financial planning metrics with line charts, data analytics, business growth trends
00:09
HD
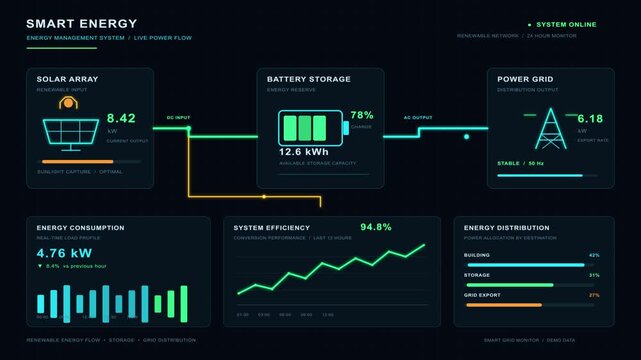
Smart Energy Management Dashboard with Solar Power, Battery Storage, Smart Grid Monitoring, Renewable Energy Analytics, Electricity Consumption Charts and Vector UI Design
00:12
HD
a glowing impression data map interface pulses with vibrant animated statistics across three dark screens reflecting complex information flows and digital monitoring systems in motion
00:06
HD
A sophisticated RAG infrastructure dashboard showcasing embedding pipelines, retrieval stages, and generation latency with vibrant colors and detailed analytics in a seamless loop.
00:15
HD
Dark mode digital interface featuring vector data visualization icons
00:10
HD
hud speedometer gauge dashboard motion graphic interface tech loop
00:06
HD
Modern digital spreadsheet application loading and organizing data efficiently inside sleek user interface video footage clip
00:08
HD
Flat vector dashboard UI like the reference on solid chroma green background: dark charcoal rounded frame with dark left sidebar (violet logo, gray icons, pink active square, camera button), light gra
00:12
HD
Futuristic Dark Green Tech Dashboard UI with Data Visualization Charts.
00:05
HD
digital business analytics dashboard interface with abstract technology icons. corporate intelligence software dashboard with search and security interface.
00:11
HD
Modern minimalist software dashboard interface featuring flat vector data visualization charts, progress bars, and analytics widgets for business management and web application design.
00:10
HD
Playback analysis displayed on a dark interface showing fluctuating metrics and mountain peaks during a digital video rendering process for modern software and visual monitoring
00:06
HD
Innovative carbon sequestration metrics displayed in a flickering digital forest simulation illustrating environmental growth cycles through glowing neon lines on a dark gradient interface screen
00:06
HD
Futuristic digital dashboard interface, abstract HUD tech infographic panels, dark blue UI data visualization elements for corporate presentation
00:08
HD
Premium 2D vector animation of a highly detailed, non-overlapping digital dashboard ecosystem featuring 9 distinct analytics and UI panels materializing on a clean solid green chroma key background fo
00:08
HD
Flat vector animation of a desktop analytics dashboard with charts, check mark, and document icon. Concept of report tracking, approval workflow, and verified business data insights.
00:10
HD
digital financial dashboard showing colorful circular charts with cryptocurrency market price fluctuations displayed against dark tech-themed interface background with grid lines and data nodes
00:06
HD
An interactive poll visual interface displays changing election statistics across three distinct screen captures showing shifting voter rank data and gradient bar chart graphics
00:06
HD
Innovative recovery analytics displayed on a digital interface featuring vibrant neon wave patterns and fluctuating data metrics for biological tissue health assessment in a virtual laboratory
00:06
HD
Split testing software animation demonstrating user interface optimization with comparative data charts and web page variations in motion
00:11
HD
A modern, clean user interface displaying a dashboard with data analytics and navigation.
00:10
HD
Oscillating waveform data interface in multiple browser windows
00:12
HD
A rotating holographic volumetric diagnostics interface shows complex network path data points with shifting light particles across three distinct digital monitors in a dark room environment
00:06
HD
Autumn fog blanket displays geometric forest silhouettes in a vibrant synthwave aesthetic with digital interface line graphs tracking environmental data across changing seasonal landscape visuals
00:06
HD
Dynamic 2d vector user interface dashboard with tactical hud elements and morphing charts
00:10
HD
Heads up display interface infographic Alpha PNG.Technological pattern.Good for tech video overlay.As HUD infographic material texture for 3D models animation.Type 2
00:15
HD
Industrial carbon capture system interface displays data metrics with fluctuating wave patterns in a vibrant multi panel visual setup monitoring chemical extraction flow and compression stages
00:06
HD
Flat vector browser window showing data analytics dashboard with pie chart and mountain graphs
00:10
HD
Anomaly detection interface displaying fluctuating graphical wave patterns on screen as multiple data sets update in real time with synchronized flickering status indicator light modules
00:06
HD
Digital dashboard displaying colorful bar charts and graphs, modern interface for data analysis and visualization
00:06
HD