Link do ustawienia hasła został wysłany na adres W przyszłości dostęp do zakupów będzie można uzyskać po podaniu hasła.
W ramach bezpłatnego okresu próbnego uzyskasz 3 wideo lub 25 obrazów
Dodano nowe filtry
Sortuj wg

13 054 wyniki wyszukiwania „decrease arrow” w kategorii: wideo

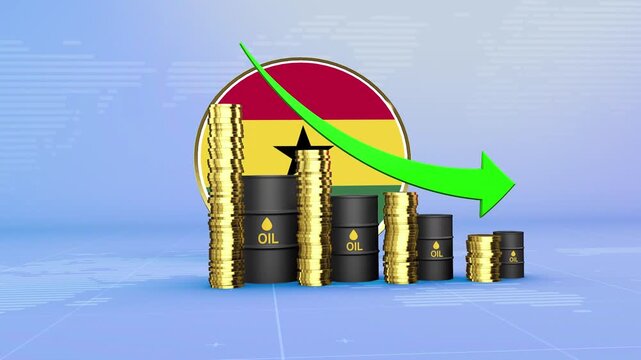
Ghana Oil Prices Decline with Oil Barrels, Gold Coins and Downward Green Arrow, 3D Economic and Financial Market Concept
00:11
HD
Vertical Seamless Loop Red Bar Chart Declining with Falling Arrow on Clean White Background Business Loss Concept
00:15
HD
Red financial bar chart animation showing market crash and economic decline
00:10
HD
Falling Red Stock Market Graph Animation – Financial Loss and Economic Crisis
00:10
HD
Debt burden relief concept depicts extending payment schedules, symbolized by a clock with a chained weight and money bag within a cyclical arrow, reduced financial pressure
00:17
HD
Falling Oil Prices and Market Decline Oil Barrels with Downward Arrows Symbolize Lower Energy Values, Weak Demand, Financial Pressure, and a Bearish Commodity Market
00:10
HD
Golden dollar coin falls to indicate financial market losses. Falling dollar coin visualizes negative corporate revenue trends. Economic inflation concept using a classic dollar coin.
00:12
HD
dollar down icon symbol.Dollar price collapse. Dollar price fall.Money reduction icon. motion graphic of Dollar currency price drop concept. 4k motion video
00:10
HD
Productivity Meter Animation.Measuring Productivity from Low to High Levels.Increasing and Decreasing Gauge from low to high Levels, Comparison Indicator for Data Visualization, perfomance, and Motion
00:10
HD
Tuvalu Oil Price Falling with Oil Barrels Downward Green Arrow and 3D Financial Data Visualization Graphs for Economy and Business Concept
00:11
HD
Oil price volatility concept with falling red arrow, crude oil barrels and smoky background depicting economic uncertainty.
00:08
HD
Pixelated Countdown Minus 0 to -700 Percent. Red Animated Numbers for Loss, Debt, and Failure Concepts
00:07
HD
Business growth concept animation, Business line arrow .Chart arrow still goes Down animation. Graph decreasing. Business animation. Economy concept. arrow down
00:10
HD
Animated black downward trend line graph on green screen, financial market decline and economic recession concept
00:10
HD
Red neon arm muscle strength icon with arrows pointing down on black background
00:08
HD
Minimalist business chart animation with downward trending  arrow and percentages 4k animation showing financial loss over with background dynamic...
00:10
HD
Potassium K indicator scale. Low normal high meter infographic animation on black background. Showing high potassium k level color gauge indicator for nutrition and electrolyte health monitoring.
00:10
HD
Red Falling Bar Chart Decline Arrow Graphic
00:10
HD
Red Downward Arrow Animation for Economic Decline – Vertical Format with Alpha Channel
00:06
HD
market sentiment level indicator scale. Low normal high meter infographic animation on black background. Showing high pressure level color gauge indicator.4k animation video
00:10
HD
Guinea Oil Prices Decline with Oil Barrels, Gold Coins and Downward Green Arrow, 3D Economic and Financial Market Concept
00:11
HD
Green pedestrian countdown timer changes to yellow then red. sequence shows numbers decreasing from 04 to 52 with corresponding signal lights and arrows
00:19
HD
A stark red 3d chart depicting a sharp decline with a downward arrow, symbolizing financial loss animated 4k video
00:05
HD
Glowing Neon Percentage Growth and Decline Icon Animation with Up and Down Arrows on Black Background, Financial Business Statistics, 4K Motion Graphics Loop..
00:10
HD
pressure level indicator scale. Low normal & high meter infographic animation. Showing high pressure level color gauge indicator. on a black background 4k animation video
00:10
HD
Low-yield financial assets tracked on a high-tech monitor illustrating sudden profit contraction and shifting charts
00:15
HD
​Pixelated white downward arrows continuously falling against a vibrant red background
00:12
HD
Animated Red Downward Arrow Stock Market Decline.
00:10
HD
Business chart illustrating improving quality and cost reduction with blue upward and red downward arrows. Visualize performance optimization for business strategy, management and resource efficiency
00:07
HD
Neon Line Percentage Icon Animation Representing Quality Control, Business Growth, and Cost Reduction Strategy with Upward Arrow for Success and Downward Arrow for Expense,
00:12
HD
red line is drawn on a black background, representing a downward trend. Concept of decline or loss, possibly related to a financial or economic situation
00:10
HD
Decline in value of securities. Loss of equity stock assets. Business loss falling down with dollar icon.HD, video, black, background,
00:10
HD
Virgin islands US Flag and Bar Chart Graph Showing Decreasing Values a Red Arrow Economic Crisis Concept
00:11
HD
Financial growth and decline animation with green up arrow red down arrow and spinning gold dollar coin on green background
00:15
HD
Arrears progress past covenant deadlines to a garnishment order, with payroll withholding marking the path toward balance reduction. Flat 3D style.
00:08
HD
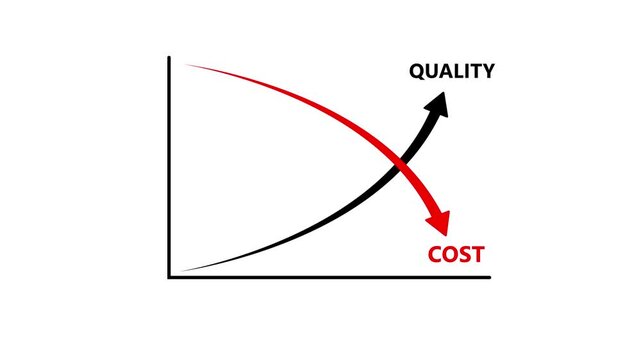
Rising quality bar chart and declining cost curve showing quality control and cost reduction up arrow and cost with down arrow.4k
00:10
HD
Animated progesterone level meter decreasing from normal to low level for concept.3d video white background.
00:10
HD
Global economic crisis concept featuring a globe, money symbol, and red downward arrow representing financial decline and market instability.
00:10
HD
urgency level indicator scale. Low normal & high meter infographic animation. Showing high urgency level color gauge indicator. on a black background 4k animation video
00:10
HD
success rate level indicator scale. Low normal high meter infographic animation on black background. Showing high pressure level color gauge indicator.4k quality animation video
00:10
HD
Australia Oil Prices Decline with Oil Barrels, Gold Coins and Downward Green Arrow, 3D Economic and Financial Market Concept
00:11
HD
Digital Red Neon Downward Arrow HUD Interface with Decreasing Countdown Timer and Data Monitor
00:15
HD
Neon Cost Reduction Dollar Icon Animation, Falling Stock Market Graph and Financial Crisis Concept, 4K
00:10
HD
Continuous single line drawing of a british pound currency symbol with a downward arrow representing financial decline or loss isolated on white background, Full length one line animation. 4K video
00:07
HD
deciber level indicator scale. Low normal & high meter infographic animation. Showing high deciber level color gauge indicator. on a black background 4k animation video
00:10
HD
Drop in revenue on a digital monitor showing successful methods to handle sudden financial loss for corporate annual report projects
00:15
HD
Business growth concept animation, Business line arrow .Chart arrow still goes Down animation. Graph decreasing. Business animation. Economy concept. arrow down
00:10
HD
Glowing neon line Global economic crisis news icon isolated on black background. World finance crisis. 4K Video motion graphic animation.
00:10
HD
3D Business Statistics Bar Chart with Downward Arrow Showing Financial Decline, Falling Revenue, Market Loss and Negative Growth Data Visualization on Green Screen
00:05
HD
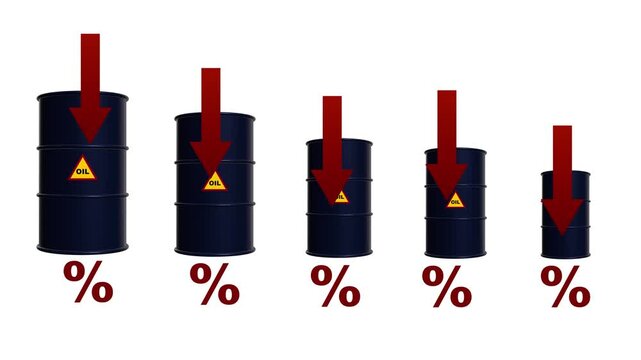
Declining Oil Market Value Illustrated by Progressively Smaller Oil Barrels, Downward Arrows, and Percentage Symbols, Representing Falling Prices, Reduced Rates, Lower Demand, and Economic Decline
00:10
HD
stock market red arrow upward growth graph chart animated continuous single line drawing isolated on green screen background, line art animation illustration design sign symbol video direction loss
00:10
HD
Business decline bar chart animation financial downtrend
00:06
HD
Japan Oil Price Falling with Oil Barrels Downward Green Arrow and 3D Financial Data Visualization Graphs for Economy and Business Concept
00:11
HD
Conceptual image of declining real estate market with housing symbol, percentage mark, and silhouettes of business people in a modern urban environment Sigmoid
00:10
HD
Minimalist Line Drawing Animation of Business Workflow Optimization Task Delegation and Waste Reduction Process Infographic
00:10
HD
Financial analysis displaying an upward trend, indicating potential market recovery and economic expansion, with concepts of decrease, risk, and data management for business success
00:17
HD
Risk level indicator scale. Low normal high stress meter infographic animation on white background. Showing high risk level color gauge indicator for business, finance and safety analysis animation.
00:10
HD
Balance Scale with Upward Green Arrow and Downward Red Arrow Comparison Animation
00:11
HD
stoke level indicator scale. Low normal & high meter infographic animation. Showing high stroke level color gauge indicator. on a black background 4k animation video
00:10
HD
safety level indicator scale.Low normal high meter infographic animation on black background. Showing high pressure level color gauge indicator for health monitoring and safety analysis.4k
00:10
HD
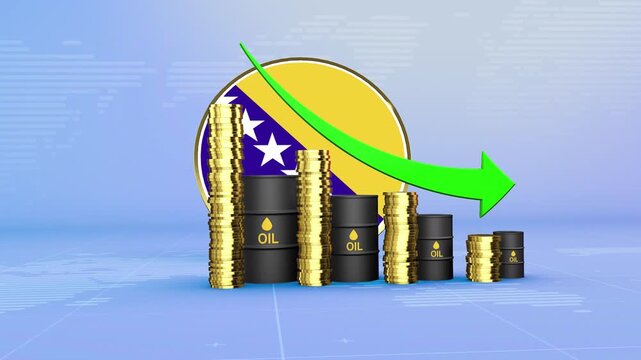
Bosnia and Herzegovina Oil Prices Decline with Oil Barrels, Gold Coins and Downward Green Arrow, 3D Economic and Financial Market Concept
00:11
HD
Balance amount decreasing from 10000 to 0 dollars.Decreasing Amount Animation on blue background.
00:10
HD
Settings optimization icon animation. performance improvement sign. gear with bar chart.
00:10
HD
Declining Business Line Chart Arrow Animation on White Background
00:07
HD
Red Downward Arrow with Dollar Sign Symbolizing Economic Recession or Financial Loss
00:15
HD
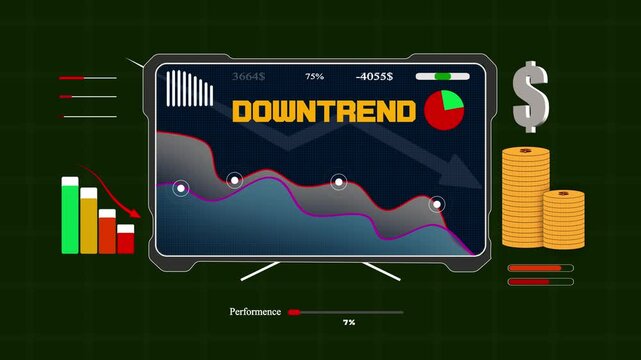
Market downtrend analysis featuring an animated electronic screen with falling business statistics for finance reports
00:15
HD
Cloud of CO2, carbon emission, pollution reduction icon. Ecology environment cleaning. Loop. Green screen, chromakey
00:05
HD
Abstract dollar sign icon and up arrow animation on a green background. Upward arrow and dollar icon. High pricing icon. profit, investment, growth business, economy, finance and success concept
00:10
HD
Professional Business Financial Bar Graph Showing Downward Trend, Economic Loss and Market Decline Animation
00:15
HD
Declining Oil Market and Falling Financial Value Concept with Red Downward Chart, Oil Barrels, Gold Coins, and a Large Arrow Showing Economic Downturn
00:10
HD
Stock market crash concept featuring infographic with falling red arrow. Visual representation of market decline and financial loss.
00:15
HD
Glowing neon line of dollar sign icon. Dollar rate decrease icon animation . Money symbol with stretching arrow down. Rising prices. Business cost sale icon.
00:10
HD
Costa Rica Oil Price Falling with Oil Barrels Downward Green Arrow and 3D Financial Data Visualization Graphs for Economy and Business Concept
00:11
HD
Hand drawn business flipchart showing financial loss. 4K Video
00:10
HD
Down arrow. Glowing neon icon on brick A neon arrow pointing upwards on a dark black background
00:10
HD
Businessman decreasing transaction fees and charges in financial services like banking and foreign exchange, promoting cost efficiency and beneficial economic changes for clients
00:17
HD
COVID-19 risk level indicator scale. Low normal & high meter infographic animation on black background. Showing high COVID-19 level color gauge indicator for public health and disease monitoring.
00:10
HD
2026 New year with percentage change to UP and Down arrow with coin stack. Interest rate, GDP, stocks market, financial, deflation and Inflation, mortgage, debt, Loan and Economic Recession
00:13
HD
satisfaction rating level indicator scale. Low normal & high meter infographic animation. Showing high satisfaction rating level color gauge indicator. on a black background 4k animation video
00:10
HD
Business Down icon isolated , Business Alert icon , Business trending bar down icon animation .
00:10
HD
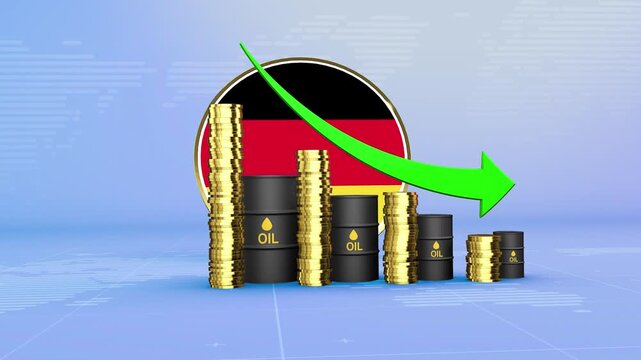
Germany Oil Prices Decline with Oil Barrels, Gold Coins and Downward Green Arrow, 3D Economic and Financial Market Concept
00:11
HD
Red dollar signs on a downward trending graph against a black background chart decline
00:10
HD
Red Neon Dollar Sign with Downward Arrows in Circle
00:10
HD
60 Percent Decline Animation. Animated video 4K
00:06
HD
Ticker display. table grid Stock exchange screen number with financial trade index rates, finance fund stocks price increase and decrease charts arrow up and down
00:20
HD
Downward business trajectory on a digital monitor showing professional financial performance issues for corporate reports and projects
00:15
HD
Research Level Text or Word Low and Medium to High Meter Concept Animation on Black Background and Blue Screen
00:58
HD
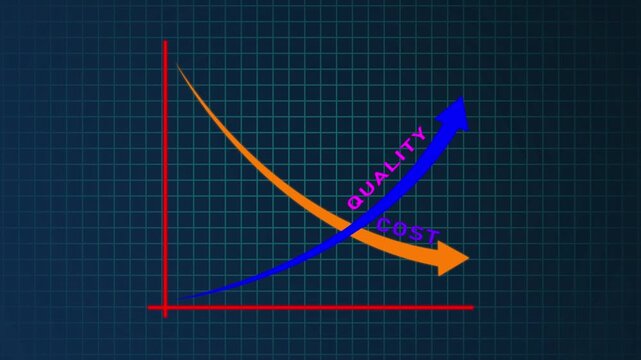
Quality improvement and cost reduction concept with blue quality line rising and red cost line falling. Concept of business strategy, management, efficiency and performance optimization
00:12
HD
Negative business graph report animation on transparent background.
00:06
HD
Money transfer Icon icon in flat style,Dollar coin falling down. Icon of a coin and arrow pointing down, concept of financial crisis
00:10
HD
Stock market crash, red candlestick chart falling arrow, financial decline concept. Business crisis economy downturn, trading loss graph. Stock market crash risk
00:10
HD
Businessmen lead by a businesswoman forming arrow shape pointing up, hd against white
00:30
HD
Syria Oil Price Falling with Oil Barrels Downward Green Arrow and 3D Financial Data Visualization Graphs for Economy and Business Concept
00:11
HD
3D euro coin with down arrow
00:10
HD
Financial business Loss down graph chart animation on green background. Business Info graphic animation, Bar graph. business loss graph show chart
00:06
HD
Financial operations depicting banking service optimization, reducing transaction costs, and improving international money transfers through efficient fee management
00:17
HD
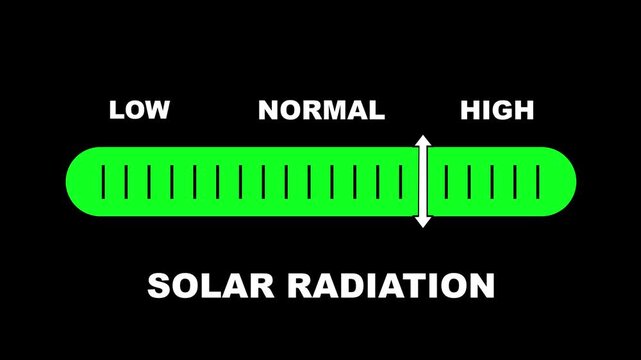
Solar radiation level indicator scale. Low normal & high meter infographic animation on black background. Showing high solar radiation level color gauge indicator for weather and climate monitoring.
00:10
HD
Bitcoin Falling Value with Downward Arrow and Dimmed Coin Financial Decline Illustration
00:05
HD
trigl ycerides level indicator scale. Low normal & high meter infographic animation. Showing high triglycrides level color gauge indicator. on a black background 4k animation video
00:10
HD
Austere business background with a city silhouette and a red graph arrow going down. The tendency to decline, decline, recession and fall in the exchange rate.
00:30
HD