Link do ustawienia hasła został wysłany na adres W przyszłości dostęp do zakupów będzie można uzyskać po podaniu hasła.
W ramach bezpłatnego okresu próbnego uzyskasz 3 wideo lub 25 obrazów


Dodano nowe filtry
Sortuj wg

27 395 wyników wyszukiwania „data analysis vector” w kategorii: wideo

Complex digital biometric validate interface showing moving wavy neon lines and segmented graphs on a dark screen panel for advanced data monitoring and system analysis
00:06
HD
Online Business Presentation and Data Analysis Seminar on Laptop Screen cartoon animation
00:08
HD
Extracting actionable insights from complex datasets using a futuristic big data analytics screen overlay asset
00:18
HD
Enterprise sales dashboard powered by Lead Engine system with secure performance monitoring  4 k video animation
00:10
HD
Digital financial candlestick chart stock market data analysis graphic template
00:15
HD
Protected data ecosystem, encrypted data elements connected within secure architecture, editorial enterprise imagery, confidential data ecosystem
00:05
HD
Digital data analysis on a computer screen with abstract numbers scrolling, representing financial statistics or code
00:10
HD
Business growth arrow animation. Up arrow animation on black background. Arrow rising growth chart of economy icon black color animated.
00:10
HD
Dynamic motion of colorful bar graphs illustrating data analysis and digital visualization.
00:10
HD
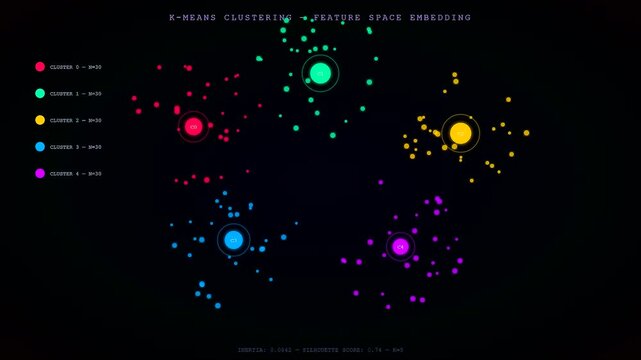
A dynamic neural network diagram visualizes data points clustering around five glowing centroids in a dark virtual space with subtle floating particle motion.
00:06
HD
Flat vector illustration of a modern scanning progress bar with percentage indicator, representing system scanning, data analysis, software processing, loading status, and digital workflow.
00:10
HD
Consumer market research and targeting plan, Target audience data analysis symbol, Business analytics chart graph, Enterprise leadership management team structure.
00:16
HD
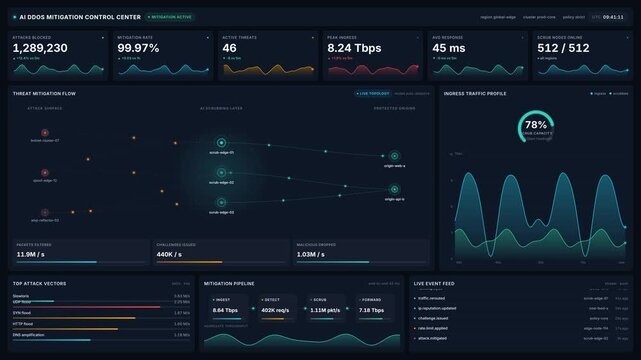
Advanced ai ddos mitigation control center dashboard for live threat neutralization, traffic graphs, attack vectors, for cybersecurity, network monitoring, system protection
00:20
HD
futuristic server room with rows of glowing blue data racks, digital information highway, data center technology, cybersecurity, cloud computing, high tech network infrastructure
00:08
HD
Abstract Financial Stock Market Charts Displaying Multiple Rising Trends Over Dark Background
00:20
HD
accountancy digital business dashboard interface animation. corporate accounting and data analysis technology background. professional financial auditing and compliance interface.
00:11
HD
Futuristic glowing digital circular hud interface element for data analysis
00:10
HD
Animated illustration of a social media analytics dashboard with charts and engagement icons on desktop monitor, suitable for marketing and business concepts.
00:10
HD
Real-time data table, monitoring screen for tracking multiple assets simultaneously
00:13
HD
Flat vector browser window showing data analytics dashboard with pie chart and mountain graphs
00:10
HD
Looping stock market animation with magnifying glass analyzing green financial data line graph
00:10
HD
Laptop displaying search engine results and data analysis steps
00:10
HD
Dark Theme Marketing Automation Dashboard with Analytics Charts and Data Visualization.
00:08
HD
Data Scientist Analyzing AI-powered Knowledge Base On Laptop
00:20
HD
A fluid metric telemetry visualization displays scrolling cyan signal waves and rotating circular percentage progress rings on a dark digital console interface for scientific data analysis
00:06
HD
A biometric validate process showing digital facial mapping analysis on three screens with data charts and graphs displaying nodes and vector lines in dark space
00:06
HD
Abstract digital programming code displayed on a large dark wall screen with a connected glowing data node in a modern tech office
00:10
HD
Modern flat vector animation showing data packets entering an AI processing system, being processed by a central technology core, and transforming into digital output.
00:08
HD
shows glowing neon line banner of BUSINESS ACCELERATION concept with icons of business, responsibility, customers, integrity, goals, teamwork, commitment and innovation .4k video animation
00:10
HD
Website search engine optimization and data analytics concept vector illustration with browser and magnifying glass
00:10
HD
Animated heat matrix infographic in a modern flat vector style, cells cascading in a smooth 4K loop. Blank text placeholders and blue and azure accents sit on a bright light background so headings and
00:07
HD
Flat vector illustration of a creative team collaborating in office, using computers and digital tools for data analysis, chart presentations, visualization, and strategic project planning, 4K video
00:08
HD
Autonomous inference pipeline gas flow dashboard display, for real-time data analysis, machine learning processing, system monitoring, artificial intelligence automation operations
00:20
HD
Financial analysis animation with rocket growth on business success graph.Rocket launching from green graph showing business growth on black background animated stock video.
00:10
HD
Digital dashboard displaying colorful bar charts and graphs, modern interface for data analysis and visualization
00:06
HD
A digital twin interface showing rocket launch trajectories and orbital tracking radar data displayed through glowing neon schematics on a dark void screen for aerospace analysis
00:06
HD
Professional businessman carrying a large stack of books while walking.
00:06
HD
Animated flat design AI analytics dashboard displayed on a laptop with a friendly robot assistant, charts, and performance metrics. Ideal for artificial intelligence, automation, data analysis, and bu
00:10
HD
A minimalist white line art icon representing a financial bar chart with an upward trending line graph superimposed on a solid black background, symbolizing growth and data analysis
00:06
HD
Epidemiology monitoring dashboard mapping infectious disease outbreaks and public health transmission data.
00:14
HD
Futuristic Digital Dashboard UI with Animated Graphs and Data Analysis
00:06
HD
Hand Holding Magnifying Glass Searching Web Page 2d Animation with Alpha Matte
00:20
HD
Loss business graph icon animation 4k isolated on white background
00:06
HD
Downward trend graph animation video on a white background
00:06
HD
Catastrophe mapping display shows multiple spinning storm vortex simulations with numerical pressure data and rotating circular graphs isolated on a dark digital interface during scientific analysis
00:06
HD
A digital vulnerability scan interface shows glowing binary data streams moving inside circular magnifiers with neon grid maps and oscillating bar charts for system diagnostic monitoring
00:06
HD
Comprehensive Data Analysis and Business Intelligence Network System with Artificial Intelligence Digital Transformation Technology Management Infographic Motion Graphic Concept 4K video
00:10
HD
Professional Financial Graph Data Analysis Vector Motion
00:29
HD
Flat vector illustration of mobile development and data analytics
00:10
HD
Digital Education and Research Concept with Smartphone, Open Book, Colorful Books and Magnifying Glass
00:07
HD
Animated capability radar infographic in a modern flat vector style, profile expanding in a smooth 4K loop. Blank text placeholders and blue and azure accents sit on a bright light background so headi
00:07
HD
“AI” text with flowing data streams on dark black background, representing agentic AI, business automation workflows, digital transformation innovation concept, 4K video
00:08
HD
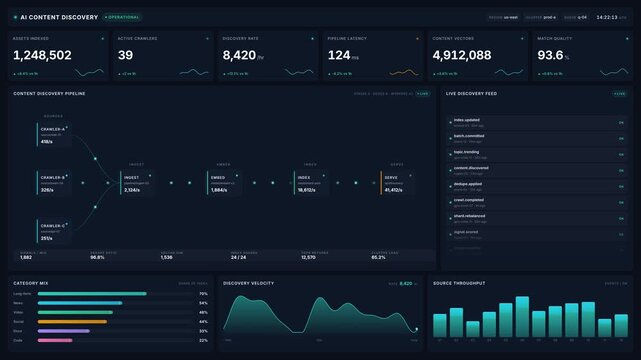
Ai content discovery dashboard with live crawler pipeline vector indexing metrics, for real-time search monitoring, data processing, automation in 4k technology
00:20
HD
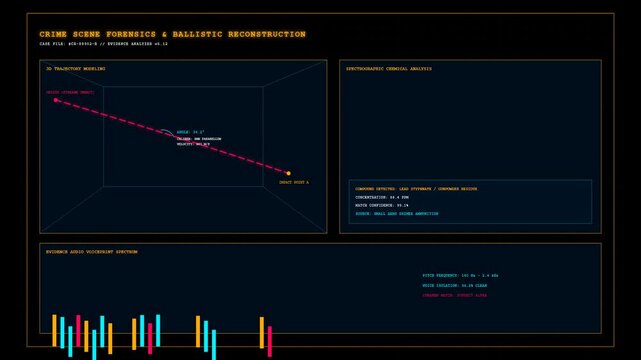
Digital Forensics Interface Showing Ballistic Trajectory Reconstruction and Analytical Data Analysis
00:10
HD
Minimalist financial candlestick chart pattern isolated on a black background
00:10
HD
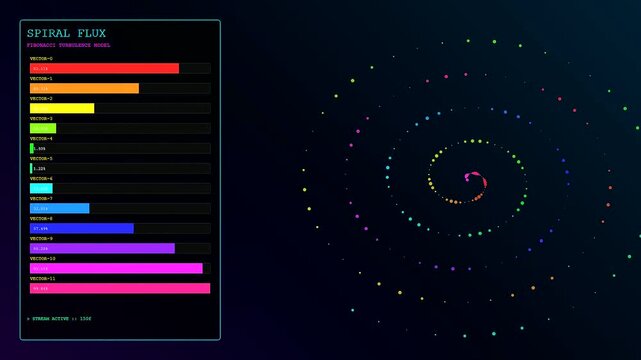
Display of plasma turbulence evolving through shifting holographic vectors on a dark interface panel featuring spinning dotted light patterns that pulse with colorful glowing circular data
00:06
HD
A laptop screen displaying a spreadsheet with neatly organized rows and columns of data. The table contains numbers and text arranged in cells, suggesting financial calculations or data analysis in
00:09
HD
Flat vector animation of a desktop analytics dashboard with charts and graphs. Concept of business performance tracking, data analysis, and digital reporting interface.
00:10
HD
Statistic graph icon set in thin line style. Business data analysis, finance growth, and market trend motion grapic animation
00:10
HD
Flat design icons representing data search, software debugging, and business reporting.
00:10
HD
A digital reach projection interface shows a spinning dark globe with glowing connection lines and moving circular data charts on a deep blue screen display
00:06
HD
Futuristic circular progress visualization with glowing neon segments, digital energy signals, and a dark technological interface.
00:06
HD
animated motion graphic displaying financial data analysis on dark digital dashboard with colorful bar chart and statistics
00:07
HD
Digital stock market candlestick chart with glowing neon lines showing financial data analysis on a overlay background for business and investment
00:07
HD
Business Dashboard UI Interface with Data Analytics Graphs and Charts UI Design
00:05
HD
Digital claim processing system showing active data streams with colorful progress bars and status indicators displayed on a dark virtual interface for financial monitoring operations
00:06
HD
Quantum computing qubit state vector and Bloch sphere interface animation loop
00:15
HD
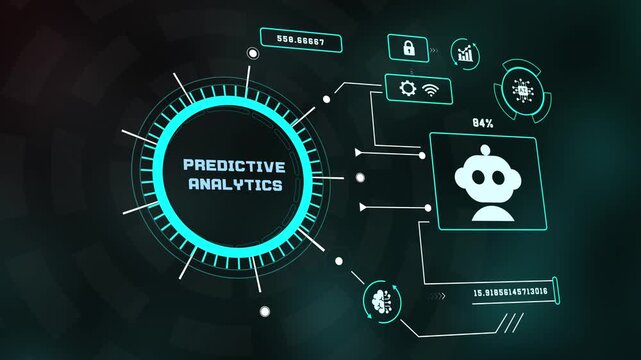
Futuristic HUD digital dashboard showing predictive analytics text with artificial intelligence robot icon, data growth chart, security lock, and glowing background.
00:10
HD
Data analysis and business growth animation with charts
00:10
HD
Business leadership and data analysis icon pattern for corporate management
00:10
HD
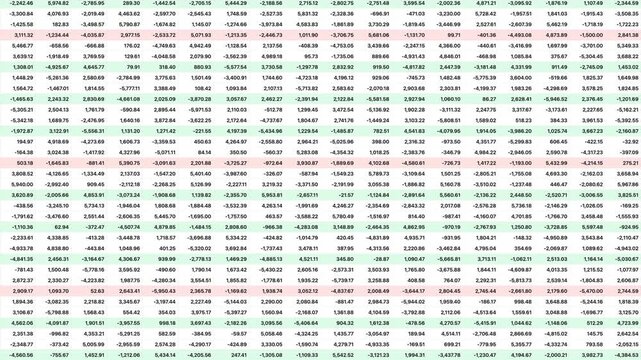
Financial Data Heatmap With Profit And Loss Values In Spreadsheet Grid
00:20
HD
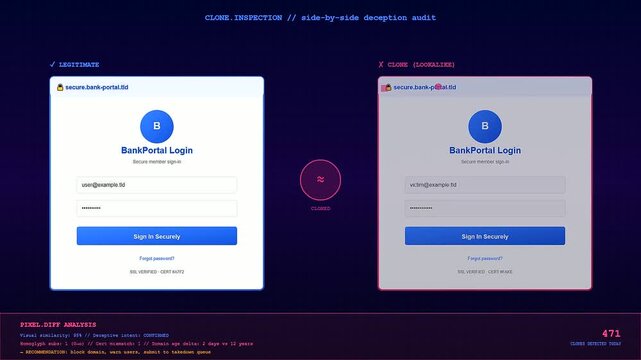
A digital phishing vector simulation shows website cloning comparisons on a dark screen displaying login forms with repeated errors and highlighted text fields for security analysis
00:06
HD
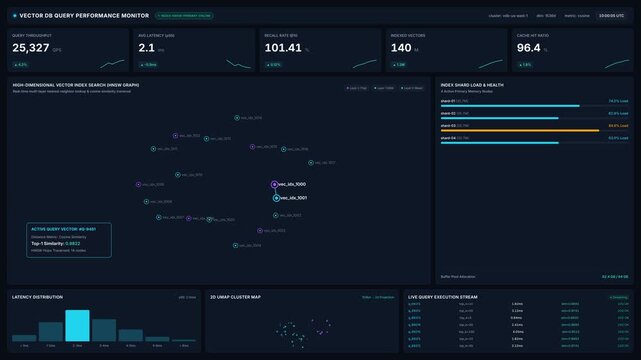
Vector database query performance monitor dashboard for throughput metrics, latency graphs, vector similarity search results, for big data analysis, cloud computing, system optimization
00:20
HD
Neon Energy Radar Screen Technology Animation on black background. glowing neon searching Rader concept animation.
00:10
HD
Abstract Glowing Blue Line Chart Showing Growth on Black Background
00:10
HD
An evolving geometric chart mapping math vectors and numeric intersections along coordinate lines. Tailored for software developer backgrounds and sci-fi movies.
00:20
HD
Financial grid data screen visual glowing numeric columns, date marks, red values, green scanner highlight. Perfect for stock analysis, accounting videos, business dashboards, and 19 graphics.
00:13
HD
Modern flat vector animation featuring a laptop dashboard with social media, engagement, and analytics icons. Ideal for digital marketing, audience growth, performance tracking, and business insights
00:10
HD
a colorful volumetric diagnostics display featuring glowing orbital paths and oscillating wave patterns shown in a triple panel digital interface for complex data analysis monitoring processes
00:06
HD
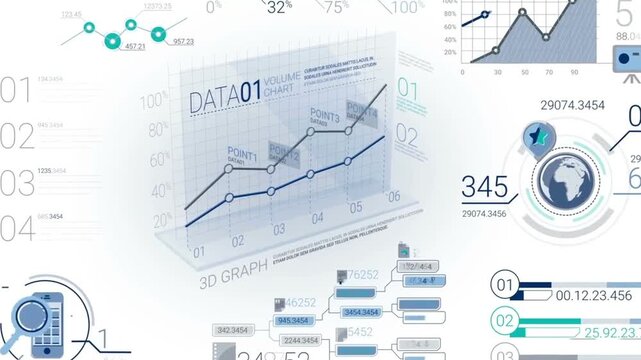
3D business infographic line graph with data animation elements on a white background. Futuristic financial chart HUD interface loop.
00:12
HD
Smart agriculture digital dashboard animation, automated greenhouse monitoring system interface, IoT farming technology concept
00:07
HD
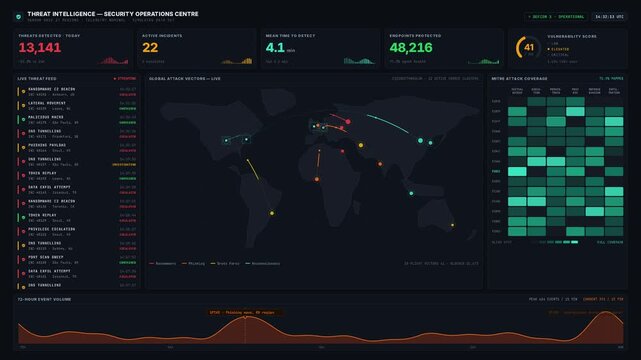
A high-stakes cybersecurity SOC dashboard displays real-time threat intelligence with a world map and live incident feed, illustrating a cold, precise monitoring atmosphere.
00:15
HD
White flat simple icon with shadow, Technology multicolor CPU circuit board background.
00:10
HD
blue and white colour Minimalist bar chart and line graph animation showing financial growth and market data analysis for business presentation
00:10
HD
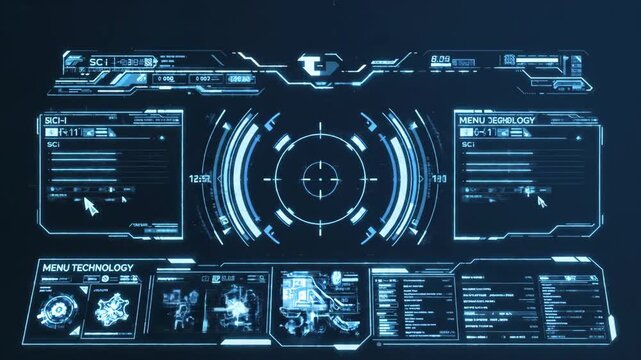
Futuristic HUD Display Interface - A detailed, illuminated interface screen, designed with a sci-fi aesthetic, displays complex technical data, menus, and targeting systems.
00:08
HD
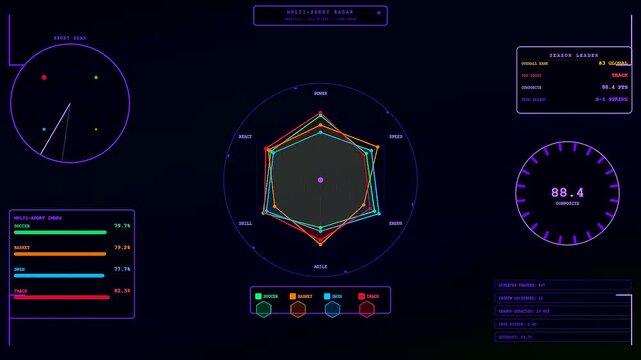
A youth sports dedication dashboard displays complex athletic performance metrics through glowing neon graphical radar charts across a seamless digital interface in dark purple moody lighting
00:06
HD
Seamless 4K looping animation of a sparkline row infographic template with cards sliding. Flat vector shapes, icons and grey text placeholders animate on a clean light background in blue and azure ton
00:07
HD
Animated glowing digital financial charts displaying market data trends on dark backdrop.
00:15
HD
Futuristic Digital Data Dashboard Animation with Virtual Analytics Interface, Big Data Visualization, Artificial Intelligence Statistics and Technology Innovation for Business Analysis
00:08
HD
Abstract graph lines and dots charting upward momentum against a clean white background
00:07
HD
Futuristic scanning HUD ring with glowing green sensor bar analyzing curved waveform data
00:10
HD
AI Chatbot Assistant for Data Analytics on Laptop | Artificial Intelligence and Business Automation cartoon animation
00:10
HD
Flat vector business person working on financial data analysis with animated stock market charts on computer screen motion graphic 4K animation
00:10
HD
Stock Market Exchange Profit Trading Graph Analysis Investment Business Charts. Business Analysis Financial Report Concept. Financial Figures, Graphs, Arrows and Diagrams Growing.
00:20
HD
Data Insight Sweep — 4K Motion Graphic of Magnifying Glass Over Line Graph
00:05
HD
Asian male hand close up view inputting data in table column book on wooden table. Shot from still or static tripod
00:20
HD
Digital tablet screen with graphs, charts, financial data, developments and data records. Panning shot.
00:12
HD
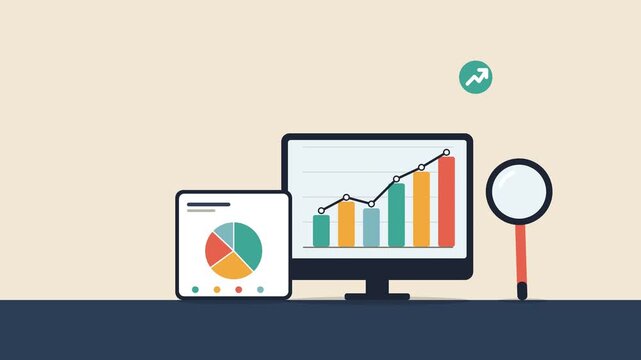
Flat vector animation showing a desktop monitor with a business analytics dashboard, bar charts, target, settings, and pie chart icons for data visualization, performance monitoring, and business inte
00:10
HD
Modern financial growth animation visualizing the progression from revenue to profit, investment, and business growth. Clean corporate vector design with rising charts, financial flow indicators, inve
00:08
HD
2D Motion graphics,Tilt down of  businessman showing colleagues ideas on laptop and discussing work in conference room. Flat cartoon colorful vector illustration.
00:20
HD