Link do ustawienia hasła został wysłany na adres W przyszłości dostęp do zakupów będzie można uzyskać po podaniu hasła.
W ramach bezpłatnego okresu próbnego uzyskasz 3 wideo lub 25 obrazów
Dodano nowe filtry
Sortuj wg

1 204 wyniki wyszukiwania „candlestick chart vector” w kategorii: wideo

Minimalist financial candlestick chart pattern isolated on a black background
00:10
HD
Animated financial stock market chart featuring glowing orange and red candlestick charts, line graphs, and bar charts on a dark background
00:12
HD
A financial candlestick chart showing an upward market trend on black background
00:10
HD
A predictive analytics display shows fluctuating candle charts for virtual market tracking across multiple frames capturing dynamic movement within a dark neon colored digital interface environment
00:06
HD
financial stock market candlestick chart vector animation
00:29
HD
Animated stock market candlestick chart on white background showing financial data trading fluctuations. High quality motion graphics for business and investment concepts.
00:11
HD
Glowing Blue Candlestick Chart Business Background Fluctuating Digital Financial Trading Data Loop
00:20
HD
Seamless looping digital financial stock market candlestick chart animation with animated bar graphs and data metrics in dark blue background 4K animation
00:10
HD
Global financial stock market charts fluctuate dynamically over a glowing digital world map background, illustrating international economic activity.
00:40
HD
Stock market candlestick chart with multi-row trading table displaying price trend and index on screen, financial analysis investment strategy, economic exchange profit wealth
00:20
HD
Technical analysis dashboard showing financial stock market candlestick charts on dark digital interface
00:15
HD
White financial candlestick stock market graph charts moving across a bright blue digital background
00:07
HD
Animated financial candlestick chart with glowing wave on dark digital background.
00:10
HD
Futuristic Market Volatility Candlestick Chart Animation
00:12
HD
Finance Stock Market Candlestick Graph Motion Background
00:29
HD
Glowing Financial Candlestick Charts Abstract Animation
00:05
HD
Financial stock market trading candlestick chart vector animation with upward green trend line and data statistics.
00:10
HD
Abstract digital financial stock market chart with glowing candlestick patterns on a dark blue background.
00:10
HD
Seamless 4K looping finance animation: candlestick chart rising upward motion. Flat vector trading terminal with grid, axis ticks and blank readout cards in deep blue on a deep dark background, leavin
00:07
HD
Financial candlestick chart with green and red bars indicating market fluctuations, growth, and decline, presented as a flat vector graphic on a grid.
00:10
HD
a financial candlestick chart on a dark background featuring green and red candles alongside a turquoise trend line, representing price action in stocks, forex, or cryptocurrency
00:05
HD
Animated financial stock market chart featuring glowing blue and pink candlestick charts, line graphs, and volume bars on a dark blue background
00:10
HD
Minimalist financial candlestick chart showing stock market trends and volatility
00:10
HD
Financial stock market vector motion graphic video showing rotating gears and animated red and green candlestick chart with rising upward arrows for automated trading and business economic growth.
00:10
HD
A digital predictive analytics display shows neon financial candlestick charts flickering across three panels to illustrate real time market fluctuations in a dark electronic trading interface
00:06
HD
Flat vector trading chart covering the entire video frame on solid dark navy background with faint grid: varied green candlesticks appearing one by one from left to right showing a bull market rising
00:06
HD
Financial candlestick chart showing stock market trading trends and investment growth fluctuations over time with motion graphics
00:10
HD
Vector illustration of a rising stock market candlestick chart with green upward bars and red downward bars against a dark blue gradient background, financial growth and investment concept.
00:08
HD
Stock market candlestick chart with red and white bars on a black background
00:10
HD
Stock market candlestick chart with multi-row trading table displaying price trend and index on screen, financial analysis investment strategy, economic exchange profit wealth
00:20
HD
Minimalist candlestick chart drawing with a pencil
00:05
HD
Stock market candlestick chart animation showing falling prices, red and teal trading candles, bearish trend analysis and financial volatility on a dark digital investment dashboard now
00:08
HD
Crypto trading chart showing bullish trend motion analysis with glowing coin icon digital background.
00:15
HD
Animated Financial Candlestick Chart with Volume Bars
00:15
HD
Digital stock market candlestick chart with glowing neon lines showing financial data analysis on a overlay background for business and investment
00:07
HD
Glowing green financial stock market candlestick chart showing price movement trends and technical data analysis on a overlayTransparent  background
00:20
HD
Digital candlestick chart showing a bullish market trend on a dark green background.
00:10
HD
Financial candlestick chart showing stock market trading trends and economic data analytics graphs
00:10
HD
A digital financial chart showing real-time market fluctuations with neon candlesticks on a dark, professional data analysis background.
00:20
HD
Seamless 4K looping finance animation: candlestick with average smooth overlay. Flat vector trading terminal with grid, axis ticks and blank readout cards in teal and cyan on a deep dark background, l
00:07
HD
Animated stock market concept: Green and red candlesticks scroll smoothly across a dark professional trading dashboard while a teal price line draws upward. Seamless loop, 4K.
00:15
HD
Animated financial stock market chart featuring glowing blue and gold line graphs, candlestick charts, and percentage indicators on a dark blue background
00:12
HD
Bullish stock market candlestick chart on white background
00:10
HD
Stock market trading chart with candlestick patterns and trend lines on dark background. 4K. 2D Animation. Flat Animation. Seamless Loop.
00:10
HD
Digital candlestick chart with oscillating trend line on dark green market screen.
00:10
HD
Financial Stock Market Bullish Trend Candlestick Chart and Bull Alpha Channel Animation.
00:06
HD
Glowing neon financial candlestick charts and colorful bar graphs displaying stock market data analytics, corporate business motion background video
00:09
HD
Glowing filled bar chart displaying an upward financial growth trend with a prominent diagonal rising arrow overlay against a dark blue grid background with stock market candlestick charts.
00:10
HD
Financial stock market candlestick chart showing a bullish upward trend for crypto or stock trading
00:10
HD
Dark digital monitor screen showing growth and trading trends, financial investment analysis capital wealth stock market price numbers and candlestick chart data displayed
00:20
HD
A digital reach projection interface shows animated geometric shapes flowing along glowing line paths with candlestick charts fluctuating on a dark screen during system data monitoring
00:06
HD
Bullish stock market candlestick chart animation with rising green and red price bars, forex trading analysis and financial investment trends, digital trading screen video
00:08
HD
Minimalist stock market candlestick chart with blue background and financial indicators
00:16
HD
Financial chart and stock market growth trend vector animation on transparent background
00:10
HD
Minimalist black and white stock market candlestick chart animation with looping price fluctuations
00:07
HD
Digital stock market chart showing fluctuating green and red candlestick patterns on a dark blue background to represent financial trading trends and volatility for global investment analysis.
00:10
HD
A financial candlestick chart displaying market trends on a black background
00:10
HD
Abstract 3D animation of golden financial data charts and candlestick graphs flowing on a dark background.
00:05
HD
A digital candlestick chart showing a downward trend, representing a stock market crash, financial crisis, and overall economic volatility.
00:20
HD
Abstract financial trading background with glowing green candlestick chart and wavy lines.
00:10
HD
Financial chart with growing candlesticks and line showing upward market trend in digital video clip
00:11
HD
Animated financial stock market growth concept featuring a glowing blue upward trend arrow graph, bar charts, and candlestick charts on a dark blue background
00:10
HD
Bearish candlestick chart showing downward trend in stock market trading vector illustration
00:08
HD
Dynamic Financial Market Candlestick Chart Analysis Visualization. 4K. 2D Animation. Flat Animation. Seamless Loop.
00:10
HD
Digital candlestick stock market chart with glowing trend line on dark background.
00:10
HD
Stock Market Candlestick Chart Showing Financial Price Fluctuations
00:28
HD
Isometric glowing blue trading table visualization with financial stock market candlestick charts in background
00:10
HD
Set of eight candlestick stock market charts with fluctuating financial data on a dark background
00:15
HD
Stock market chart with animated wave graph and trading candles moving on dark background
00:10
HD
Market Trading, Red and white candlesticks, stock market and exchange monitor stock, 3D render, analyzing, sign, business financial data.
00:19
HD
Abstract portrayal of a financial cityscape featuring dynamic stock market candlestick charts with green and red colors against a dark background
00:10
HD
Stock market trading animation with red candlestick chart, price volatility, financial trend analysis, investment activity and digital fintech business intelligence background video
00:08
HD
V Shape Stock Market Reversal Panic Selloff to Massive Bullish Surge Candlestick Chart Animation 10 Seconds Loop in 4K UHD
00:10
HD
Stock market trading chart with red and green candlesticks and glowing blue wave lines
00:10
HD
Minimalist digital candlestick chart isolated on a deep black background
00:10
HD
Stock Market Trading Analysis on Computer Monitor with Candlestick Chart, Growth Graph and Coins
00:08
HD
A digital dynamic pricing dashboard with glowing candlestick charts fluctuating in real time across three separate user interface panels showing shifting market trends and financial data activity
00:06
HD
Stock market investment dashboard with flat vector animation style
00:10
HD
A dynamic digital financial candlestick chart illustrates real-time market fluctuations, highlighting global economic trends and investment performance on dark background.
00:20
HD
Financial Stock Trading App Interface with Candlestick Chart and Successful Buy Order Execution Notification, Minimal Vector Animation Loop
00:12
HD
Financial stock market vector motion graphic video featuring animated red and green candlestick chart with rising upward arrows for trading, crypto investment, and economic growth on black.
00:10
HD
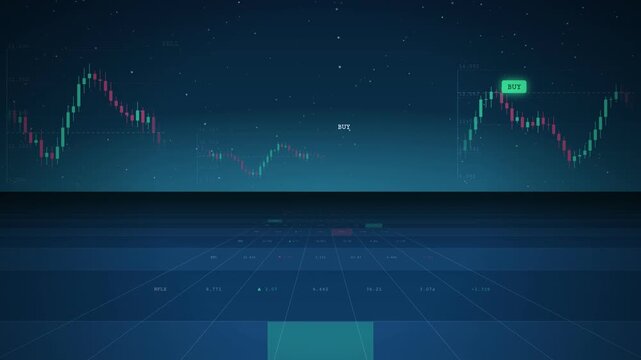
Animated financial stock market trading interface featuring candlestick charts, buy and sell signals, and a digital ticker grid on a dark blue background
00:10
HD
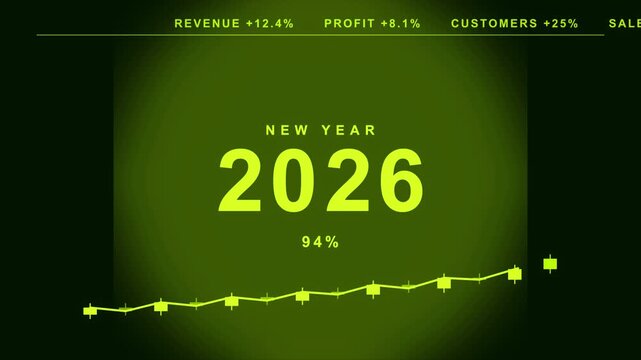
Financial stock chart overlay with new year twenty six data in green market candlestick graph and revenue statistics displayed with 2026 text
00:20
HD
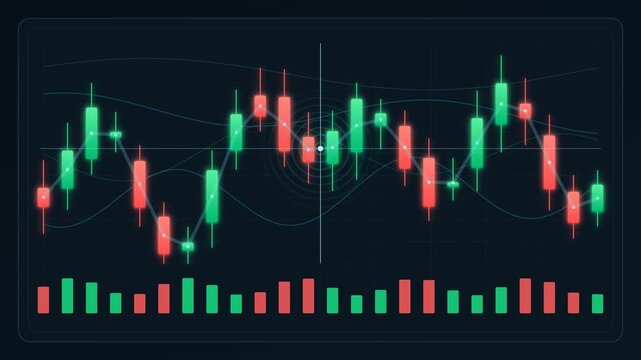
Stock market candlestick chart with moving averages and volume indicators on a dark background. 4K. 2D Animation. Flat Animation. Seamless Loop.
00:10
HD
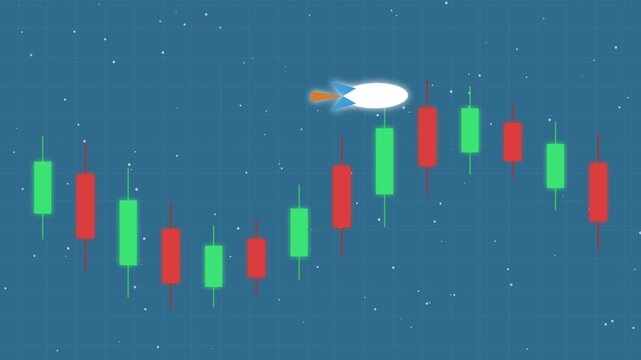
Crypto rocket soaring past candlestick charts in space showing financial growth.
00:15
HD
Financial Candlestick Chart Showing Market Price Movement and Trends
00:10
HD
Stock market growth animation featuring a rising arrow and dynamic candlestick chart on a white background. Concept of financial success, trading profit, forex market analysis,
00:05
HD
Financial Market Analytics and Trading Dashboard.mp4
00:05
HD
financial background with rows of glass candlesticks, price scale and a pulsing live price on a dark navy background
00:11
HD
Stock Market Candlestick Chart Financial Trading Animation
00:09
HD
Bullish candlestick chart vector icon representing financial stock market growth trading analysis and investment profit
00:15
HD
Global stock market trading animation with rising candlestick chart across a digital world map, showing global finance, investment growth, forex trends and worldwide connectivity
00:08
HD
Flat vector motion graphic of a modern financial analytics dashboard window interface featuring sequentially appearing sidebar widgets, clean candlestick chart bars, and layered UI panels
00:10
HD
Global market candlestick trend animation, Earth globe on left with ascending blue candlestick stock chart
00:10
HD
Candlestick trading chart dashboard animation on green screen
00:10
HD
Stock market live trading chart and profit locked in vector animation on transparent background
00:10
HD
Financial stock market chart showing bullish trading trends and candlestick indicators on a blue background
00:07
HD
Digital candlestick financial chart showing market price volatility
00:07
HD
A digital financial chart shows fluctuating stock market candlesticks with a glowing neon aesthetic over a dark world map background.
00:20
HD
financial chart with uptrend line candlestick graph in stock market, Stock market data on LED display. Business analysis concept share market chart line
00:10
HD