Link do ustawienia hasła został wysłany na adres W przyszłości dostęp do zakupów będzie można uzyskać po podaniu hasła.
W ramach bezpłatnego okresu próbnego uzyskasz 3 wideo lub 25 obrazów
Dodano nowe filtry
Sortuj wg

5 546 wyników wyszukiwania „block chart” w kategorii: wideo

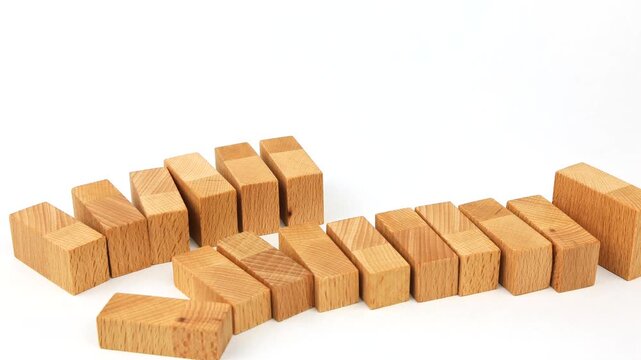
Wooden blocks are placed and stacked like a chart or a staircase, set against a white background
00:08
HD
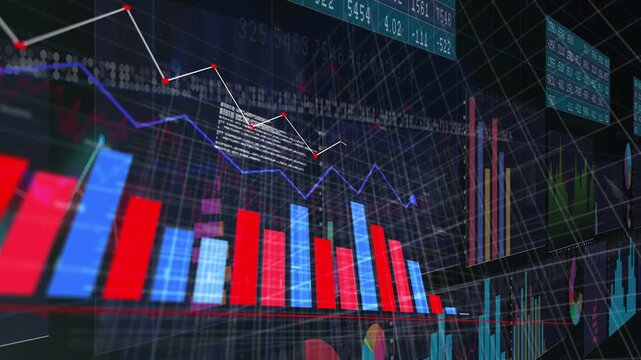
Camera starting right pan, financial chart block shifting bars, tracing downtrend to show decline
00:10
HD
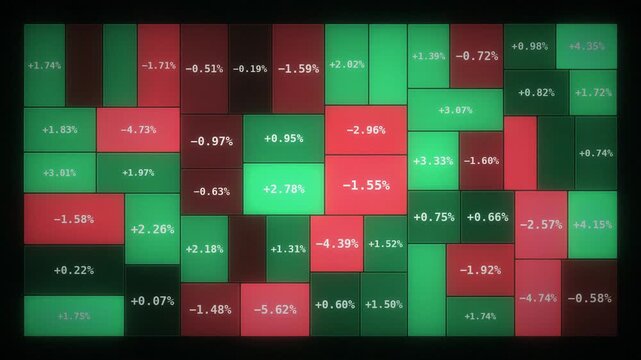
Abstract financial stock market heatmap with red and green performance cells, glowing data grid, irregular chart blocks and trading activity showing market volatility on dark background
00:10
HD
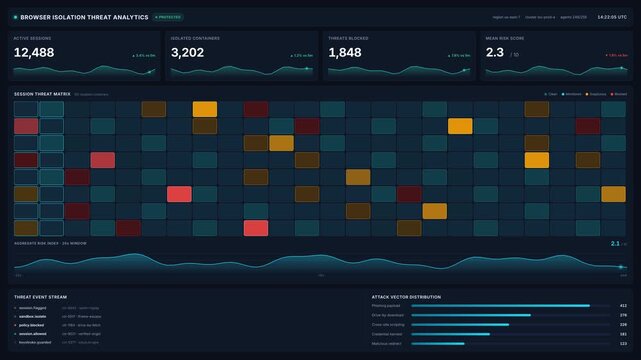
Browser isolation threat analytics dashboard for active sessions, isolated containers, blocked threats, risk scores, for cybersecurity monitoring network defense
00:20
HD
Digital audio equalizer and data visualization bars moving
00:10
HD
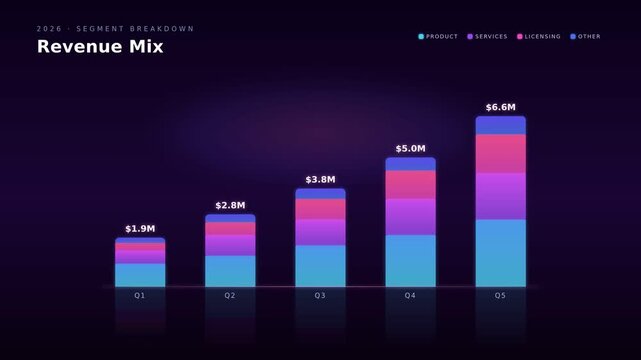
Stacked bar chart demonstrates quarterly revenue mix through segmented colorful blocks reflecting financial growth.
00:05
HD
A red line on arrow highlighting business growth on wooden blocks bar chart
00:05
HD
The acronym IPO Initial Public Offering is spelled out using three wooden letter blocks placed on top of a background featuring financial candlestick charts and graphs. 3D render animation
00:07
HD
Sustainability business seedling growth chart wooden block finance investment strategy concept with plant seedling soil, wooden block chart graph beside desk soft sunlight for planning and success
00:10
HD
Rising bar chart columns transition on green screen, colorful flat shapes cover the frame then reveal, chroma key overlay
00:05
HD
Business sustainability blocks stacking into an esg dashboard. 4K Video
00:17
HD
block chain set with futuristic HUD interface elements and abstract infographic charts on dark background 4k video
00:10
HD
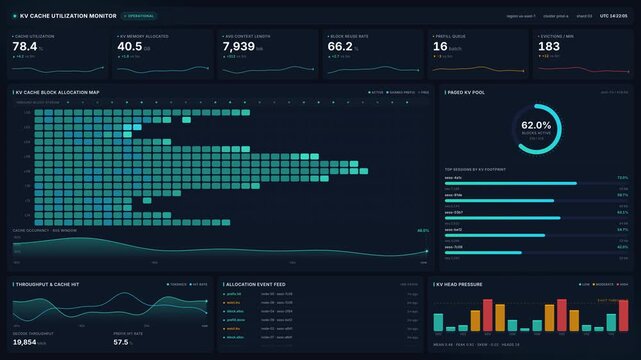
Kv cache utilization monitor with memory allocation metrics, block reuse rate, throughput graphs, for server performance tracking data center optimization
00:20
HD
Blue chart block switching between bar line and donut tilted view
00:15
HD
Text character stock chart made of dots, slashes and block symbols scrolls across a glowing amber retro terminal
00:15
HD
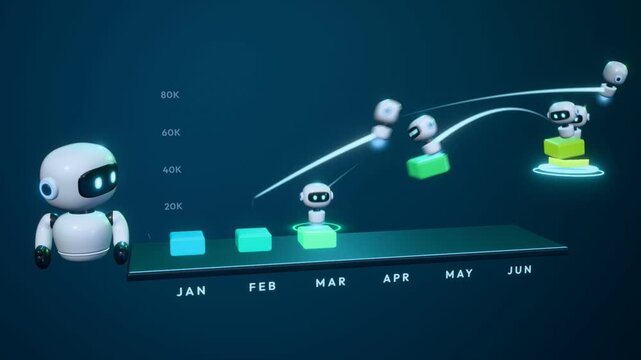
Robot team stacking blocks into a bar chart showing monthly business growth with a rising arrow
00:16
HD
Rectangular bars display progressive data visualization with expanding colored segments graphic segments blocks progress rectangle chart
00:10
HD
Chart block switching between bar line and donut close-up endless loop
00:10
HD
Data blockchain diagram featuring connected blocks and financial charts against a dark digital background.
00:12
HD
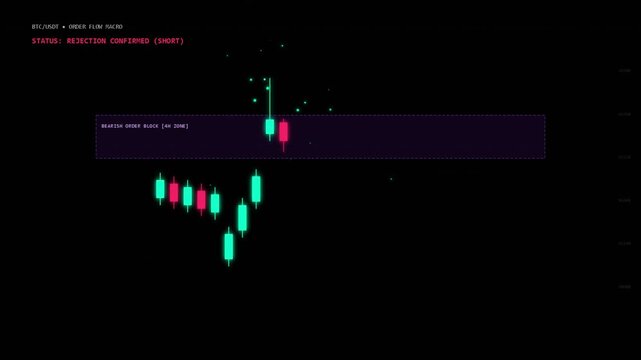
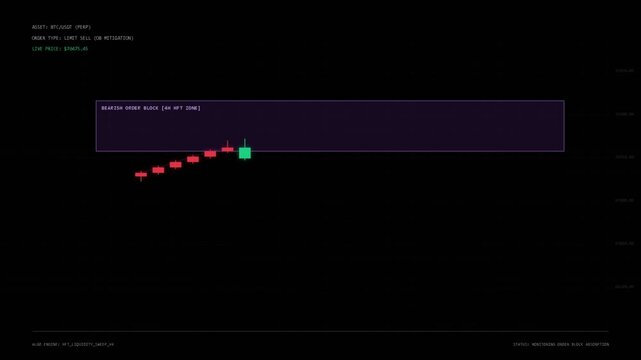
Bitcoin price chart showing bearish order block
00:10
HD
Wooden blocks are placed and stacked like a chart or a staircase, set against a white background
00:15
HD
Digital data pipeline and API integration isometric concept showing information flow through processing blocks with glowing neon lights and charts
00:08
HD
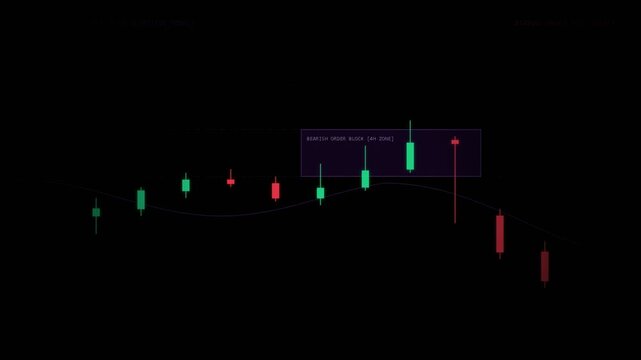
Financial candlestick chart showing a bearish order block zone
00:10
HD
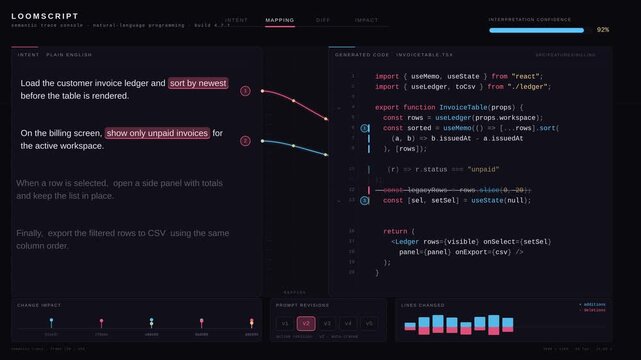
A dynamic dashboard visualizing natural language programming prompts and corresponding generated code changes with animated connections and vibrant color accents.

00:15
HD
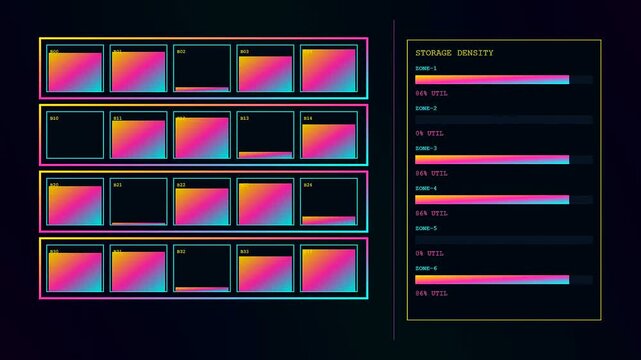
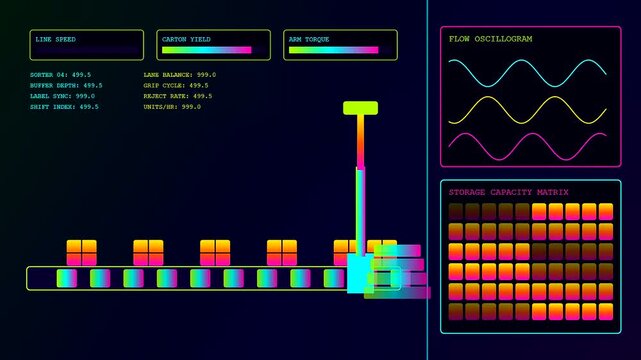
Data for warehouse optimization appears on a digital screen displaying grid blocks with gradient bar charts and status updates for inventory tracking in a virtual interface
00:06
HD
wooden blocks with gst letters spelling goods and services tax with stock market graph background, financial concept
00:08
HD
Hand Placing White Block on Growing Chart Against Yellow Background
00:10
HD
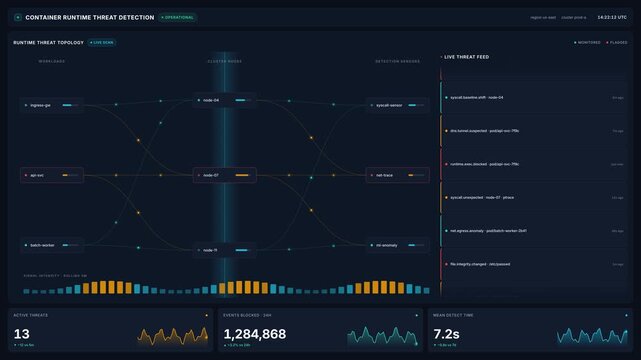
Container runtime threat detection dashboard for kubernetes cluster security topology, live threat feed, blocked events, mean detect time for cloud security monitoring
00:20
HD
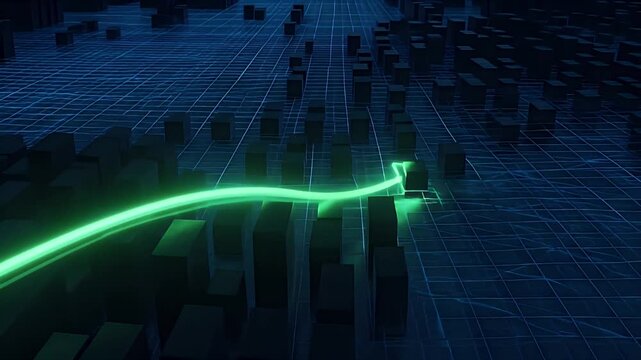
Finance growth arrow chart data analysis business investment profit technology 3D rendering futuristic digital grid with glowing green arrow rising over dark bar blocks showing market trend momentum
00:10
HD
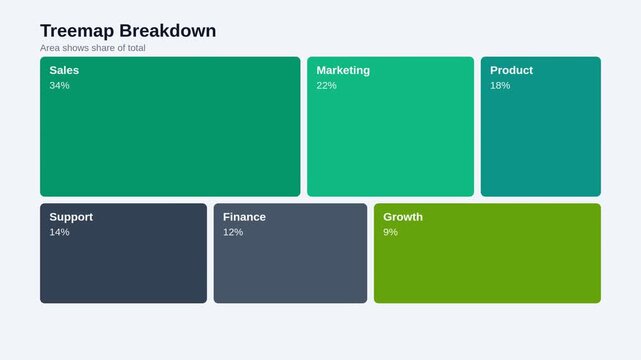
Animated treemap chart with nested emerald and slate rectangles showing shares
00:12
HD
Minimalist digital bar chart graphic moving across interactive interface with yellow blocks
00:10
HD
Glowing golden bar chart made of translucent crystal blocks showing business growth and financial success on a dark background with sparkles
00:10
HD
Glowing blue glass blocks arranged in ascending bar chart formation reflecting on dark surface for financial growth and data analysis
00:08
HD
Corporate chart presentation tools draw ascending business asset income blocks on black. Financial budget planning software utilizes a corporate chart presentation tools.
00:07
HD
A digital cloud orchestration dashboard interface featuring neon glowing line charts flow diagrams and modular data blocks moving across a dark purple computer screen monitor
00:06
HD
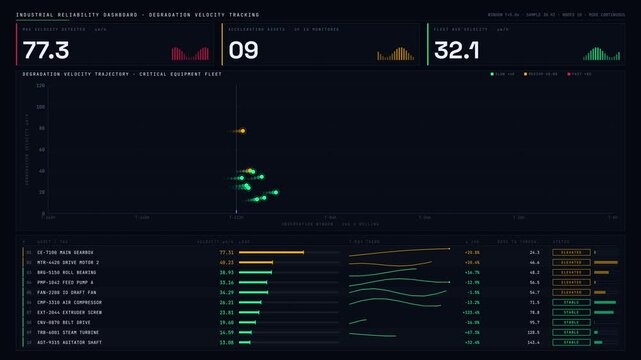
Explore an advanced industrial reliability dashboard showcasing degradation velocity tracking on critical equipment with animated charts and KPI blocks in dark mode.
00:15
HD
Data recovery interface rebuilding blocks and checking integrity
00:15
HD
3D Render Financial Interest Rate Percent Symbol Bar Graph Arrow Down. Isometric 3D illustration featuring floating percentage signs red downward arrow transparent bar chart blocks dark background
00:10
HD
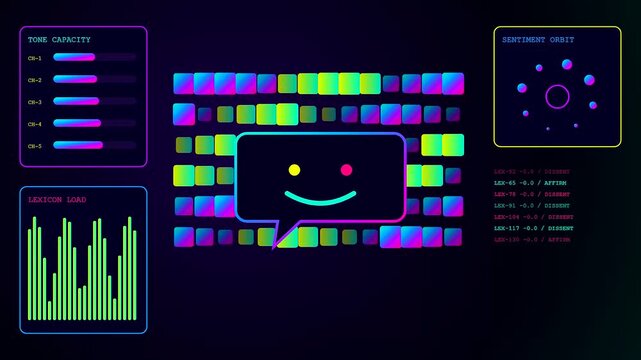
Digital sentiment analytics interface displays fluctuating user feedback metrics through colorful square block grids and circular radar light patterns flickering in a dark virtual console environment
00:06
HD
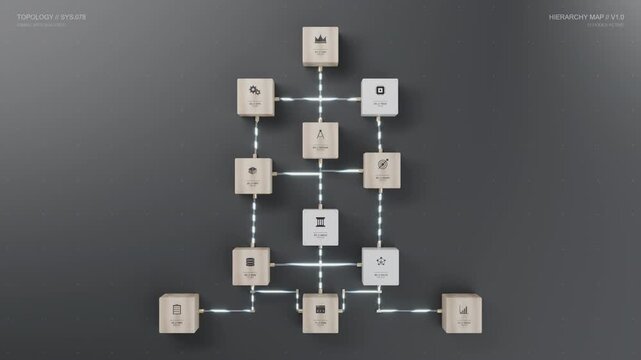
Minimalist corporate organizational chart with wooden blocks on dark mat
00:06
HD
Metallic blocks rising to form financial growth chart with glow
00:05
HD
2D flat vector motion graphic illustrating a data analytics workflow. Raw data blocks enter a dashboard, reorganize into a bar chart and pie chart, and culminate in an upward trend indicator in a seam
00:08
HD
Abstract 3D rendered business growth chart with blue and white blocks representing data analytics and statistical progress in a corporate environment
00:08
HD
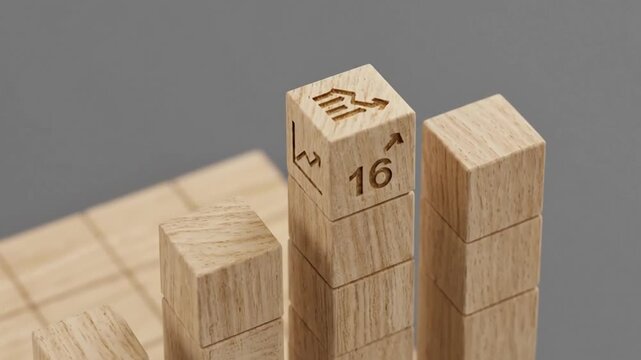
A wooden block chart showing growth on a neutral gray background
00:08
HD
Isometric 3D bar chart assembly with translucent acrylic blocks, LED Fresnel edges, and blueprint grid on transparent alpha in 4K loop.
00:10
HD
A rising bar graph shows progress with blue blocks on a grid background
00:10
HD
Stacked glass column chart animation seamless loop with glowing gradient blocks, business financial statistics visualization
00:15
HD
Web application firewall dashboard with request filtering statistics, blocked threats, attack categories, for cybersecurity monitoring network protection
00:20
HD
Digital data visualization interface overlay featuring looping charts and code blocks on a black background
00:15
HD
Cinematic 3D bar chart blocks rising and falling on a digital grid surface symbolizing growth and data analytics for business success
00:08
HD
Digital circuit board with glowing data blocks and rising bar chart animation, futuristic technology concept
00:10
HD
Cryptographic Hash Generator Interface Screen Displaying Real Time Block Validation Pool And Blockchain Ledger Verification Entropy Density Chart Green HUD Software.
00:15
HD
Blue glass blocks forming abstract bar chart on dark surface
00:06
HD
Bitcoin trading chart with bearish order block analysis

00:10
HD
Rocket launches from the top of an isometric bar chart as 3D blocks rise step by step along a growth arrow
00:13
HD
Digital displays showing warehouse optimization with robotic arms moving colorful blocks on a conveyor belt with grid matrices and oscillating wave charts in a dark room
00:06
HD
Process Flow Diagram with Arrows and Boxes Minimal Icon. Work flow Chart Symbol with Connected Steps. Flowchart Icon with Directional Arrows and Blocks .4K Motion Graphics.
00:10
HD
Chart block switching between bar line and donut room scene assembling
00:10
HD
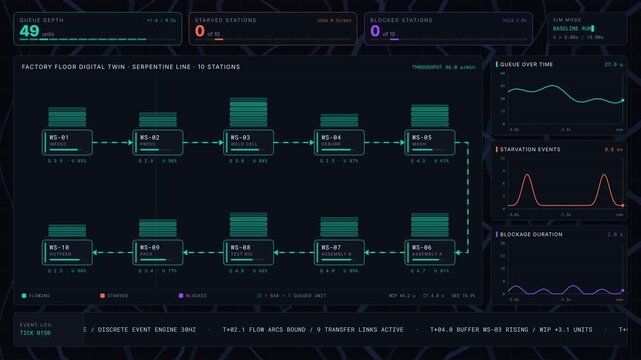
Dynamic Factory Flow Twin Dashboard visualizing queues, starvation, and blocked stations with animated KPI metrics and real-time data updates in a dark premium interface.
00:15
HD
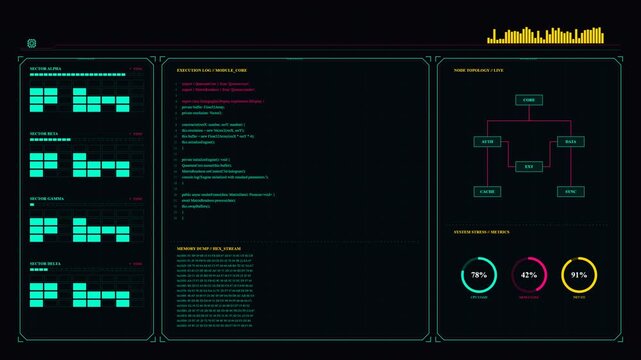
HUD UI Data Dashboard with Cyan Scrolling Text Blocks and Digital Infographic Charts Shifting on Black Background for Cybernetic Technology Interface.
00:20
HD
Blockchain network illustration featuring connected digital blocks coins and financial charts
00:10
HD
A blue arrow pointing upward and a bar chart made of blocks, set against a blurred night cityscape. The concept of growth, profit, and financial success
00:09
HD
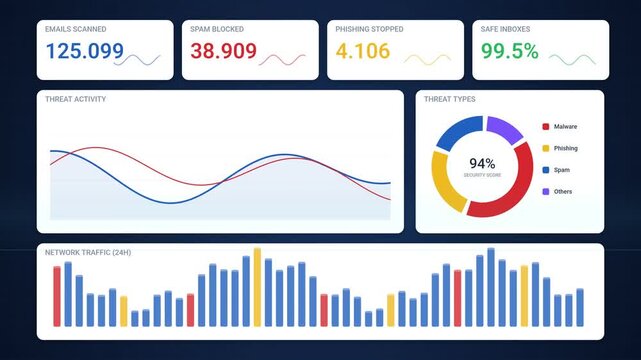
Cybersecurity analytics dashboard animation with live threat charts, email scan statistics, donut chart and network traffic bars
00:15
HD
Low angle view along ascending row of cyan bar chart blocks forming a corridor
00:10
HD
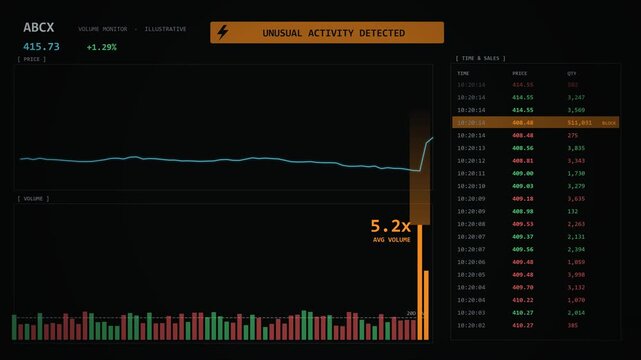
Trading terminal detects unusual volume as a bar spikes to five times average and block trades flood the time and sales tape
00:10
HD
Synthetic data generation interface displaying animated grid screens and colorful status charts during system processing and analytical loading procedures
00:06
HD
Animating data mosaic on wall display, frames advancing, rings focusing teal chart and pink blocks
00:12
HD
Holographic cubes form shifting stack in dark digital space. Bright geometric blocks glow above wireframe floor, surrounded by floating code, charts and sparkling data particles, while stack changes
00:05
HD
Multicolor block chart visualizes increasing capacity
00:11
HD
Gpu memory fragmentation monitor dashboard for animated block map trend charts, for real time performance analytics, resource tracking, memory risk detection
00:20
HD
4K UHD clean promotional animation with restrained color blocks, product-shaped forms and generous editable copy space.
00:10
HD
modular data blocks transform into circular performance chart
00:27
HD
 Neon bright glowing countdown timer from 20 to 0 seconds. Neon glowing countdown timer 20 second animation .interesting neon number animation.  Neon Countdown Numbers 20 Second block background
00:20
HD
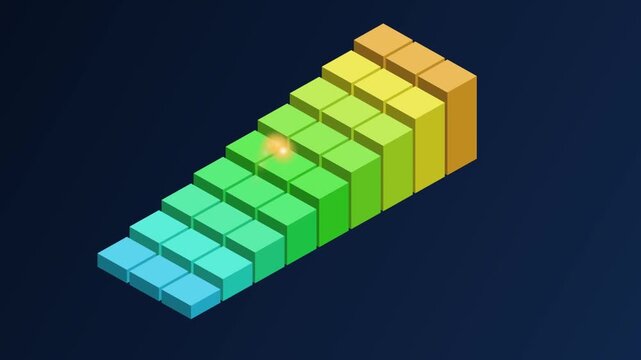
Isometric stairs chart graphic illustration. Colorful gradient block steps ascending with glowing light point. Data growth visualization, career progress, and business success concept.
00:10
HD
Abstract background with rising arrows and square patterns, symbolizing growth progress success and business increase animation
00:20
HD
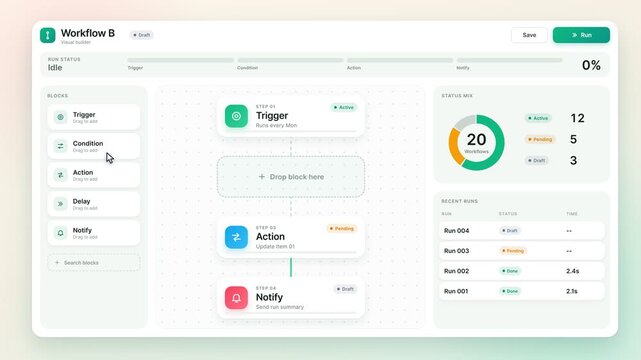
Workflow automation software interface isolated on solid background showing logic block drag and drop and process execution, clean SaaS dashboard animation.
00:24
HD
Neon digital display showing a contactless payment interface with grid patterns and bar charts for data visualization in a futuristic interface design for modern commerce systems
00:06
HD
Minimalist black blocks showing upward growth on a grey gradient background
00:08
HD
Cybernetic City Block Emerging from Digital Grid
00:08
HD
Abstract 3D bar chart animation with glowing neon colors
00:15
HD
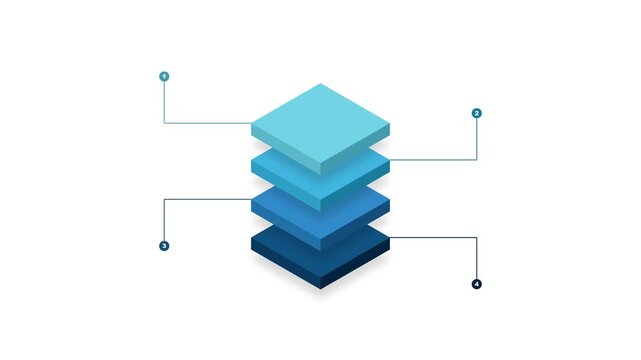
Isometric data stack infographic with four layered blocks and pointer lines for technology presentation
00:08
HD
Close-up of a businessman touching a wooden block with a target and arrow icon, completing a step chart with rising arrow graphics for goal achievement, growth, and success concept.
00:15
HD
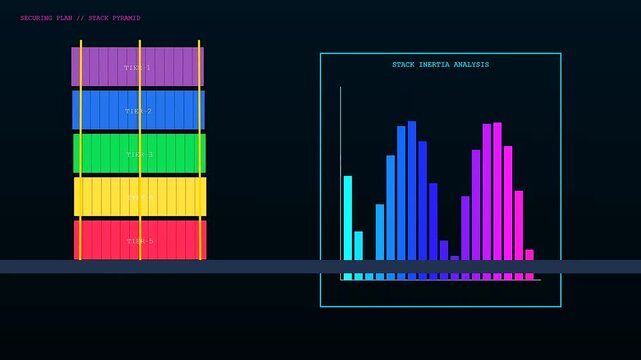
Digital displays showing container lashing and stack inertia analysis with multicolored block towers arranged in vertical sequences across a dark blue gradient digital interface monitor screen
00:06
HD
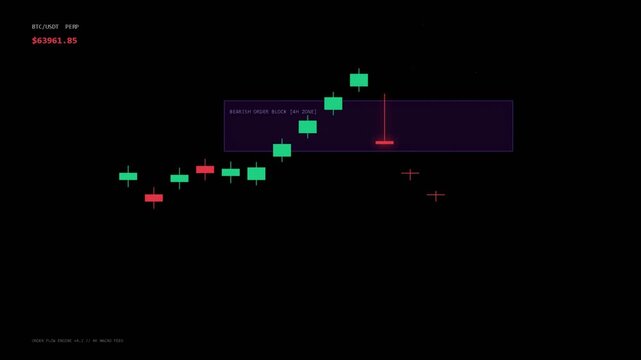
Bitcoin price chart showing bearish order block technical analysis
00:10
HD
Item unavailable symbol with burger icon displayed over dark blurred digital dashboard interface with various analytical charts and data metrics in the background
00:06
HD
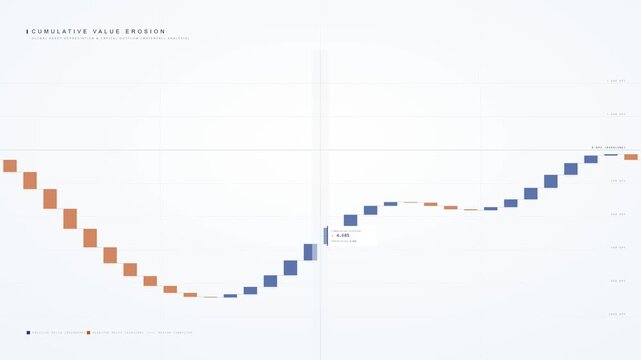
Cumulative value erosion chart animation showing asset depreciation on white background.
00:10
HD
Analyst tapping phone by highrise window causing semi-transparent charts updating business metrics
00:12
HD
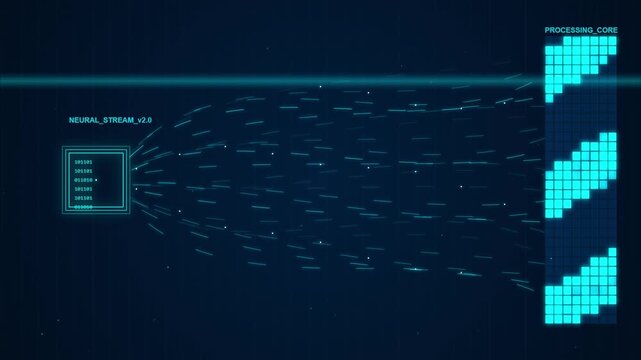
Digital data stream flowing from a matrix grid to a block of glowing cyan bars, data analysis and processing, technology background
00:11
HD
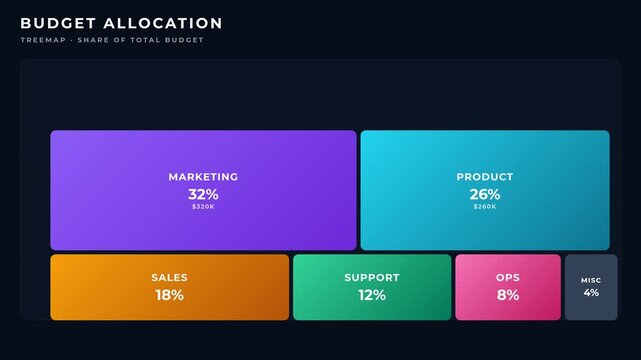
Animated budget allocation treemap chart with colorful department blocks on a dark background
00:08
HD
Abstract Geometric Blue Blocks Forming an Upward Chart, Deep Azure Void with Dramatic Side Illumination
00:08
HD
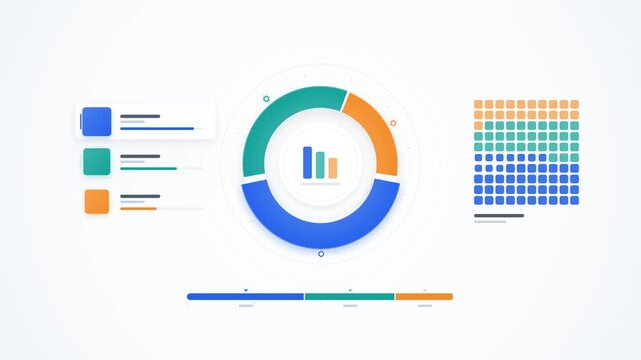
Market share comparison infographic animation with rotating three segment donut chart, proportional blocks and waffle chart in blue, teal and orange on white background, seamless loop
00:18
HD
Colorful blocks are arranged in a graph on a dark background
00:05
HD
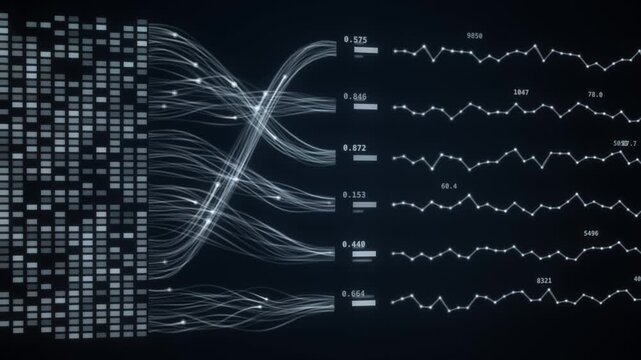
White data flows connect a grid of data blocks to live line charts with numbers on a dark background, analytics visualization technology
00:23
HD
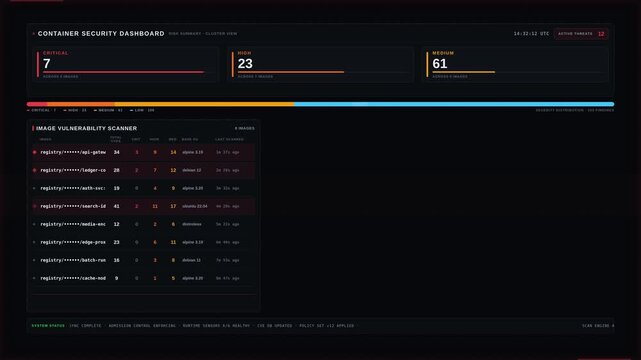
A sophisticated container security dashboard showcasing vulnerabilities, images, workloads, and policies with dynamic KPI blocks and animated compliance visuals in a dark threat-matrix atmosphere.
00:15
HD
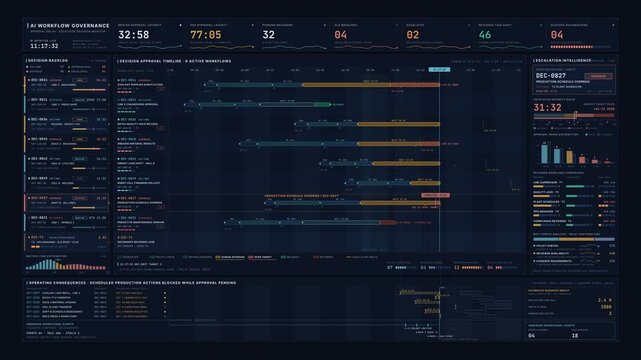
Premium enterprise AI workflow governance dashboard tracking approval delays, escalated operational decisions, and blocked execution in a dark command interface.
00:15
HD
Close-up of Wooden Blocks Arranged as a Bar Chart on a Table
00:10
HD
Digital silicon security interfaces display dynamic blocks connected in a sequence within a glowing dark environment featuring changing data values and colorful linear progress charts
00:06
HD
Futuristic iot security threat ai dashboard with live attack vector distribution, device topology, blocked threats, anomaly index for real time network monitoring
00:20
HD
A diverse business team collaborates to discuss security and AI strategy, surrounded by charts and data on the table, showcasing a modern office atmosphere. Raster
00:12
HD
A data grid of streaming numbers changing on display. Animation. Abstract millions flying blocks of content changing all the time on black background, seamless loop.
00:20
HD