

Line Graph Chart Infographic for Time Series in Business Presentation Layouts
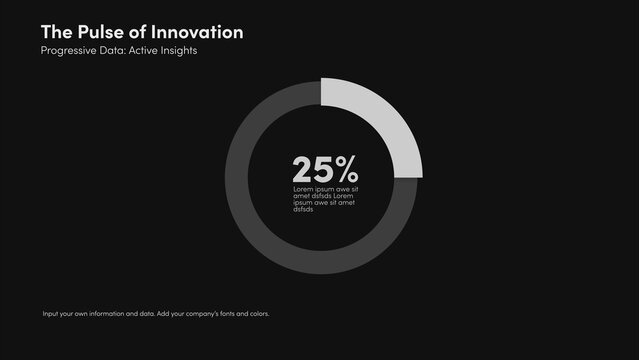
Statistical Graphics Pack | With Control Panel for every Scene
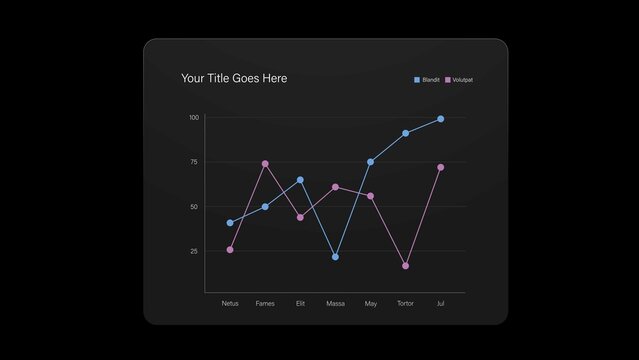
Line Chart Infographic Video Template
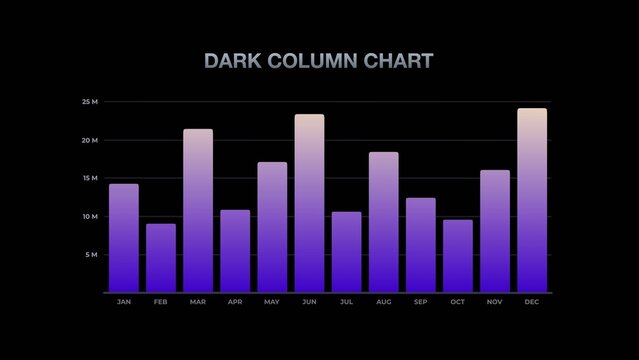
Modern Gradient Dark Column Chart
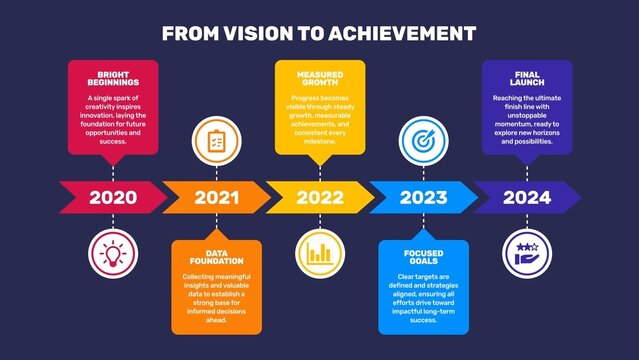
Linear Icons Modern Timeline Infographic
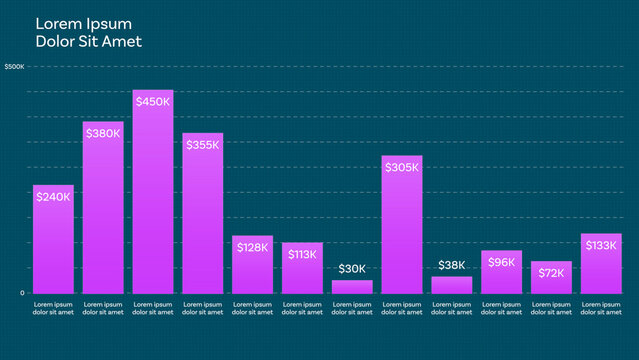
Responsive Vertical Bar Chart for Design and Data Visualization Design and Slide Presentation and with 12 Animated Data Points + Custom Text + Color with Dual Bar Graph Mode and Dynamic Auto-width Bar
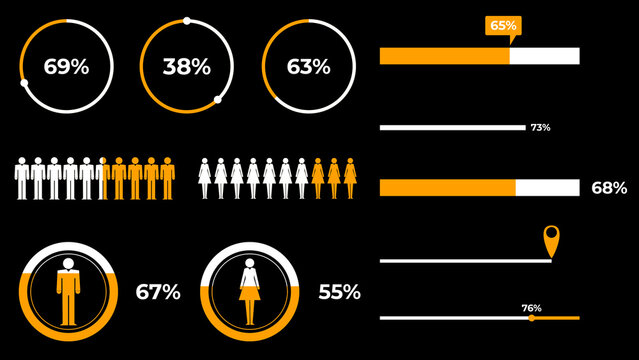
Infographics Elements.

Waterfall Chart Infographic Template with Minimal Design

Clean And Modern Business Analytics Dashboard UI
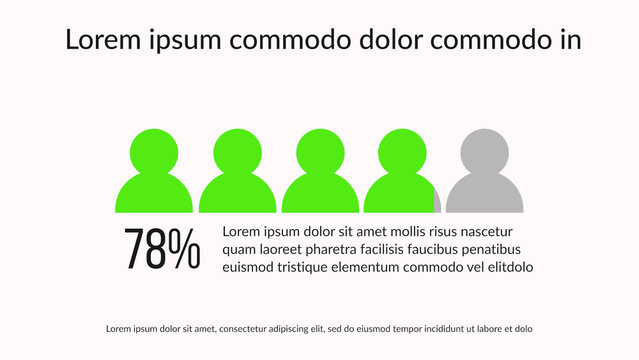
Infographic 08

Account Service Dashboard

Bento Box Dashboard UI Template, Modern Analytics Infographic Widgets, Admin Panel, App Dashboard Layouts
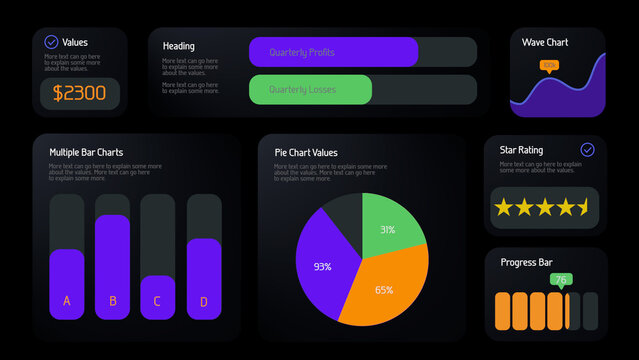
Bento Widget Infographic Tabs
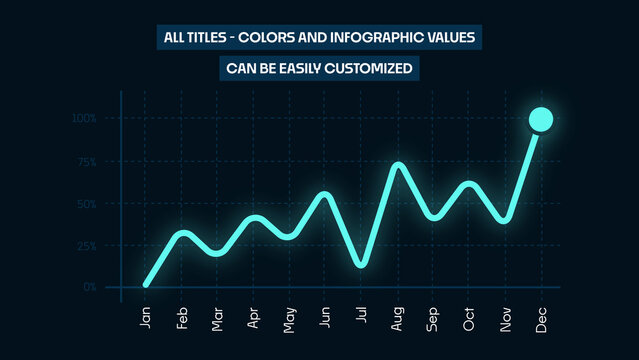
Animated Line Chart Infographics | Business Data Visualization and Analytics Graph
HUD Neon Infographics Line Number x1
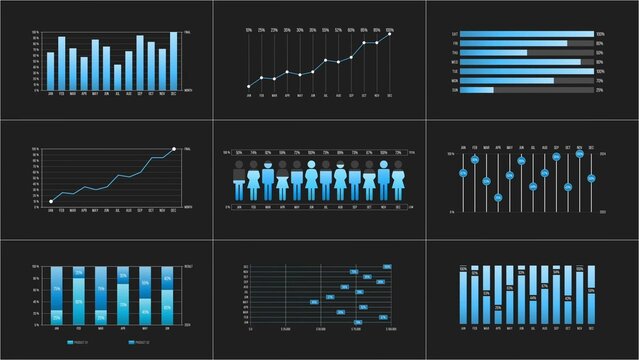
Elegant Infographic Charts

Bento Box Business Infographic Template for Dashboard Report, KPI Metrics, Data Visualization
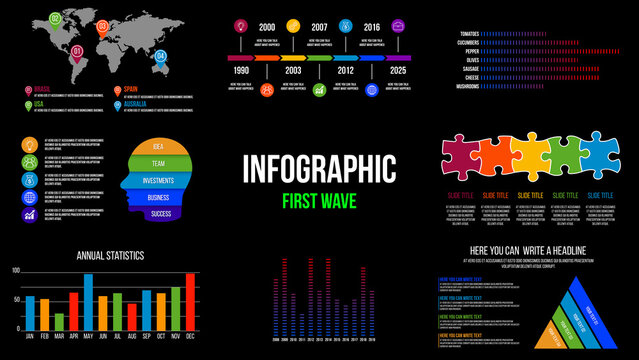
8 Infographics Elements

Stat Infographic with Increase and Decrease
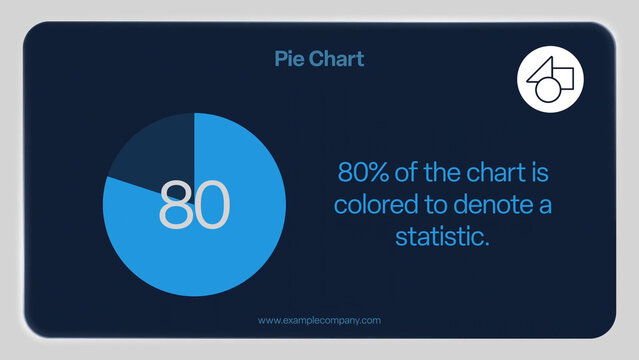
Elegant Pie Chart Infographic Slide

Business Analysis Presentation Template, Corporate Report Pitch Deck & Company Profile Analytics
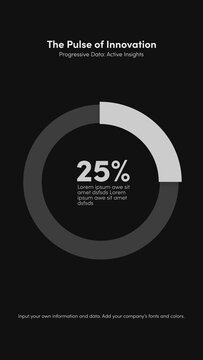
Social Statistical Graphics Pack | With Control Panel for every Scene
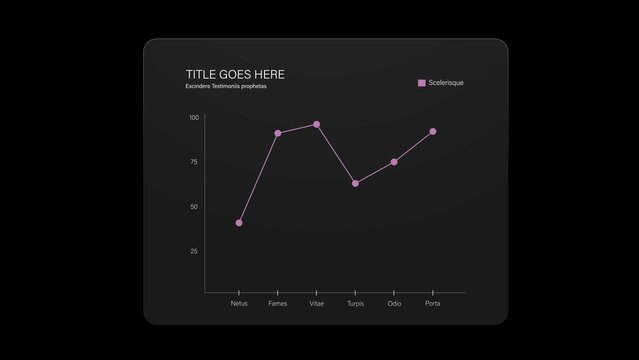
Line Chart Infographic Video Template
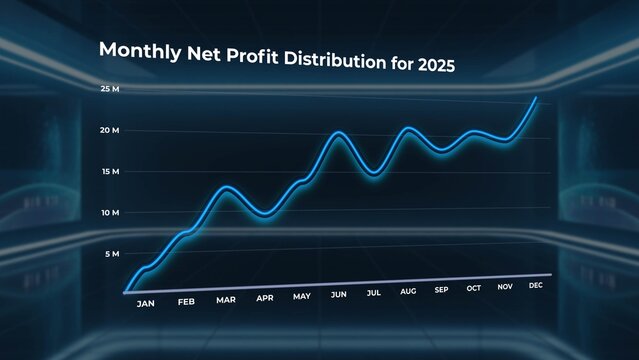
3D Glass Financial Line Chart
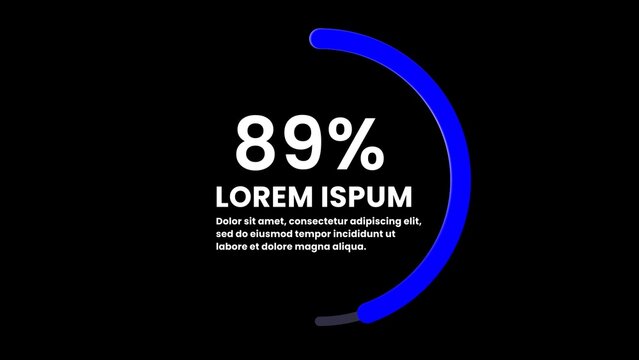
Percentage Graph Chart Infographic

Corporate Annual Report Template, Financial Brochure & Company Profile Booklet with Charts and Financial Statements for Shareholders
Annual Infographic Timeline Template with Gradient Wave Line
Project Steps Infographic Template with Gradient Elements and Icons
Modern Dark Analytics Dashboard UI
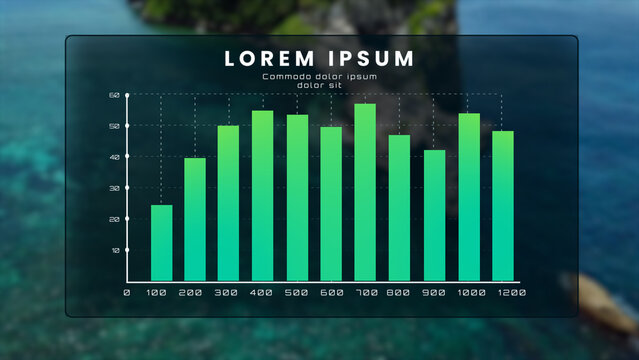
Infographics
Business Intelligence Dashboard Presentation Slide Template
Bento Box Business Infographic Template For Dashboard Report, KPI Metrics, Data Visualization
Business Infographic Set
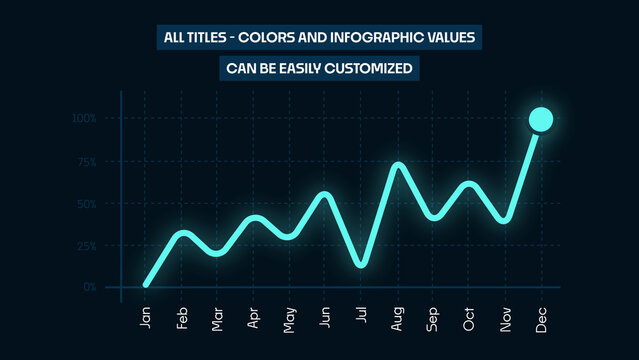
Animated Line Chart Infographics | Business Data Visualization and Analytics Graph
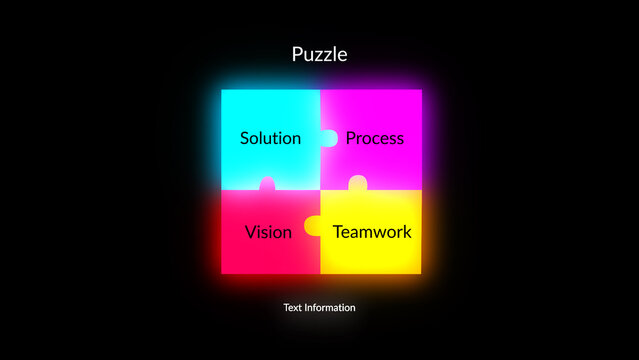
HUD Neon Icon Graph Puzzle
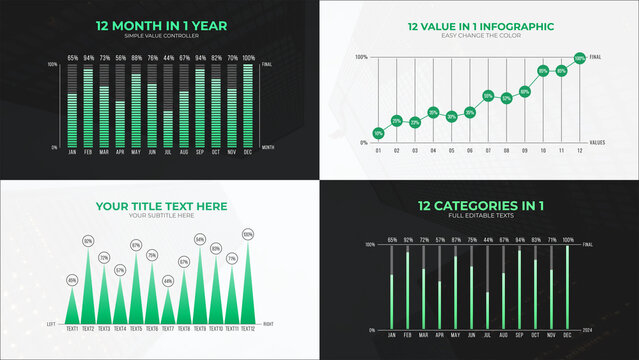
12 Value in 1 Infographic Charts
Cyber Security Threat Analysis Dashboard UI Kit
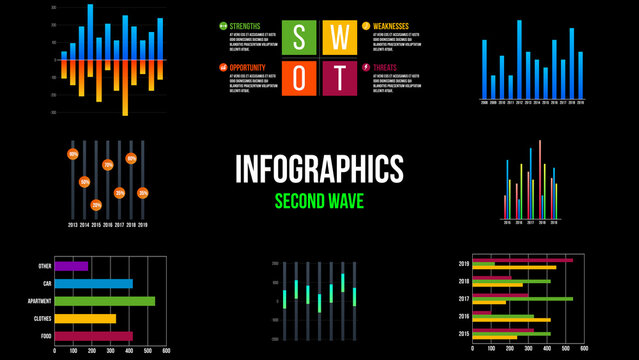
8 Infographics Elements
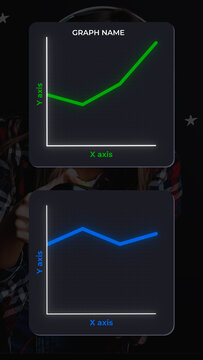
Mini Line Graph For Data Analytics And Trends Forecast
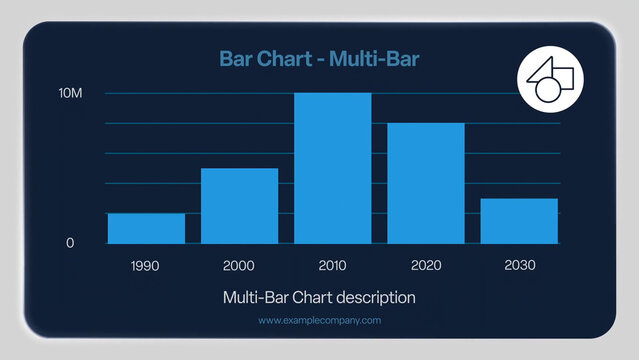
Elegant Multi-Bar Chart Infographic Slide
Business Presentation Template in Corporate Dark Black & Orange Theme For Company Profile Pitch Deck
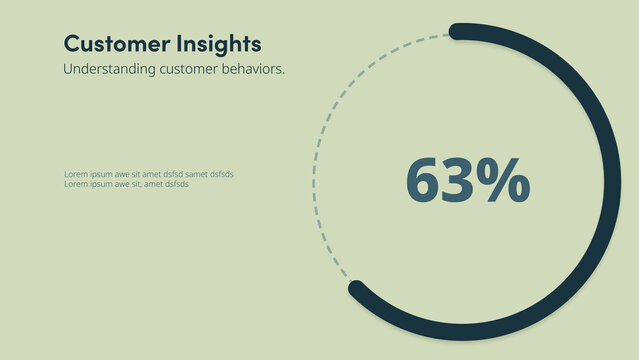
Customer Insights | with Control Panel
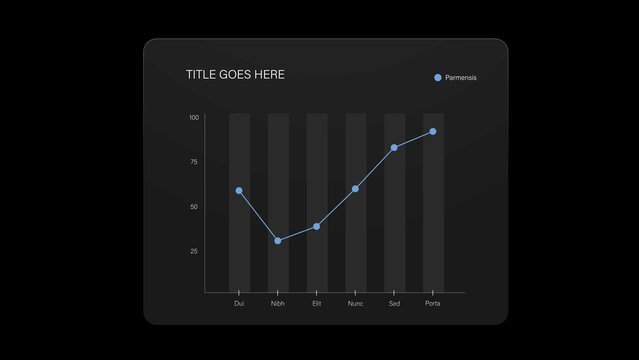
Line Chart Infographic Video Template
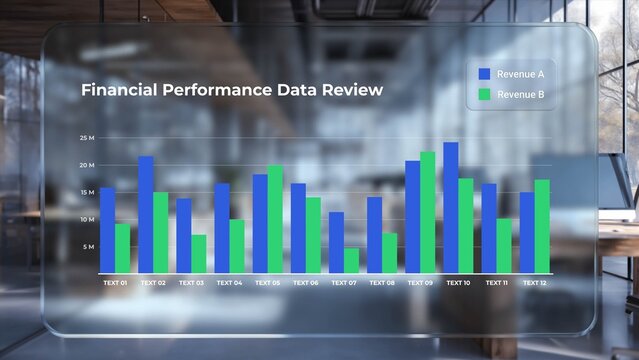
Glass Dashboard Bar Chart Infographic Template
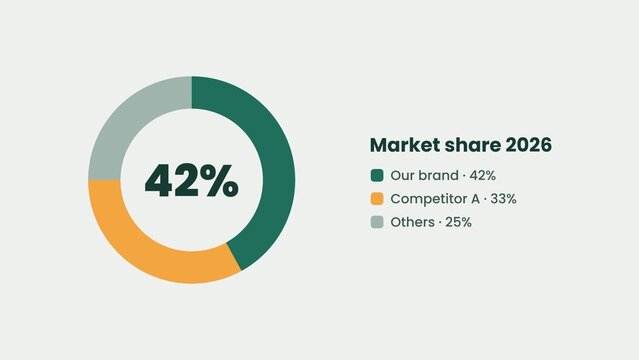
Donut Circle Split Pie Chart Market Share Infographic
Environmental Case Study Research Poster Template, Landscape Scientific Infographic & Fact Sheet for Ecology Conferences
Dark-themed Infographic with Purple Accents
Business Process Teamwork Infographic Template with Staircase Minimal Illustration
Business Report Presentation Template Corporate Pitch Deck

Infographics 14
Ecommerce Admin Dashboard UI Template
Modern Business Infographic Presentation Template
United States Map Infographic
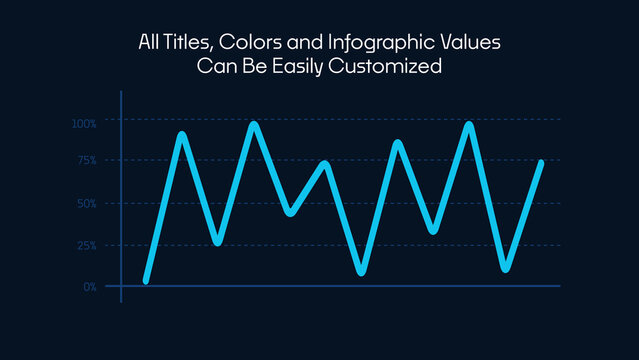
Corporate Infographics Template | Dynamic Data Visualization, Business Marketing and Statistical Graphs for Presentations

HUD Neon Infographics Line Graph x5
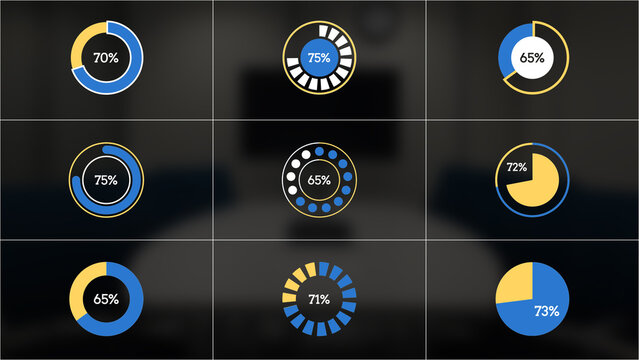
Simple Pie Infographic
Data Analytics Black and White Outline Style Icons Set
Annual Report Brochure Template Layout
Business Dashboard Design
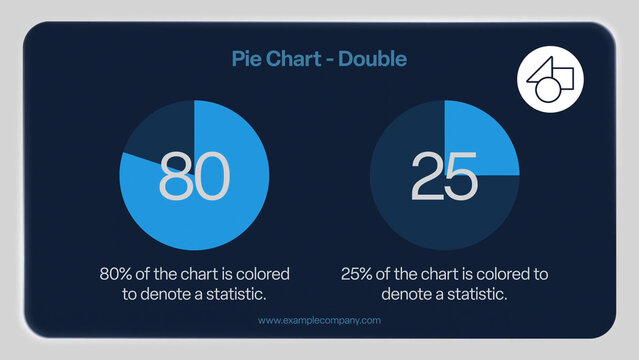
Elegant Double Pie Chart Infographic Slide
Bento Box Business Infographic Template For Dashboard Report, KPI Metrics, Data Visualization
Customer Journey | with Control Panel
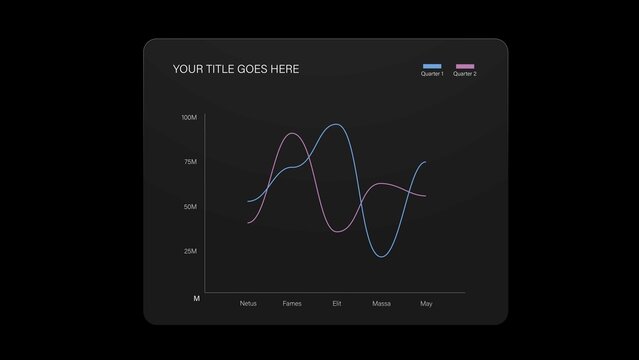
Line Chart Infographic Video Template
5 Infographics Elements
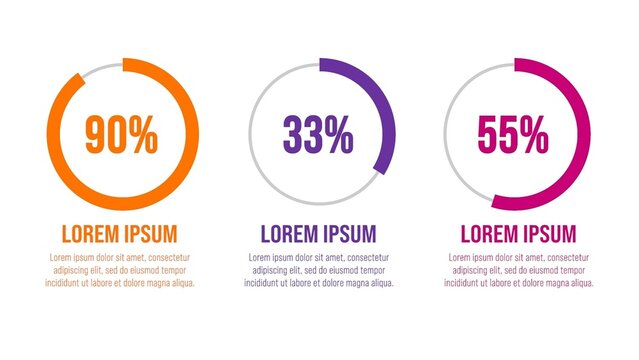
Modern Pie Style Circle Graph Chart With Percentages and Details Infographic
Annual Report Layout
Presentation Business Circle Infographic
Business Project Progress and Strategy Infographic Template with Minimal Illustration
Admin Dashboard Template Layout
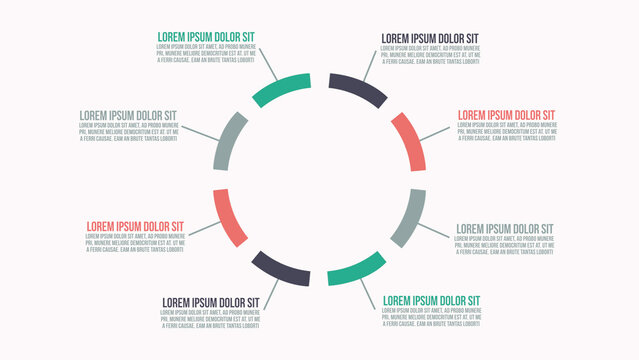
Infographic Animations
Modern Financial Dashboard UI Template
Business Financial Annual Report Presentation Template With Blue Accents
Minimalist Green Global World Data Analysis Infographic Template
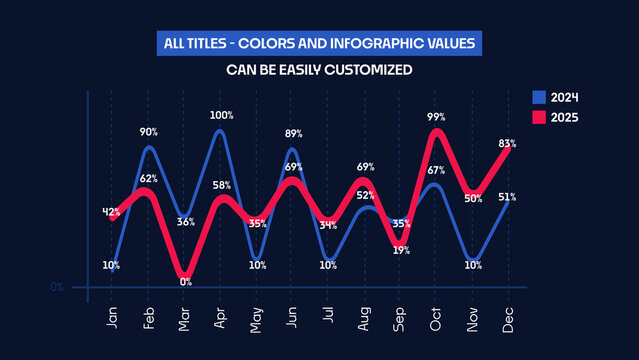
Animated Infographics Comparison Chart | Dynamic Line Graph for Business Finance and Marketing Data Visualization

HUD Neon Maps World Map x6
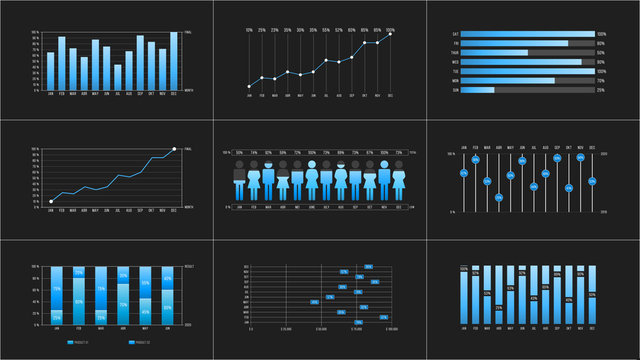
Infographic Charts
Business Performance Dashboard Infographic Template
Gradient Green And Blue Executive Annual Report
Admin Dashboard UI Kit Template
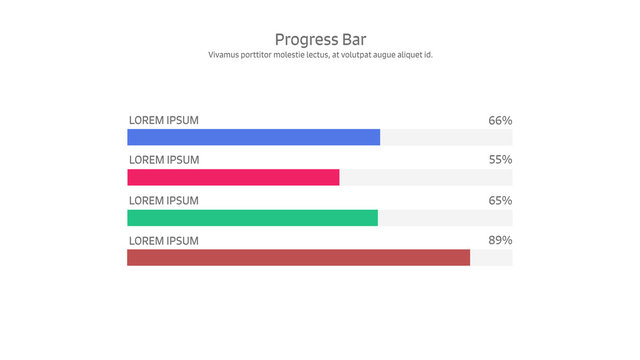
Progress Bar Infographic
AI Artificial Intelligence Presentation Template for Robotics Cybersecurity, Tech Startup Pitch Deck
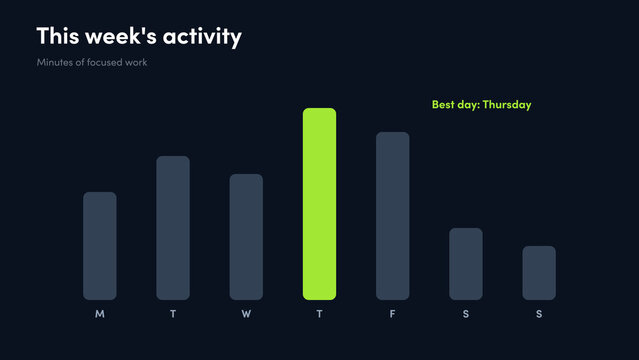
Infographic Weekly Activity - Professional weekly activity bar chart infographic animation with editable day bars and a highlighted best day for fitness, focus and habits
Infographic Set
Business Financial Annual Report Presentation Template Slides

Rising Profit Line Graph Sales Growth Infographic
Vector icon elements in pastel circle multipurpose Infographic template
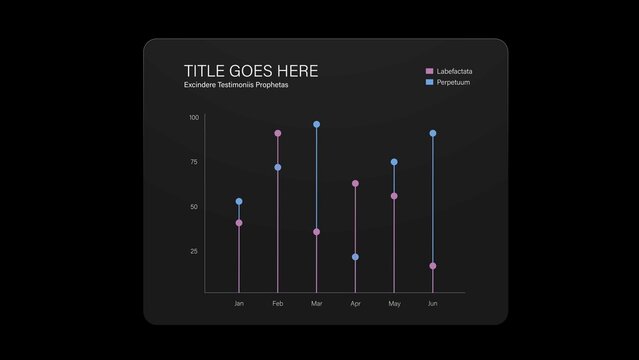
Line Chart Infographic Video Template
Design process Infographics TEmplate with 5 Steps Minimal Illustration
Modern Admin Dashboard Template Layout
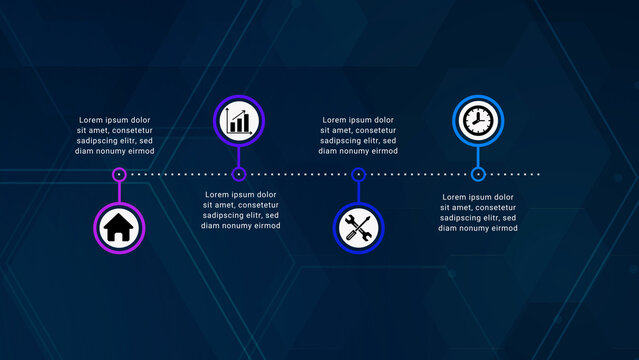
Infographics 08
Annual Report Presentation
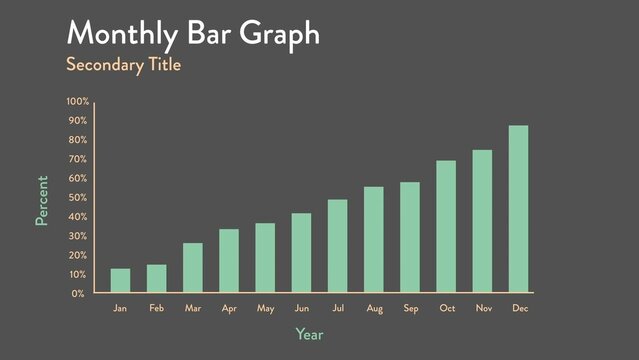
Monthly Bar Graph Infographic
Infographic Layout Set with Blue and Green Elements

Modern Infographics Elements | Data Visualization & Business Presentation
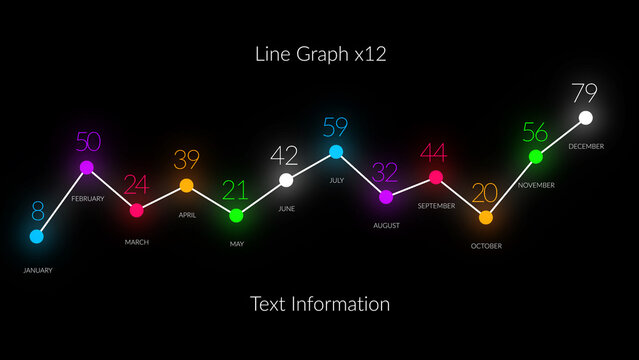
HUD Neon Infographics Line Graph x12
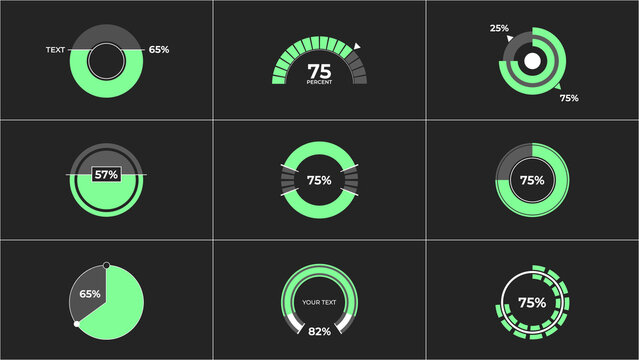
Circle Ring Infographic
Modern Company Annual Report Book Template for Financial Growth
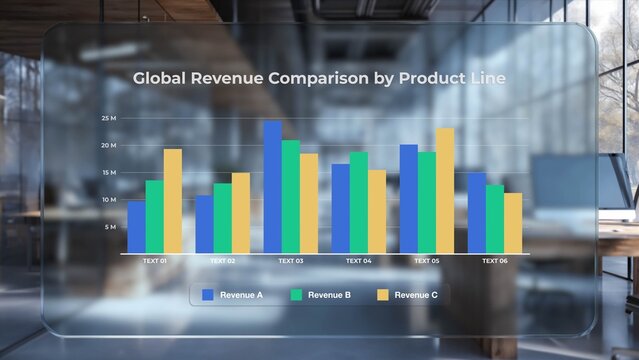
Modern Business Analytics Bar Graph Template
Website Admin Dashboard Design
Annual Report Layout