
Business Growth and Scalability Infographic Presentation Layout

Annual Report Brochure Template

Data Analytics and Business Growth Chart Icon Set

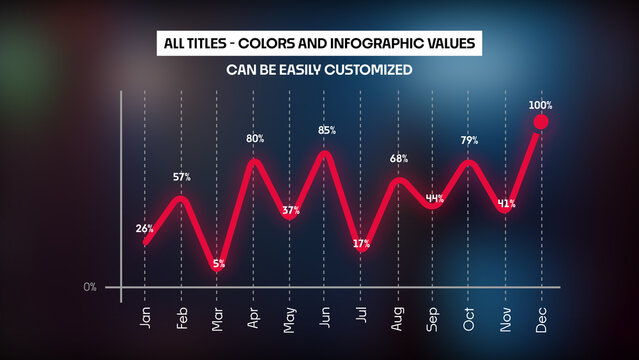
Line Graph Chart Infographic for Time Series in Business Presentation Layouts

Business Project Steps Infographic Template with Scaling Illustration

Green And Black Invoice Letterhead For Green Living Concept Real Estate

Business White Paper Brochure Template Corporate Report Design

Annual Report Presentation
8 Infographics Elements

Colorful Circular Infographic Template with Six Numbered Steps

Annual Report Template
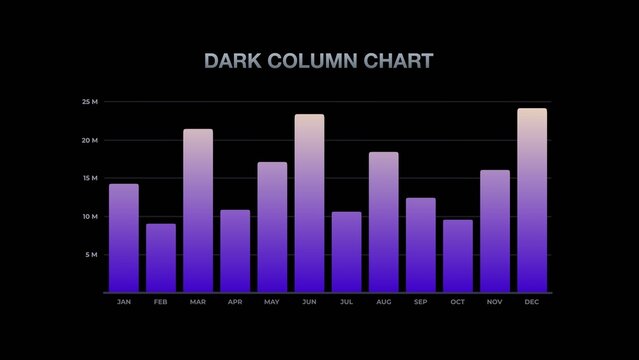
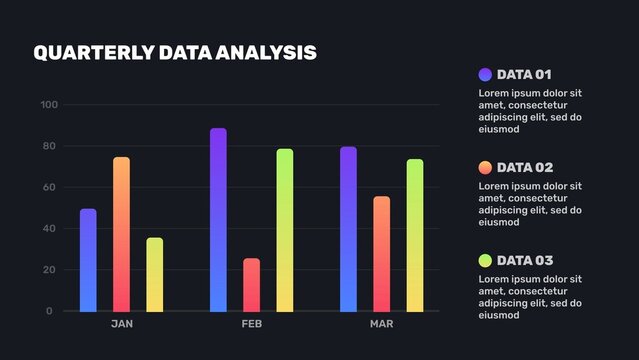
Modern Gradient Dark Column Chart
Data Driven Design Professional Graph Solutions

Mobile Finance App Mockup on Handheld Smartphone

Annual Report Template Design

Annual Report Template Layout

Blue and Orange Research Data Analysis Report Chart Illustrations Set

Annual Report Layout

Daily Time Use Infographic

Hand Holding Smartphone Mockup With Graph PSD

Business Funnel Infographic Template for Modern Corporate Marketing and Sales Process Diagram Design

Company Profile Landscape Template

Business Intelligence and Audience Targeting Vector Icons Set

Histogram Graph Infographic Template in Modern Minimal Style

Business Projection Infographic Template with Candle Graph Illustration

Editable Business Infographic Elements Template with Colorful Pyramid Charts, Bar Graphs, Line Diagrams and Data Visualization Timeline.
White Paper Template With Modern Corporate Business Report Layout
Annual Report Presentation
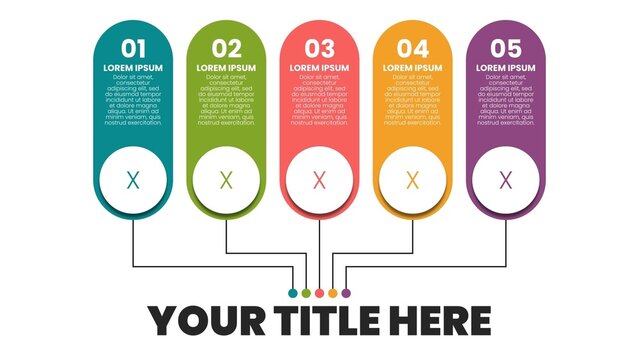
5 Infographics Elements
Annual Infographic Timeline Template with Gradient Wave Line
Modern AI Dashboard UI Wireframe Design with Analytics Panels and Data Visualization Layout
Data Analytics Bar Graph
3 Bar Gradient Graph Data Analysis Infographic
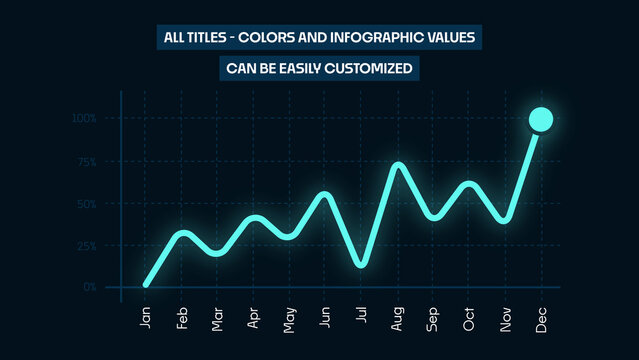
Animated Line Chart Infographics | Business Data Visualization and Analytics Graph
Infographic Design Template Layout
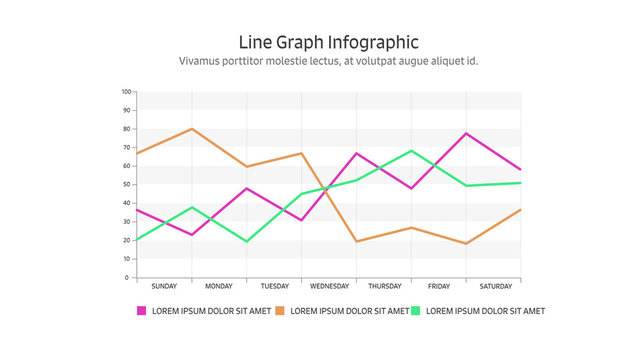
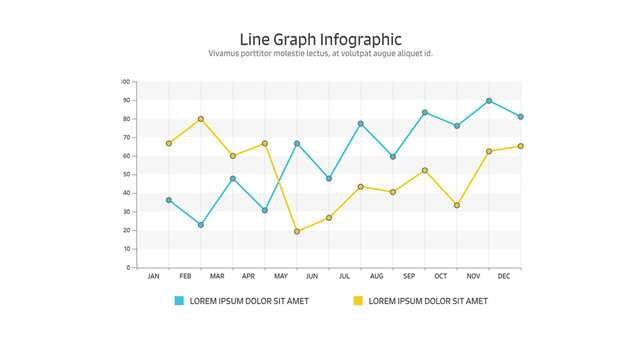
Line Graph Infographic
Benchmarking Illustration Set
Annual Report Layout
Data Analytics Black and White Outline Style Icons Set
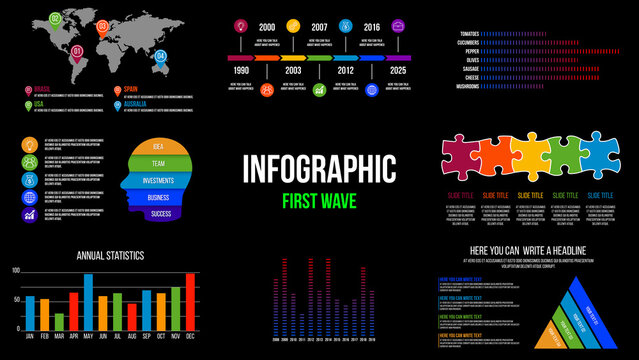
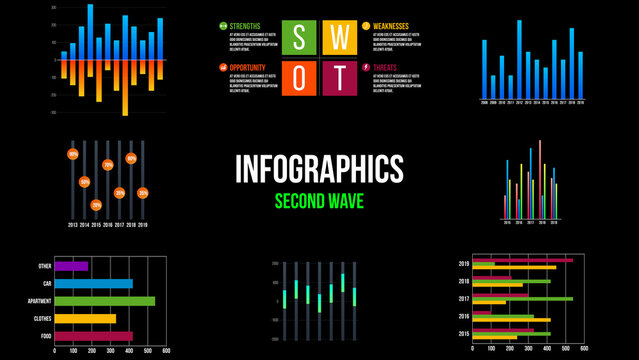
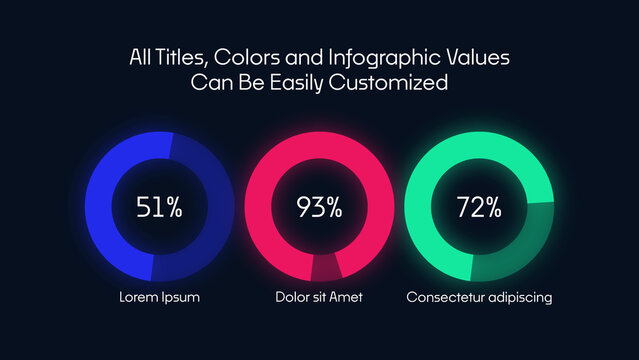
Dark-themed Infographic with Purple Accents
Annual Financial Report Brochure Layout
Annual Report Layout
Modern Business Plan Presentation Template with Purple Gradient Accents
Business Analysis Presentation Template, Corporate Report Pitch Deck & Company Profile Analytics
Business Strategy Horizontal Timeline Infographic Template with Colorful Stripes
Business Growth Conceptual 3D Infographic Layout
Business White Paper Brochure Template Corporate Report Design
Case Study Template
8 Infographics Elements
Business Infographic Template in Question Mark Shape with Photo Placeholders
Business Fact Sheet Layout
Financial Data Infographics Layout Template
Comprehensive Modern Data Graphics Suite
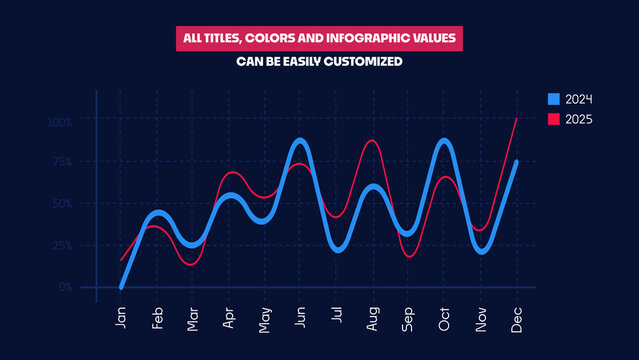
Corporate Infographics | Animated Line Charts Business Data Trends and Yearly Performance Analytics for Reports and Presentations
Swot Analysis Infographic Layout with Hexagon Elements
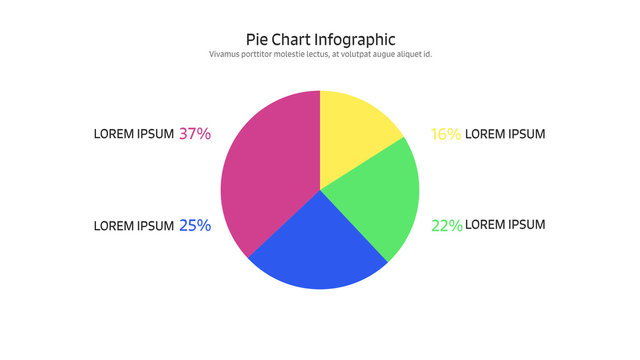
Pie Chart Infographic
Dark Modern Business Data Presentation Infographic Template
Business Sales Dashboard Design
Blue And Black Data Analytics Proposal
Widget Style Infographic
Annual Report Layout
Annual Report Brochure Landscape Template
Business Financial Annual Report Presentation Template Slides
Business Analysis Presentation Template, Corporate Report Deck, SWOT Strategy Pitch Slides
Report Cover Template with Graph Growth Illustration
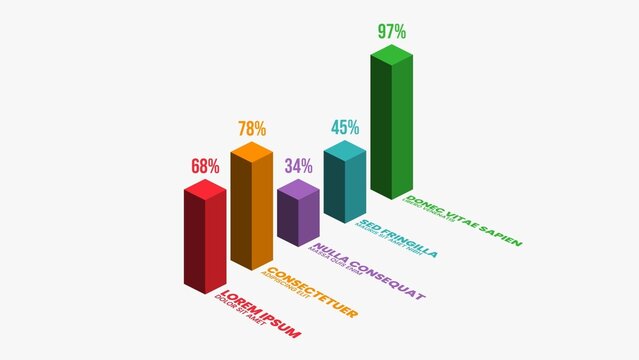
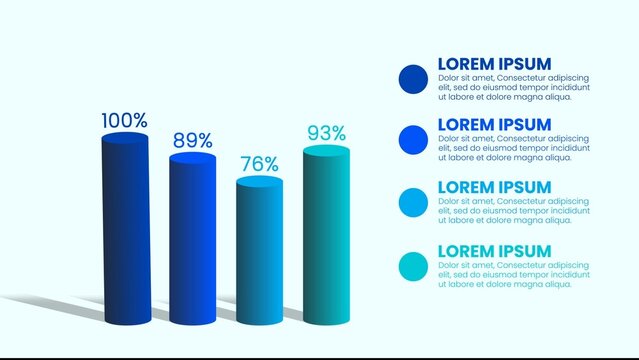
3D Colorful Bar Graph Infographic Layout
KPI Dashboard Presentation Layout
Company Fact Sheet Template
Data Analysis Concept Based Landing Page with Financial Infographic Report, Bar Graph and Analysts Maintain Data
Modern Vertical Infographic Timeline Template with Colorful Milestones
Corporate Annual Report Template
Business Investment Brochure Layout
Dynamic Data Modern Infographic Elements
Corporate Infographics | Statistics, Reports & Data Visualization Elements
SWOT Analysis Layout with White Arrows and Big Lettering
Flow Chart Infographic
Minimalist Green Global World Data Analysis Infographic Template
Data Analytics Management Dashboard
SWOT Infographic with Colorful Accents
Blue And Brown Data Analytics Proposal
Business Financial Annual Report Presentation Template With Blue Accents
Annual Report Template
Minimalist Business Pitch Deck Presentation Template
Donut Doughnut Chart Infographic Template
Business Pie Chart Infographic Template with Minimal Illustration
Banners with Arrows Infographic Layout
Finance Infographic Layout
Financial Data Overview
企業のビジネスインフォグラフィックレイアウト
BEZPŁATNIE
Business Infographic Template with Five Steps and Colorful Arrows
Corporate Case Study Design Template
インフォグラフィック要素セット
BEZPŁATNIE
Dynamic Comparison Data Visualiser Graph
Animated Corporate Infographic Diagrams
Vector set of analytics and investment line web icons. Each icon with adjustable strokes neatly designed on pixel perfect 64X64 size grid. Fully editable and easy to use.
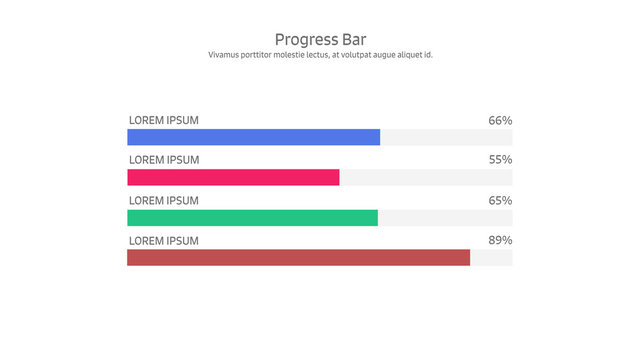
Progress Bar Infographic
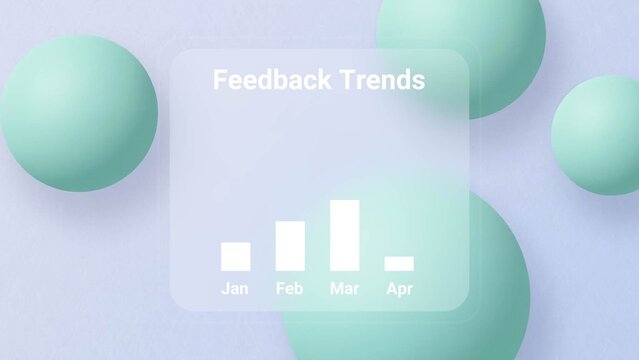
Modern Green Data Visualization Business Infographic Template
Cyber Security Threat Analysis Dashboard UI Kit
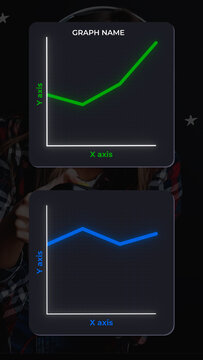
Mini Line Graph For Data Analytics And Trends Forecast
Gradient Green And Black Performance Report