パスワード設定用のリンクを に送信しました。今後は、購入画面にアクセスする際にパスワードが必要になります。
無料体験で 10 点のストック画像を入手
新しいフィルターが追加されました
並べ替え

すべて 内の oscillogram の検索結果 740 件

動画で 327 件の検索結果
Seamless looping animation oscillogram sine waves
00:10
HD
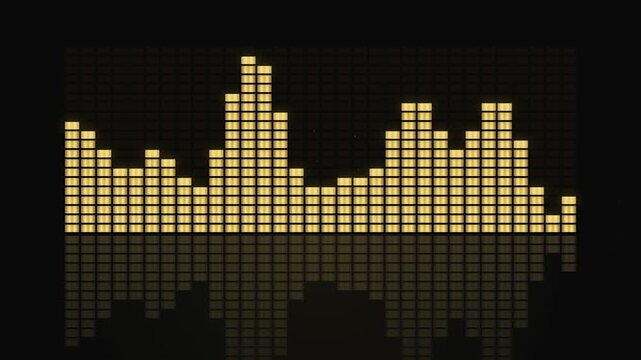
Pulsating Golden Audio Spectrogram Bars Reflecting Dynamic Sound Frequency Levels on Black Surface 4k video
00:06
HD
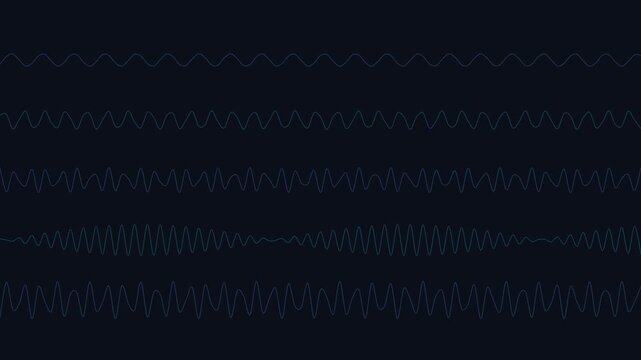
Layered Frequency Sound Wave Oscillograms On Dark Background
00:10
HD
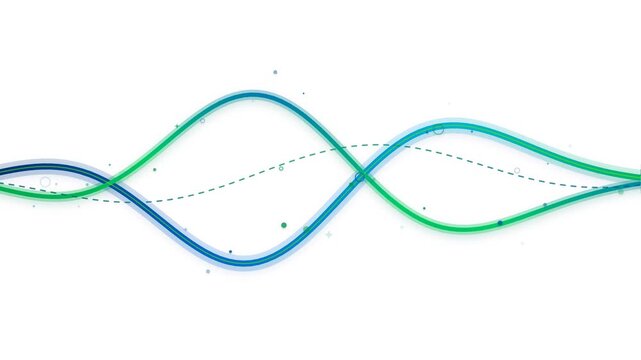
Abstract sound wave graphic illustration with glowing blue and green sinusoidal lines intersecting against a clean white background
00:08
HD
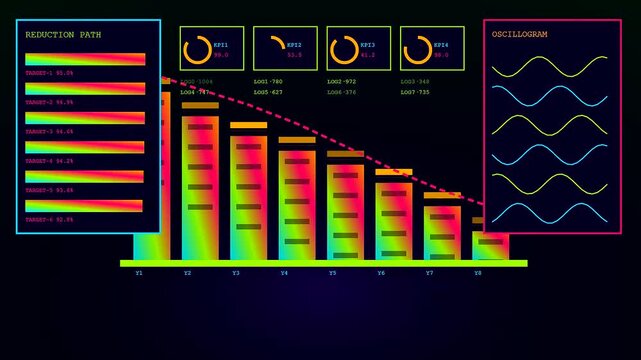
A glowing emissions tracker dashboard displays digital bars and wave patterns in a dark environment with neon data visualizations showing environmental performance metrics and statistical trends
00:06
HD
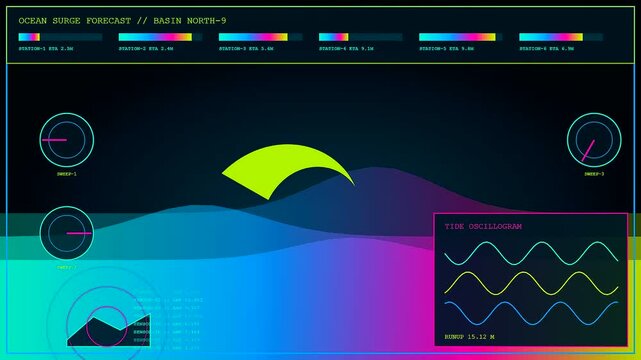
Catastrophe mapping dashboard display showing fluctuating digital ocean waves with moving colorful gradient peaks and cyclical tide graphs for monitoring shifting water level data points daily
00:06
HD
Glowing green heart pulse EKG line animation on a dark background representing vital signs and medical monitoring.
00:08
HD
Audio hit starting wave pulsing, glowing blobs and spikes forming for audio feedback on transparent
00:10
HD
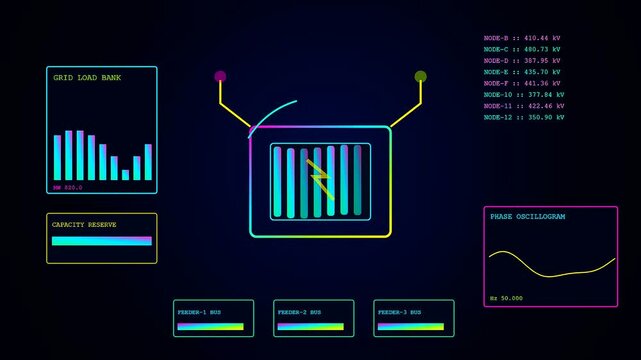
Digital displays showing power telemetry data with animated electrical grid energy flow metrics and fluctuating sensor readings captured in a sleek modern interface graphical dashboard view
00:06
HD
Blue Digital Audio Waveform Pulse on Black Background
00:12
HD
Oscilloscope Waveform Progress Sequence Showing Sound Signal Visualization
00:15
HD
Industrial kinetic harvesting systems display numerical data streams and conveyor belt activity on a dark digital dashboard interface for automated manufacturing and monitoring flow logistics
00:06
HD
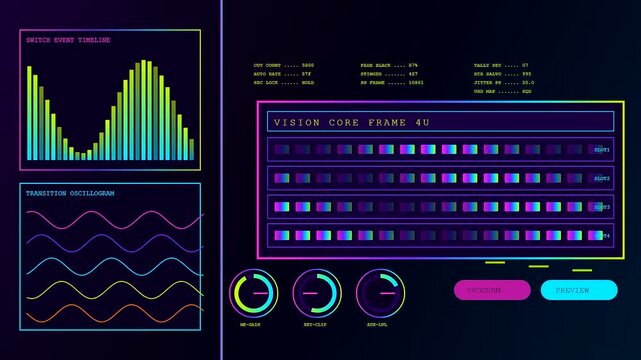
A broadcast switcher digital interface displays changing waveform patterns and active signal levels while glowing in neon blue and purple light during a production process
00:06
HD
Display of modern digital oscilloscope with graphics
00:07
HD
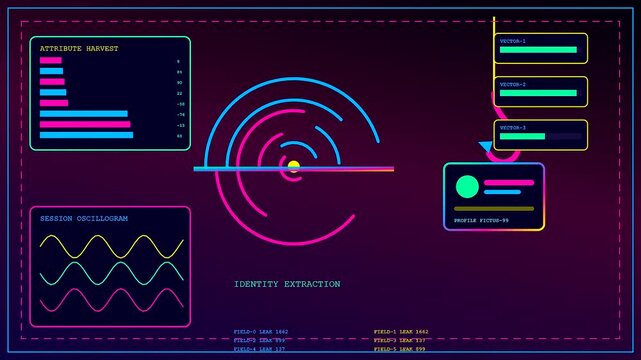
A digital phishing alert display features pulsing neon circles and rhythmic wave patterns with shifting graph bars as data metrics flow across a dark purple screen
00:06
HD
Sound wave oscillogram on the screen
00:21
HD
Retro Oscilloscope Screen Displaying A Green Signal Wave And Grid Lines In A Laboratory Setting
00:05
HD
Seamless looping animation oscillogram sine waves
00:06
HD
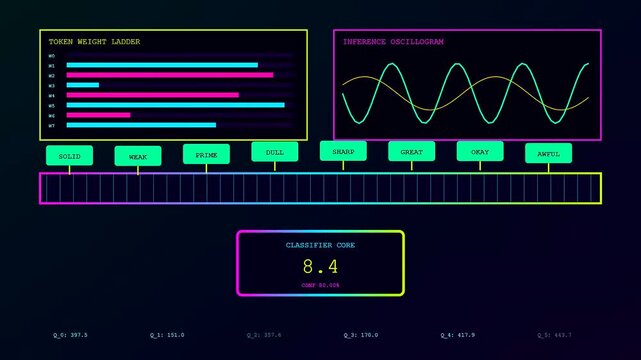
Displaying sentiment analytics visuals on a dark screen featuring fluctuating waves of data and numeric metrics for observing complex digital patterns of fluctuating values
00:06
HD
A digital broadcast switcher interface showing dynamic light bars and wave oscillation patterns on a dark screen used for live media production and monitoring tasks
00:06
HD
Digital oscilloscope and male hand turns tumblers for setting
00:13
HD
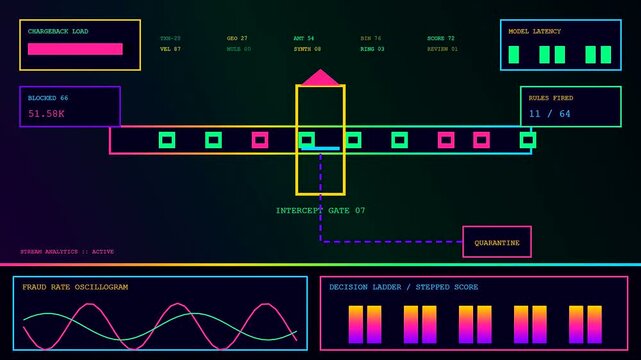
Digital ai fraud detection systems monitor data streams in this graphical interface featuring pulsing neon elements moving across a dark screen to analyze complex information patterns
00:06
HD
On data pulse dark panel rotating, waveform lines growing and overlapping to show neural analysis
00:12
HD
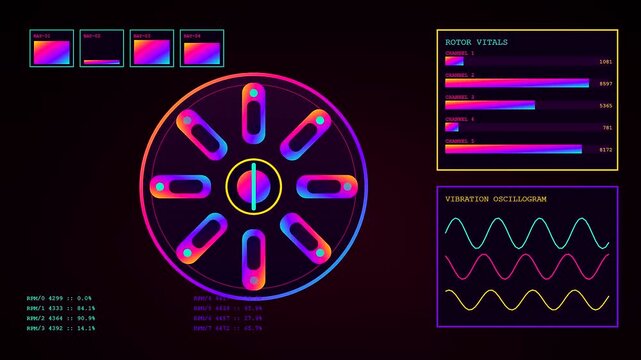
A virtual lab interface showing mechanical circular rotor status monitors with colorful graphs and waveform patterns displayed on a dark glowing electronic digital display panel grid
00:06
HD
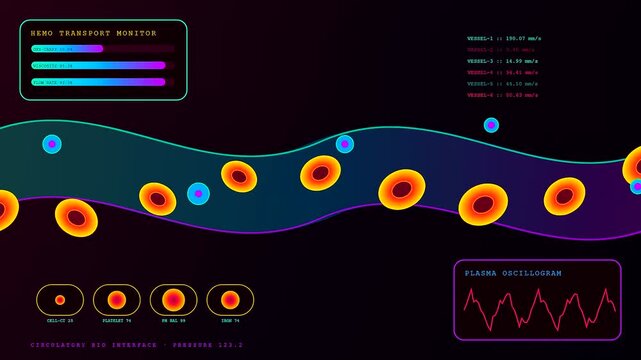
the digital bio interface shows flowing red blood cells moving through a vein while glowing data monitors track oxygen levels and velocity for medical research
00:06
HD
Abstract Neon Glowing Sound Wave Motion Graphics Loop
00:30
HD
Digital oscilloscope and male hand pushes buttons for setting
00:07
HD
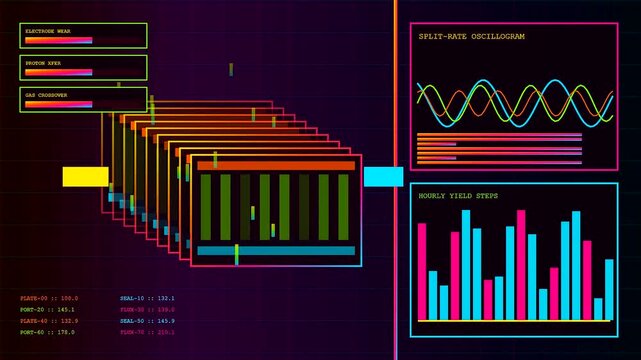
a modern hydrogen electrolysis system interface visual showing fluctuating wave patterns and bar graphs with vibrant neon data charts captured on a dark digital monitor
00:06
HD
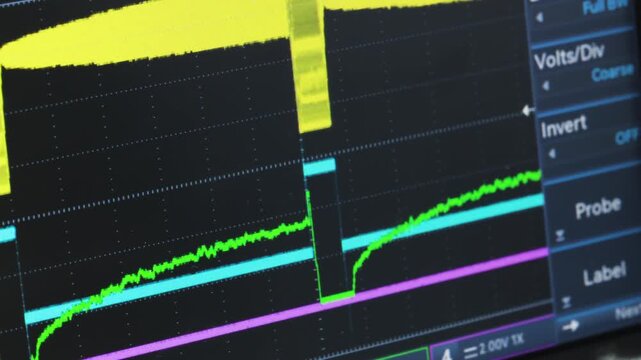
A detailed close-up zooms out from a digital oscilloscope screen, revealing the yellow waveform of an electrical signal. Concept of electronic engineering, data analysis, and diagnostic technology.
00:12
HD
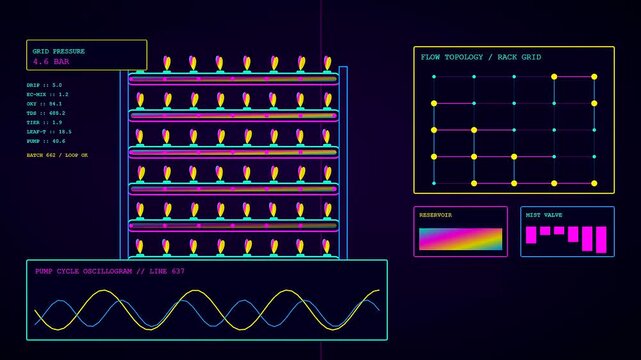
Digital displays showing vertical agritech monitoring systems with complex data nodes and flow topologies on dark screens depicting automated indoor farming cycles for future food production
00:06
HD
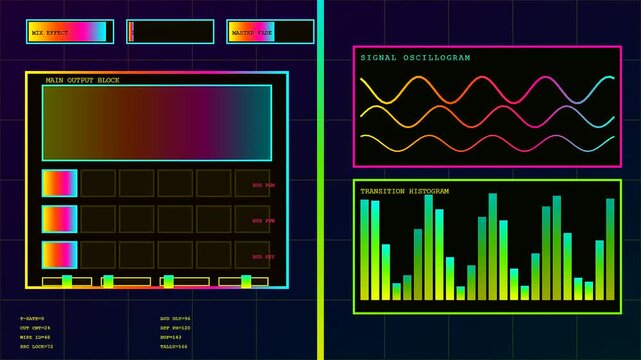
A digital broadcast switcher interface displays vibrant waveform oscillograms and frequency spectrum graphs across six distinct panels to monitor audio levels and visual signal processing streams
00:06
HD
An animated white audio waveform pulses and fluctuates against a solid black background.
00:10
HD
Electrical waveforms of measured digital signal. Oscillogram of output signal. Radio measurements of high frequency currents.
00:11
HD
Digital oscillogram on the monitor. Electronic industry
00:12
HD