パスワード設定用のリンクを に送信しました。今後は、購入画面にアクセスする際にパスワードが必要になります。
無料体験で 10 点のストック画像を入手
新しいフィルターが追加されました
並べ替え

すべて 内の chart data graph hud ui の検索結果 15,063 件
動画で 5,191 件の検索結果
Advanced artificial intelligence data analytics dashboard interface displaying animated graphs and statistics in digital motion footage loop
00:08
HD
Dashboard animation displays financial market data with a downward arrow on dark. Business revenue downturn analytics track on dashboard. Consoles monitor dashboard.
00:21
HD
Glowing financial bar chart growth and trend line graph visualizing business success data analytics
00:10
HD
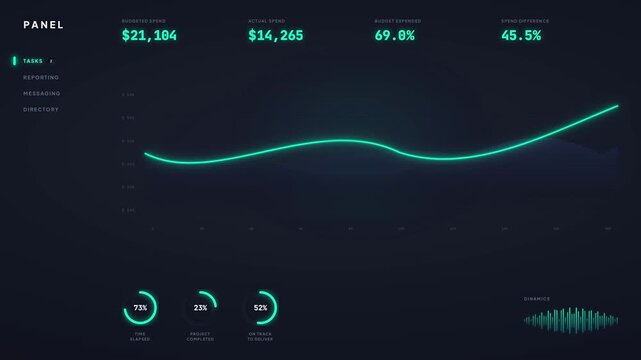
Animated financial dashboard ui with real-time data analytics
00:13
HD
UI dashboard interface animation with financial data graphs and charts loading
00:15
HD
Digital dashboard interface with financial data charts line graph and statistics display
00:08
HD
Financial growth data chart futuristic glowing blue hud ui business analytics stock market presentation
00:08
HD
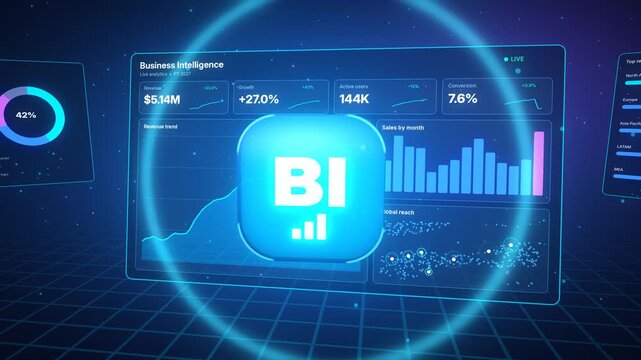
3D glowing BI icon button over virtual business intelligence dashboard with charts and KPI, futuristic data analytics hologram concept 4K
00:08
HD
Futuristic UI interface with graphs and data visualization
00:06
HD
Digital financial growth chart hud animation, rising business analytics graph with data ui
00:10
HD
Futuristic data dashboard interface with neon glowing charts and graphs
00:20
HD
Futuristic dashboard displaying business data analytics and financial growth charts
00:10
HD
Futuristic hud ui dashboard with animated graphs, progress bars, and data analytics interface
00:16
HD
Futuristic digital user interface animation featuring glowing blue data charts and graphs in motion video clip
00:08
HD
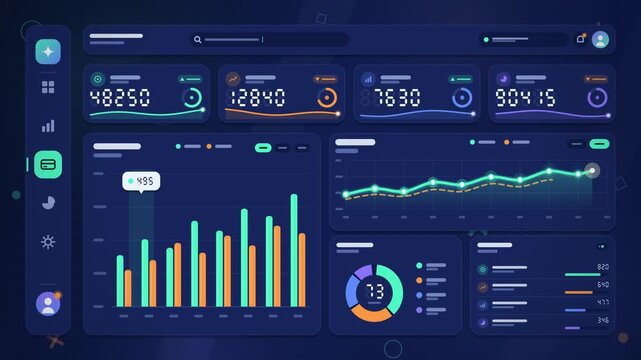
Animated data dashboard ui with dynamic charts and graphs
00:11
HD
Cyan digital data dashboard UI chart graph animation loop
00:10
HD
Cyan and pink hud dashboard technology background  animation for scifi user interface design. It features modern neon glowing data charts. Ideal for high tech video overlays.
00:32
HD
Business growth performance metric bar chart and line graph futuristic cyan neon hud ui interface corporate data visualization finance analytics presentation
00:08
HD
Futuristic neon hud interface displaying animated data charts for technological dashboard.
00:10
HD
Digital analytics dashboard interface displaying business performance data and charts with glowing nodes and metric panels against a dark technological background
00:05
HD
Digital financial growth chart with upward trend line and data analytics hud interface graph business
00:10
HD
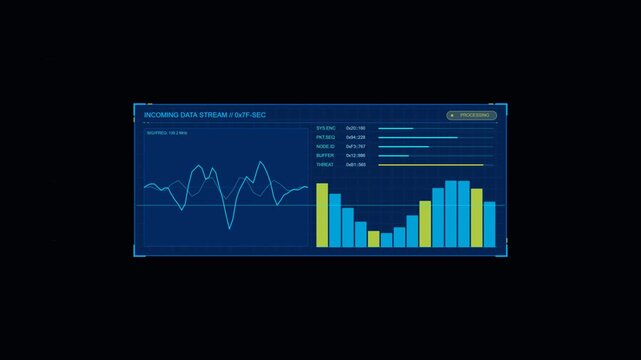
Incoming data stream analytics dashboard with charts and graphs
00:06
HD
Futuristic HUD data visualization dashboard animation, glowing blue financial growth chart interface, modern digital analytics infographics display.
00:10
HD
Futuristic HUD interface elements with rings, graphs and bars on black, seamless loop
00:10
HD
Animated business data dashboard with charts on dark background
00:05
HD
Perspective side view of clean grayscale digital interface tracking KPI speed meter, data bar charts, and customer ratings.
00:11
HD
AI data analytics grid perspective dashboard monitoring blue user growth statistics, calendar schedules, and pie graphs in 9:16.
00:11
HD
Futuristic data analysis graphs and charts with progress indicators on dark background.
00:15
HD
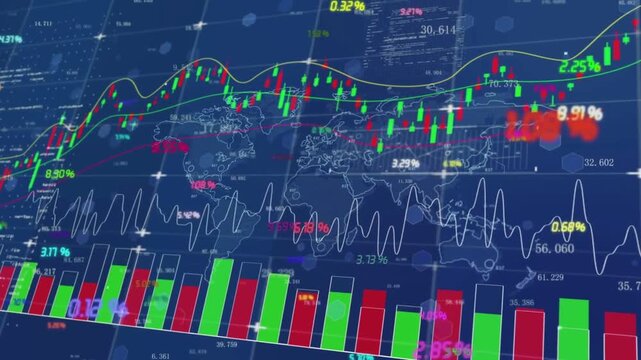
Digital financial market data analytics with stock charts, graphs, and world map
00:10
HD
Digital blue bar charts showing data metrics on dark background
00:15
HD
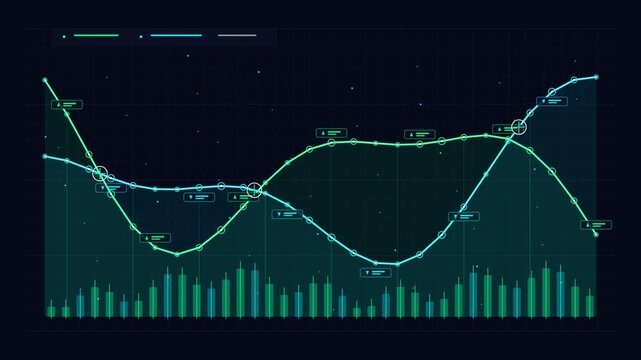
Financial candlestick chart with glowing trend lines and data growth animation trading stock market graph
00:10
HD
Digital hud interface with animated data charts and circular network scanning elements
00:10
HD
Abstract scientific data visualization with glowing graph curve on digital screen.
00:10
HD
Business data dashboard with financial charts and growth graphs for market analytics.
00:10
HD
Futuristic financial market analytics graph with glowing neon lines and candlestick charts for trading
00:15
HD
Digital financial growth chart with rising line graph and data analytics hud interface business
00:10
HD
Futuristic hud interface with data processing, network nodes, and analytics graphs on dark background
00:16
HD
Futuristic Cyber HUD Dashboard with Dynamic Line Charts and Data Analytics
00:10
HD
Amber retro sci-fi cockpit HUD with rings, graphs and bars, seamless loop
00:10
HD
Futuristic digital interface with glowing data charts and graphs in a dark environment
00:08
HD
Digital candlestick charts displaying financial market trends with glowing green and red indicators on a dark background with future
00:10
HD
Quantum data core system interface with glowing blue digital charts and graphs
00:08
HD
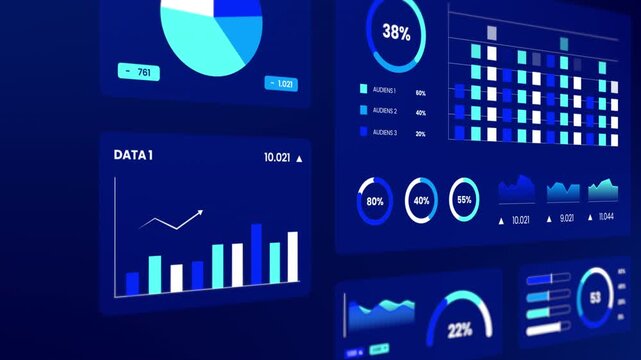
Business analytics dashboard data metrics HUD showing close up angled view of blue bar charts, pie graphs, and audience statistics.
00:11
HD
Set of animated digital data visualization charts on white
00:10
HD
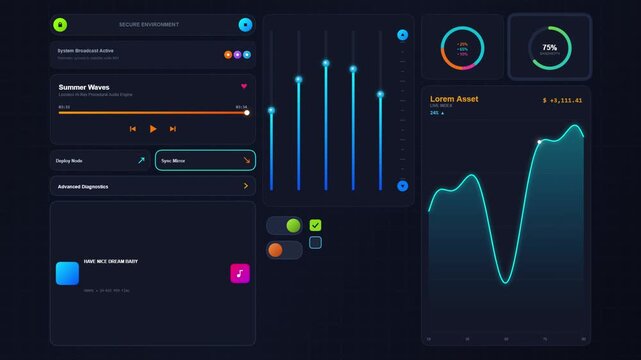
Futuristic dashboard interface with glowing charts and music player in dark ui style.
00:10
HD
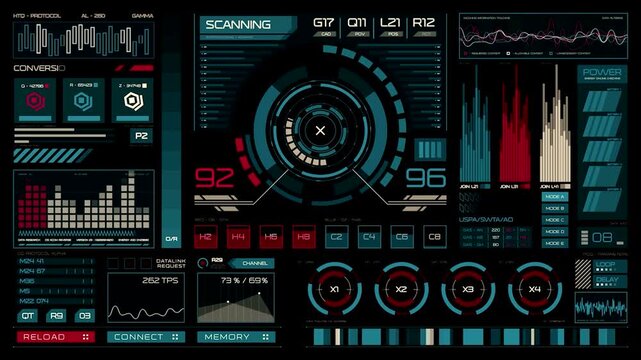
Futuristic hud interface with data charts, scanning circles, and digital information displays for scifi technology, gaming, and hightech ui design elements
00:13
HD
Financial growth chart animation: rising stock market trend and digital data analytics hud interface
00:10
HD
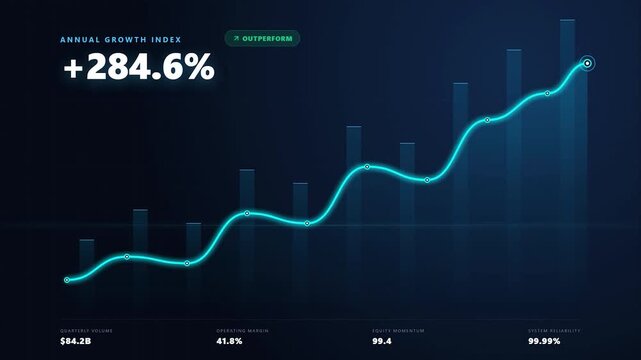
Growth chart rising line graph with percentage data futuristic hud digital infographic ui style financial presentation data visualization business analysis dashboard
00:08
HD
Digital green financial graph showing stock market analytics and growth index data on black background for tech display.
00:10
HD
Animated wavy line graph with red data point marker on black background, chart visualization animation
00:10
HD
Digital data dashboard with neon blue progress rings and charts
00:10
HD
Futuristic KPI business dashboard with animated bar charts, gauge, donut graphs and data numbers on dark background
00:20
HD
Advanced futuristic head up display interface showing network telemetry data charts and software processing codes.
00:10
HD
Abstract futuristic user interface with financial trading charts and data graphs.
00:10
HD
Futuristic data dashboard displaying growth charts and statistics
00:05
HD
Modern financial dashboard interface with charts and analytics data on a transparent background
00:08
HD
Futuristic digital core analytics engine dashboard with HUD interface and colorful data charts
00:15
HD
Business growth graph icon rotates within hud circle on black background dynamic footage.
00:05
HD
Complex High Density UI Dashboard Stock Market Macro Grid Seamless Loop 4K
00:10
HD
growing chart animation with financial data bars and glowing line
00:06
HD
Digital financial growth chart animation: rising bar graph with hud interface for business analytics and data visualization
00:10
HD
A repeating abstract dashboard background with rows of colorful bar charts and graphs. Modern high tech data visualization for presentations, seamless loop.
00:15
HD