作品投稿
料金プラン
パスワード設定用のリンクを
に送信しました。今後は、購入画面にアクセスする際にパスワードが必要になります。
すべて
画像
ビデオ
オーディオ
テンプレート
3D
無料素材
プレミアム
類似を検索:
シリーズ:
モデル:
ドキュメント:
マイライブラリ
類似を検索.
画像をここにドラッグ
または
ファイルを参照
画像をアップロード中...
制限なく作成可能 — 無制限のダウンロードと、強力な AI 編集機能
ストック素材を無制限に入手
制限なく作成可能 — 無制限のダウンロードと、強力な AI 編集機能
ストック素材を無制限に入手
フィルターを非表示
フィルターを表示
新しいフィルターが追加されました
並べ替え
ビデオ 内の
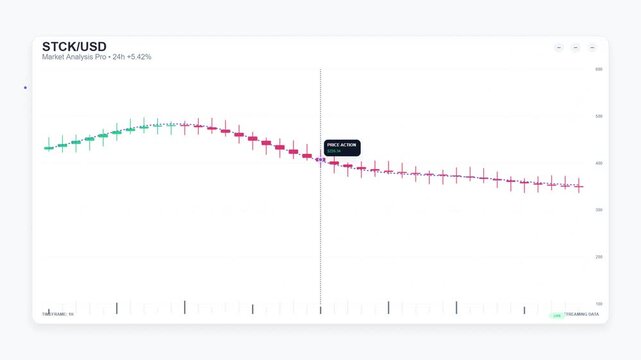
quantitative
の検索結果 1,566 件
00:12
4K
HD
00:06
4K
HD
00:29
4K
HD
00:05
4K
HD
00:05
4K
HD
00:20
4K
HD
00:09
4K
HD
00:10
4K
HD
00:20
4K
HD
00:10
4K
HD
00:05
4K
HD
00:05
4K
HD
00:10
4K
HD
00:20
4K
HD
00:10
4K
HD
00:10
4K
HD
00:07
4K
HD
00:10
4K
HD
00:10
4K
HD
00:05
4K
HD
00:15
4K
HD
00:06
4K
HD
00:05
4K
HD
00:08
4K
HD
00:05
4K
HD
00:20
4K
HD
00:08
4K
HD
00:08
4K
HD
00:06
4K
HD
00:06
4K
HD
00:05
4K
HD
00:12
4K
HD
00:10
4K
HD
00:10
4K
HD
00:05
4K
HD
00:08
4K
HD
00:15
4K
HD
00:10
4K
HD
00:10
4K
HD
00:08
4K
HD
00:10
4K
HD
00:06
4K
HD
00:08
4K
HD
00:08
4K
HD
00:05
4K
HD
00:05
4K
HD
00:08
4K
HD
00:15
4K
HD
00:10
4K
HD
00:05
4K
HD
00:10
4K
HD
00:05
4K
HD
00:14
4K
HD
00:08
4K
HD
00:06
4K
HD
00:10
4K
HD
00:10
4K
HD
00:10
4K
HD
00:10
4K
HD
00:05
4K
HD
00:10
4K
HD
00:05
4K
HD
00:14
4K
HD
00:10
4K
HD
00:05
4K
HD
00:06
4K
HD
00:10
4K
HD
00:15
4K
HD
00:05
4K
HD
00:05
4K
HD
00:08
4K
HD
00:05
4K
HD
00:05
4K
HD
00:10
4K
HD
00:06
4K
HD
00:10
4K
HD
00:10
4K
HD
00:10
4K
HD
00:10
4K
HD
00:20
4K
HD
00:15
4K
HD
00:08
4K
HD
00:05
4K
HD
00:25
4K
HD
00:05
4K
HD
00:05
4K
HD
00:05
4K
HD
00:20
4K
HD
00:14
4K
HD
00:10
4K
HD
00:08
4K
HD
00:05
4K
HD
00:10
4K
HD
00:10
4K
HD
00:20
4K
HD
00:16
4K
HD
00:12
4K
HD
00:20
4K
HD
00:15
4K
HD
00:20
4K
HD
OK
OK
OK
地域を選択してください
選択した地域によって、Adobe Stock Web サイトに表示される言語やプロモーションの内容が異なる場合があります。
北米
Canada - English
Canada - Français
El Salvador
México
República Dominicana
United States
南米
Argentina
Bahamas
Barbados
Bolivia
Brasil
Chile
Colombia
Costa Rica
Ecuador
Guatemala
Honduras
Jamaica
Nicaragua - English
Panamá
Paraguay
Perú
Trinidad and Tobago
Uruguay
Venezuela
欧州、中東、アフリカ
Algeria - English
Armenia - English
Azerbaijan - English
Bahrain - English
Belgium - English
Belgique - Français
België - Nederlands
Česká republika
Croatia - English
Cyprus - English
Danmark
Georgia - English
Deutschland
Eesti
Egypt - English
España
France
Greece - English
Iceland - English
Ireland
Israel - English
Italia
Jordan - English
Казахстан
Kenya - English
Kuwait - English
Киргизия
Latvija
Lebanon - English
Lietuva
Luxembourg - Deutsch
Luxembourg - English
Luxembourg - Français
Mauritius - English
Moldova - English
Hungary - English
Malta - English
Morocco - English
Nederland
Nigeria
Norge
Oman - English
Österreich
Россия
Polska
Portugal
Qatar - English
România
Saudi Arabia - English
Schweiz
Slovenija
Slovensko
Suisse
Suomi
Sverige
Svizzera
Таджикистан
Turkey - English
Turkmenistan - English
UAE - English
Україна
United Kingdom
Узбекистан
България
アジア太平洋
Australia
Indonesia - English
中國香港特別行政區
India
日本
한국
中華人民共和國澳門特別行政區
Malaysia - English
New Zealand
ไทย
Philippines
Singapore
Sri Lanka - English
台灣地區
Vietnam - English