パスワード設定用のリンクを に送信しました。今後は、購入画面にアクセスする際にパスワードが必要になります。
制限なく作成可能 — 無制限のダウンロードと、強力な AI 編集機能
新しいフィルターが追加されました
並べ替え

ビデオ 内の increase and decrease の検索結果 19,780 件

Glowing neon Abstract neon line  rising on graph with up - down  Sale Symbols.
00:10
HD
Bright neon colored up-left arrow icon animation on black background, bright neon line icon and up-down arrows. 4K animation
00:10
HD
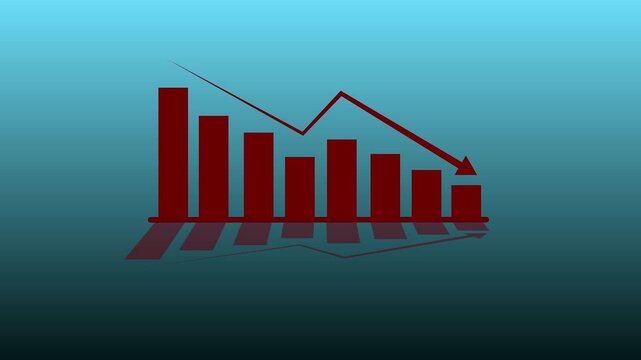
Business decline bar chart animation with falling line graph and shadow effects on transparent background. Indicate revenue decline, financial loss, negative growth
00:06
HD
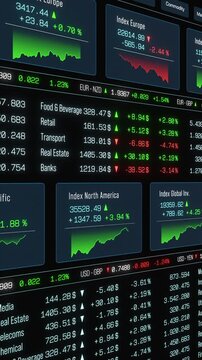
Trading screen Asia Pacific, North America index chart up, Europe index down, stock market data. Financial market, sector data, prices, trading volume, investment information.
00:10
HD
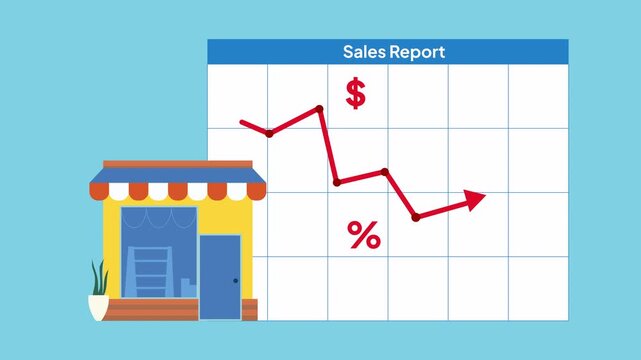
Animation of small business sales report showing a decreasing red arrow graph, decreasing purchasing power due to inflation, economic concept
00:15
HD
Up And Down Arrow Icon
00:10
HD
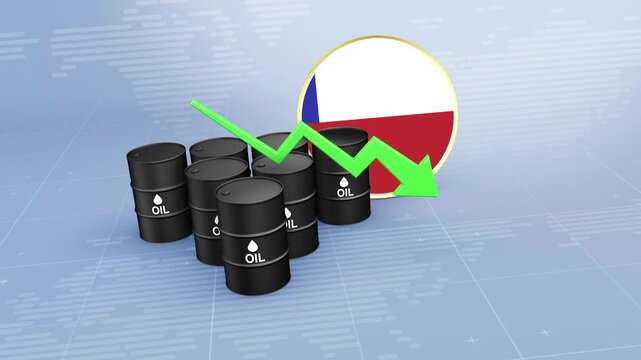
Chile Crude Oil Price Decline with Oil Barrels and Downward Green Arrow
00:11
HD
Three-word text animation featuring Find Something New with sequential word reveal, spacing reduction effect, and zoom transition in 3840x2160 format.
00:12
HD
Low risk indicator on white and green screen background
00:21
HD

A stock market chart with the Russian and American flags on either side, indicating crossroads in global economic trends between Russian and America.
00:10
HD
Glowing neon Percentage icon, quality control growth graph, and cost reduction animation with growth graph and cost reduction Percentage quality with up arrow, cost with down arrow.
00:10
HD
Business graph chart with down trend  arrow red color animation on black background.
00:05
HD
Policy level indicator scale. Low normal & high meter infographic animation on black background. Showing high policy level color gauge indicator for business governance and management analysis.
00:10
HD
Armenia Crude Oil Price Drop with Oil Barrels Downward Green Arrow and 3D Financial Data Visualization Graphs for Economy and Business Concept
00:11
HD
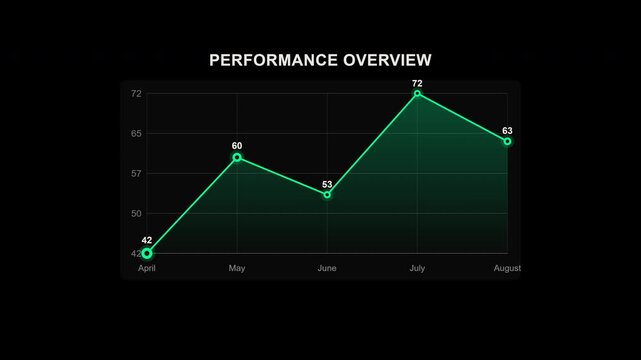
Performance overview chart displaying a green lines rise and fall. Suitable for financial reports, analysis websites, and business presentations.
00:10
HD
Glowing blue business bar chart with downward arrow and declining line curve. Symbolizing revenue drop, financial loss, negative growth, market downturn 4K
00:07
HD
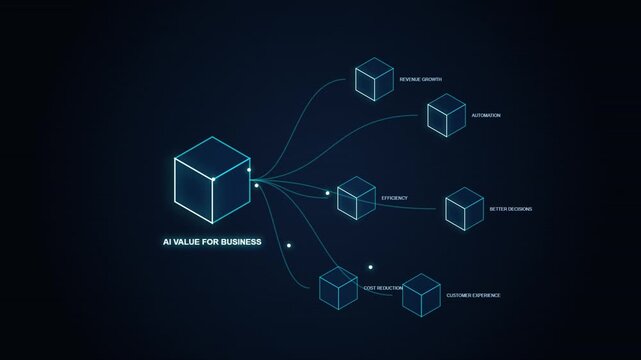
AI Value for Business diagram illustrating AI benefits such as automation, cost reduction, revenue growth, efficiency, customer experience - technology isometric infographics
00:10
HD
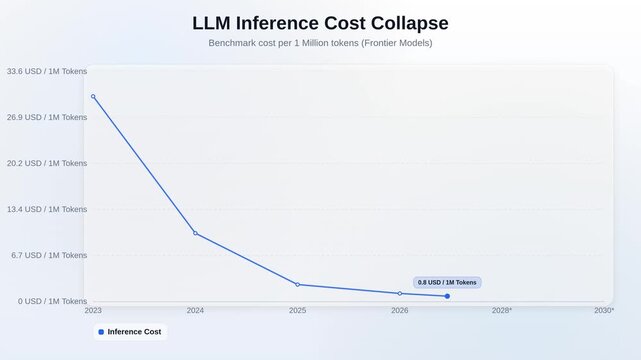
LLM Inference Cost Collapse Light Line Chart 4K Motion Graphic
00:10
HD
Declining bar chart with downward trend, Blue bar chart with falling line graph decline in business data, finance performance and analytics animation
00:07
HD
Brand Value Meter Animation: Track and Compare Brand Value from Low to High Levels with Dynamic Increasing/Decreasing Gauge for Data Visualization, Performance, and Motion Graphics
00:10
HD
Men turning off lamp / Slow motion
00:15
HD
Red Bar Chart with Glowing Dot and Grid on Black Background graph data. Digital image of red bar chart with highlighted glowing dot and grid for modern graph data visualization.
00:11
HD
Abstract 3D number 1991 text animation floating against a deep black void offering a vibrant and modern visual for the year with a sense of digital energy. 4k motion video.
00:10
HD
Digital interface big data analytics, futuristic information dashboard, data visualization, technology, AI, innovation. Technology background, Business Statistics, Market Data Infographics Layout
00:20
HD
Animated exchange money dollar sign encircled by looping arrows symbolizes currency exchange and global finance circulation.
00:06
HD
Profit, futuristic background with neon glow.
00:10
HD
Gambia Oil Prices Decline with Oil Barrels, Gold Coins and Downward Green Arrow, 3D Economic and Financial Market Concept
00:11
HD
Business chart illustrating improving quality and cost reduction with green upward and red downward arrows.Motion graphics of concept
00:07
HD
Money reduction icon. Dollar currency price drop concept. circle with down arrow moving animation.4k video
00:06
HD
Promoting Sustainability, Productivity, and Employee Wellbeing in a Corporate Environment through Green Plants. Concept Corporate Sustainability, Green Plants in Workspaces, Employee Wellbeing
00:05
HD
Applause for the general manager after some business results with growth. Concept: business, investment, improvement
00:23
HD
Two curved arrows pointing in opposite directions minimal animation
00:06
HD
Creative crash recession chart with falling red arrow.

00:10
HD
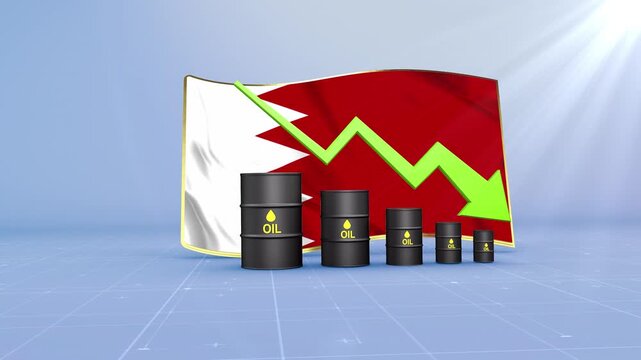
Bahrain Crude Oil Price Drop with Oil Barrels Downward Green Arrow and 3D Financial Data Visualization Graphs for Economy and Business Concept
00:11
HD
Business cost reduction strategy represented by a balance scale weighing income against diminishing expenses.
00:10
HD
Business leaders discuss implement environmental sustainability strategies net zero carbon goals corporate responsibility using ESG reports data at meeting
00:16
HD
Low battery reading initiating Eco charging showing battery filling then draining on rotating Earth
00:10
HD
The big heart of red squares increases and decreases, looped
00:06
HD
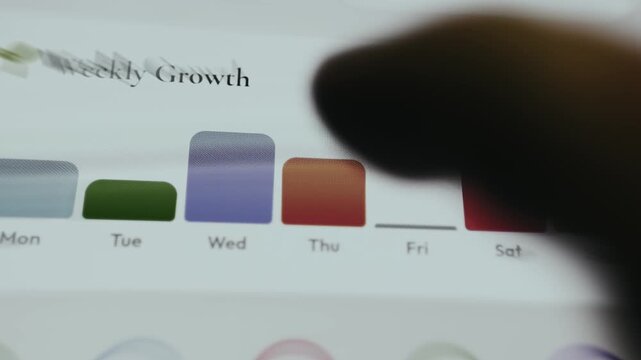
Bar chart titled Weekly Growth, tracking data from Monday through Sunday
00:14
HD
Animated Goal Achievement Gauge: Visualize Goal Completion from Low to High Levels with Dynamic Meter, Comparison Metrics, Performance Insights, and Motion Animation
00:10
HD
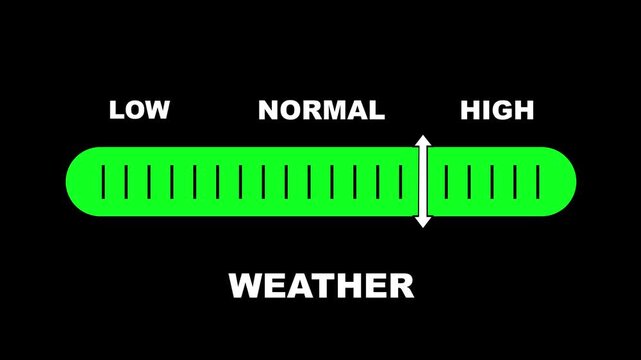
Weather condition level indicator scale. Low normal & high meter infographic animation on black background. Showing high weather condition level color gauge indicator for climate and atmospheric.
00:10
HD
Three-word text animation featuring Enjoy High Fidelity with sequential word reveal, spacing reduction effect, and zoom transition in 3840x2160 format.
00:12
HD
Neon costs reduction text icon glows, letters animate with downward pulse and flicker, modern finance tech style, dark background, clean loop, futuristic efficiency motion visuals.
00:10
HD
Red arrow with percentage symbol
00:06
HD
Carbon Capture and Storage Facility with Industrial Chimneys Emitting White Clouds Against Clear Blue Sky Over Green Field
00:18
HD
A carbon footprint sustainability green energy renewable eco friendly climate action environment recycling clean power business carbon cycle co2 reduction emission conservation technology innovation
00:10
HD
Haiti Oil Prices Decline with Oil Barrels, Gold Coins and Downward Green Arrow, 3D Economic and Financial Market Concept
00:11
HD
Business Growth Bar Chart Animation Increasing Graph Upward Trend Green Screen 4K
00:06
HD
dynamic brush stock profit arrow animation.

00:10
HD
Bright stock market chart with orange/blue candles on a black background

00:10
HD
Abstract decrease icon on black background. Ruble rate down looped icon. White reduce costs sign and symbol.
00:06
HD
Business graph chart with down trend  arrow red color animation on black background.
00:05
HD
Office icon. Web icon set. Office, great design for any purposes. Motion graphics.
00:14
HD
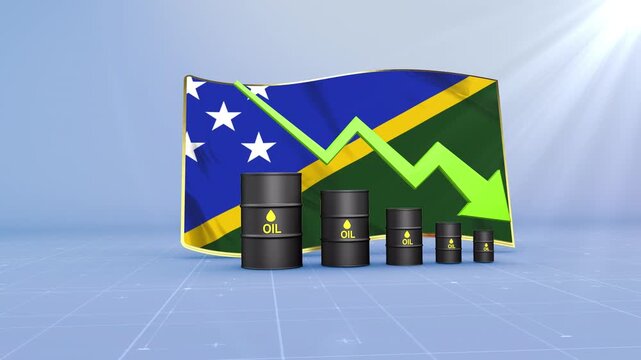
Solomon Islands Oil Price Falling with Oil Barrels Downward Green Arrow and 3D Financial Data Visualization Graphs for Economy and Business Concept
00:11
HD
Down arrow animation, Falling prices concept arrow animation.
00:06
HD
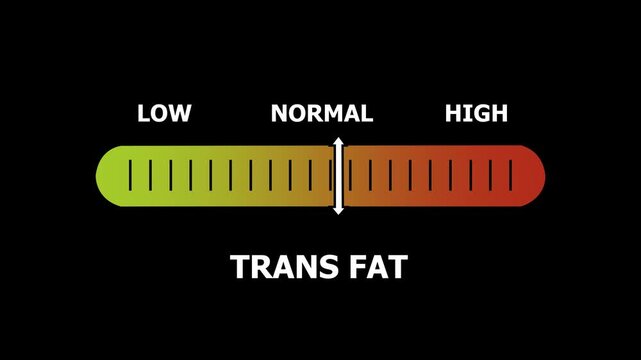
trans fat level indicator scale. Low normal & high meter infographic animation. Showing high trans fat level color gauge indicator. on a black background 4k animation video
00:10
HD
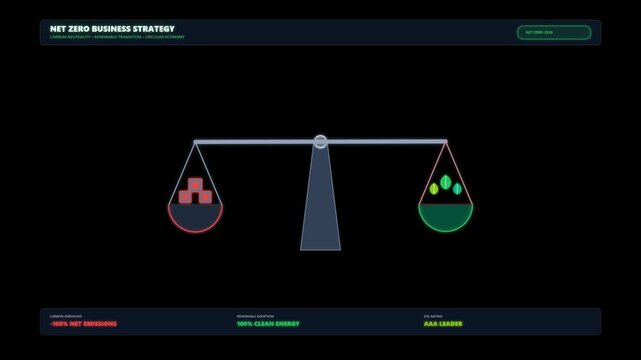
Net Zero Business Strategy Concept: Balancing Economy and Environment with Scales Animation
00:06
HD
Dental, face or kid in house with toothbrush, cavity prevention or oral care in child growth. POV, flare or girl in bathroom with tool, bacteria reduction or hygiene routine in childhood development.
00:10
HD
Interest Rates & Financial Savings: Percentage Symbol Business Deal, Loan, Investment, Growth & Discount Promotion
00:08
HD
Animated Security Status Meter.Measure Security Levels from Low to High with Dynamic Increasing and Decreasing Gauge, Ideal for Data Visualization, Performance Tracking, and Motion Animation
00:10
HD
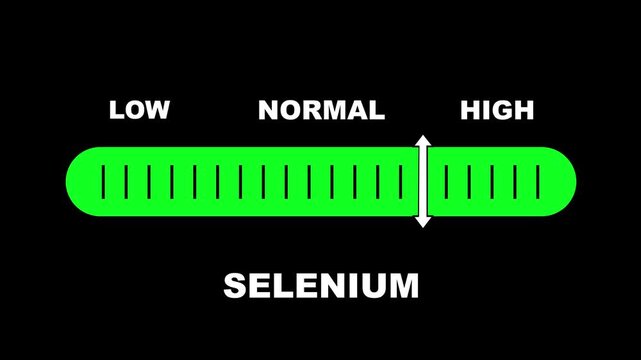
Selenium level indicator scale. Low normal & high meter infographic animation on black background. Showing high selenium level color gauge indicator for nutrition and antioxidant health monitoring.
00:10
HD
Cost reduction business finance concept on virtual screen. Business, technology concept.
00:07
HD
Down business arrow decline investment and trading loss economic recession video.
00:07
HD
Carbon sequestration digital animation showing tree growth reducing atmospheric emission levels for an environmental sustainability project motion graphics video clip
00:12
HD
Animated Bar Chart Data Growth Report Growth Statistics Analysis
00:06
HD
Circles decrease and increase in waves. 4k looped seamless abstract background. Gradient rainbow color on particles like paint bubbles or dye droplets in water in flat style. Luma matte 13
00:40
HD
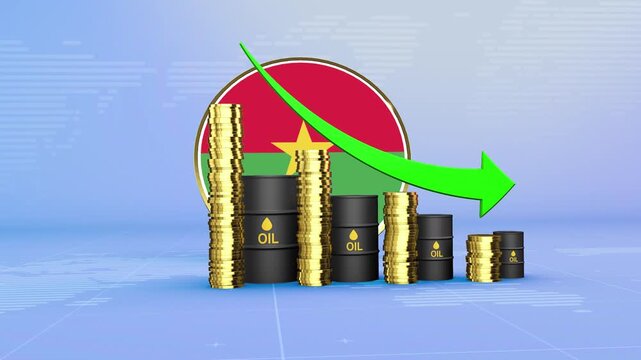
Burkina Faso Oil Prices Decline with Oil Barrels, Gold Coins and Downward Green Arrow, 3D Economic and Financial Market Concept
00:11
HD
Glowing quality and cost control concept on transparent background. Successful organization strategy and management quality control. Percentage icon of quality with up arrow and cost with down arrow
00:10
HD
Performance level indicator scale. Low normal & high meter infographic animation on bblackbackground. Showing high performance level color gauge indicator for business productivity efficiency and work
00:10
HD
In a modern office, a financial consultant in a blue suit gives colleagues practical legal and financial advice on boosting company promotion, increase in profits and cutting expenses.
00:09
HD
Market oversaturation concept illustrated by surging competition. Increasing product or service availability. And a corresponding decrease in demand
00:17
HD
Golden thirty percent discount emblem with blue rim on black background with subtle particles sale
00:07
HD
Japan economic bar chart graph showing decreasing downturn with national Flag 3D animation on black background.
00:16
HD
Algeria Crude Oil Price Drop with Oil Barrels Downward Green Arrow and 3D Financial Data Visualization Graphs for Economy and Business Concept
00:11
HD
Non-contact glucometer on the arm for quickly measuring blood glucose levels. Non-contact shoulder glucometer for diabetics. Device for diabetics. Increase or decrease in blood glucose.
00:16
HD
Colorful 3D bar chart showing a sharp downward trend indicating financial recession economic downturn and business decline with data visualization statistics
00:09
HD
Bad Economy Recession Graph Chart Animation 2d Animation with Alpha Matte
00:16
HD
A sign saying Save Now stands in a busy shopping mall. Shoppers walk past various stores. The promotions aim to attract customers and increase sales during the season
00:10
HD
Success trend animation with green arrow moving upward step by step, with video animation.
00:10
HD
Red price falling drop candlestick down trend new low chart decreasing trend showing unsuccessful performance and losses failure due to economic crisis loss of assets in equities stock
00:24
HD
Stamina level indicator scale. Low Normal High meter infographic animation on black background. Animation showing high stamina level color gauge indicator for fitness and endurance monitoring.
00:10
HD
Silver pen traces glowing blue electrocardiogram line across dark surface
00:07
HD
Graph Going down animation. Financial business Loss down graph chart. business loss concept. 4k video.
00:08
HD
Carbon offset credit price control report Future growth Net zero waste ESG clean energy office protect climate change social issue project Group asia people advice Eco friendly go green SDGs risk plan
00:17
HD
A collective effort showcased by hands reaching towards a cloud symbolizing carbon dioxide. The image represents unity in finding solutions for environmental sustainability and climate action. Raster
00:15
HD
Cost reduction business finance concept. Budget management and cost management. Optimization, Strategy, Economic cost savings. Financial analysis to reduce business costs.
00:10
HD
Cameroon Oil Prices Decline with Oil Barrels, Gold Coins and Downward Green Arrow, 3D Economic and Financial Market Concept
00:11
HD
Understanding the decrease of the yen and its impact on the economy
00:09
HD
A falling coin drops downward along dotted trails to indicate decline, caution, and financial slips where value decreases with gravity pulling resources lower
00:10
HD
Sustainable Business Growth: Exploring ESG Investing, Green Technology, and Corporate Social Responsibility for a Greener Future
00:08
HD
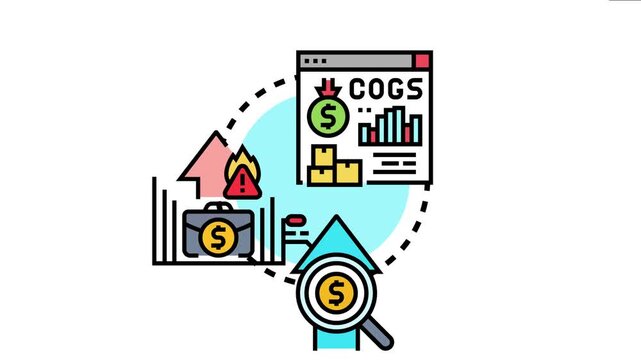
Business icons administrative expense tracking, cost of goods sold analysis, identifying financial risks, and magnifying opportunities for budget growth and optimization
00:17
HD
an image depicting the concept of co2 emissions. seamless looping overlay 4k virtual video animation background
00:18
HD
Direction arrow loading bar animation
00:12
HD
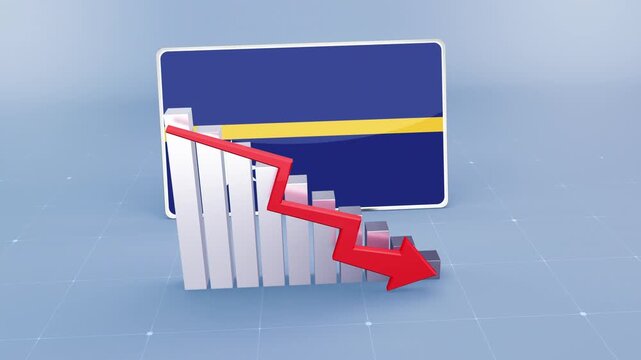
Nauru Country Flag and Bar Chart Graph Showing Decreasing Values a Red Arrow Economic Crisis Concept
00:11
HD
Tiles in the form of rounded squares impulsively increase and decrease, as if a mechanism is working.
00:07
HD
White color Down business graph icon animation on background. Bad Economy Recession Graph Chart.
00:06
HD
Canvas opening drifting stars scattering confetti swirling into vortex for shimmer effect
00:10
HD
Man plugging mobile phone charger into wall power outlet.
The man who plugs in the power plug charges his phone. Power saving or cost reduction concept.
00:18
HD
Carbon neutrality concept. increasing loading with carbon reduction for decrease CO2 or carbon neutral 2025 to 2050. Net zero greenhouse gas emissions target Climate neutrality long term strategy 2050
00:10
HD
Line stroke set of trading icons. graph going up and down with white arrows. concept of sales bar chart sign and symbol. 2d animated video. 4k size without background
00:04
HD