パスワード設定用のリンクを に送信しました。今後は、購入画面にアクセスする際にパスワードが必要になります。
制限なく作成可能 — 無制限のダウンロードと、強力な AI 編集機能
新しいフィルターが追加されました
並べ替え

ビデオ 内の increase and decrease の検索結果 19,780 件

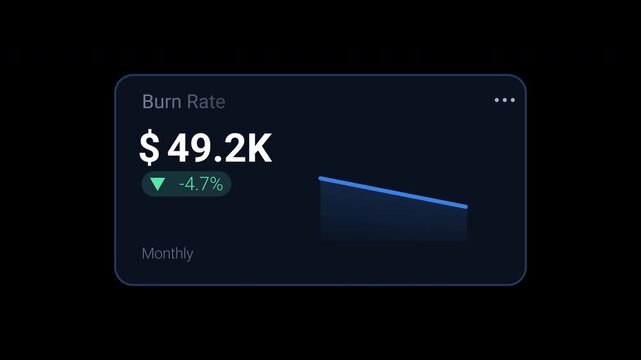
burn rate KPI dashboard card displaying monthly spending, decrease percentage and downward trend graph. Animated motion graphics component for startup finance, cash flow management, budgeting
00:10
HD
Futuristic dollar countdown timer animation, glowing dollar symbol integrated with a circular countdown display, numbers decreasing smoothly from 0 to 80
00:10
HD
Red neon arrow showing downward or decreasing market trend on black grid background. Futuristic glowing line graph indicating decline, negative growth, or decreasing analytics statistics concept.
00:06
HD
Red Percentage Symbols Falling Against a Dark Black Background discount sale
00:10
HD
Abstract glowing neon swipe arrow. 4k animation. Down to up neon line arrow direction animation. Neon line raising business arrow on black background.on black backgraund .HD video animation.
00:10
HD
the phrase Multiply Your Money in Spanish, animated word by word with spacing reduction and sharp zoom transitions, available in four background and outline versions.
00:12
HD
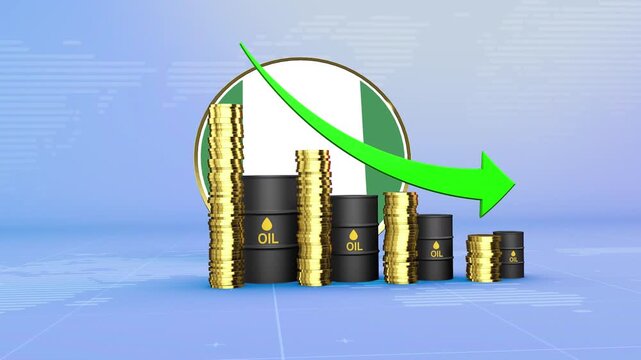
Nigeria Oil Prices Decline with Oil Barrels, Gold Coins and Downward Green Arrow, 3D Economic and Financial Market Concept
00:11
HD
Farmer checks green apple on tree surrounded by damaged foliage. Cobwebs and pests signal infestation in orchard. Lack of treatment leads to reduced yield under bright sunlight
00:27
HD
Zoom in and out animation the pie chart symbol. Large black symbol in the center and four small symbols around. Seamless looped 4k animation on white background
00:12
HD
 4K Ultra High Unemployed Workers Number US
00:30
HD
Currency fluctuation icon featuring money with upward and downward arrows. Visual representation of exchange rate movement and financial market changes.
00:10
HD
response level indicator scale. Low normal & high meter infographic animation. Showing high response level color gauge indicator. on a black background 4k animation video
00:10
HD
Exploring percentage symbols in various arrangements and movements
00:08
HD
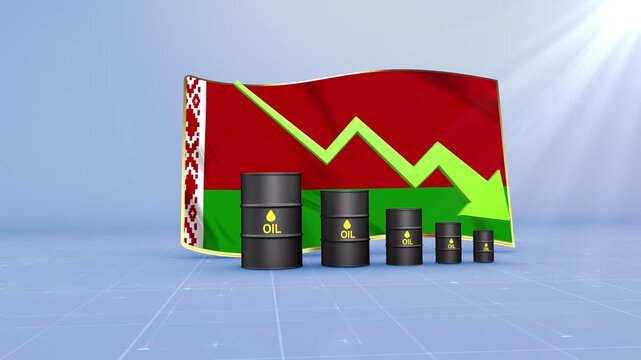
Belarus Crude Oil Price Drop with Oil Barrels Downward Green Arrow and 3D Financial Data Visualization Graphs for Economy and Business Concept
00:11
HD
Hands engage around a green globe symbolizing net zero commitment, highlighting sustainability, environmental responsibility, and collaborative efforts for a better future. Raster
00:20
HD
Thermometer Temperature Increase Decrease Animation Clinic Weather in 4k animation -5 degree temperature animation with alpha channel in transparent background
00:10
HD
Abstract bar chart graphic design fluctuating data visualization colorful bars modern infographic background white and blue gradient
00:10
HD
White hand drawn arrows for editing.
00:09
HD
Up and down arrow icon set, glowing neon upload download symbol on black background
00:10
HD
Digital bar chart lines compare market volatility trends using dual arrows. Financial analysis software modules look crisp across this grid monitor bar chart framework. Data charts update.
00:10
HD
Digital animated volume speaker icon with moving sound wave bars isolated on a chroma key green screen background for editing
00:08
HD
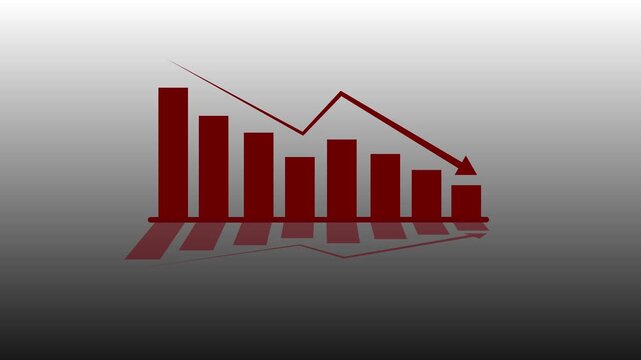
Red Downward Arrow and Bar Chart on Black Background Representing Decline
00:05
HD
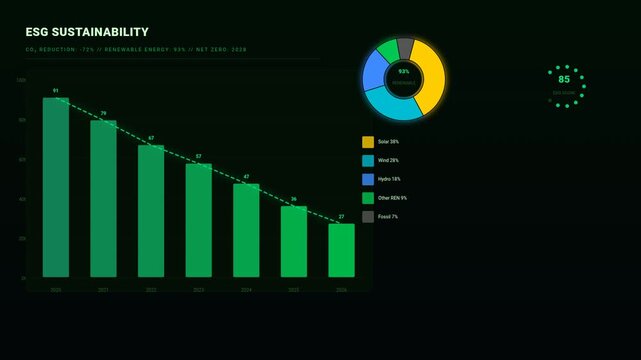
ESG Sustainability Dashboard Showing CO2 Reduction And Renewable Energy Metrics
00:15
HD
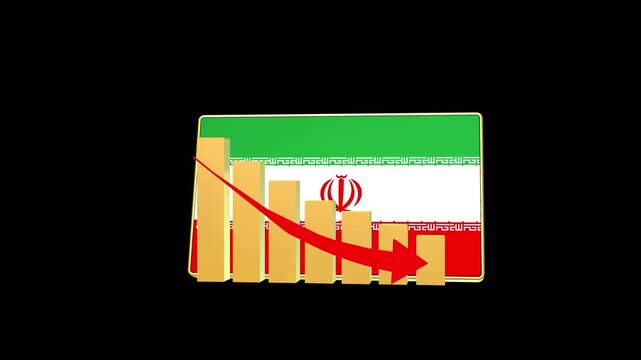
Iran economic bar chart graph showing decreasing downturn with national Flag 3D animation on black background.
00:16
HD
white business graph chart growth up down or signal on black background with alpha channel. Business up and down signal concept.
00:07
HD
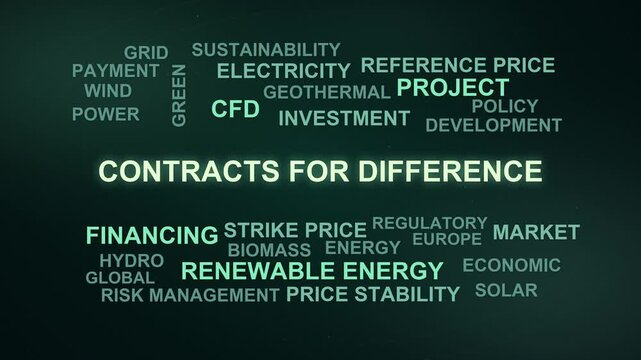
Contracts For Difference Word Cloud
00:09
HD
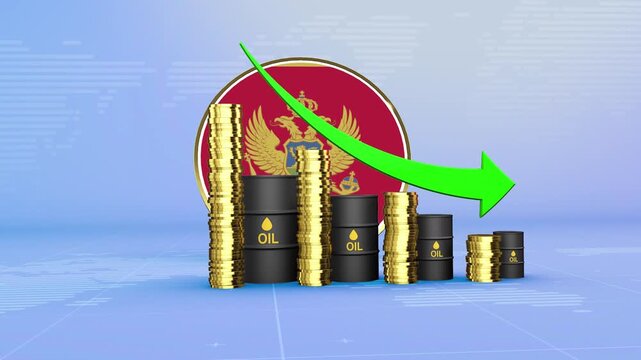
Montenegro Oil Prices Decline with Oil Barrels, Gold Coins and Downward Green Arrow, 3D Economic and Financial Market Concept
00:11
HD
Pricing discount controls concept a digital strategy for managing promotions, coupons, and sales, optimizing financial adjustments for products and services
00:17
HD
Percentage Progress Bar Loading Concept, Digital Data Flow, Financial Growth, UI Element
00:10
HD
budget planning icon and Business structure of network, financial forecasting tools, expense optimization strategies, cost reduction methods, investment management solutions
00:10
HD
Hand holding earth and ESG icon for Environment Social and Governance to Sustainable environment concept. ethical business and esg strategy for investing
00:09
HD
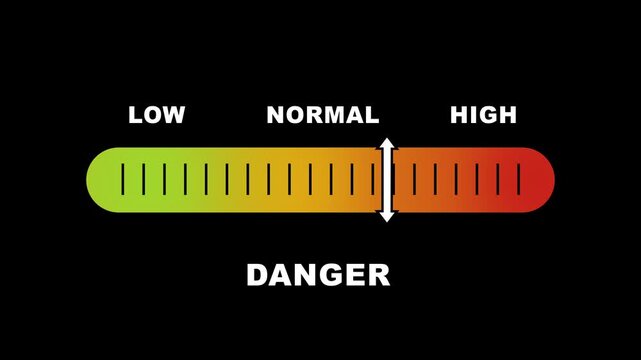
Danger level indicator scale. Low Normal High meter infographic animation on black background. Animation showing high danger level color gauge indicator for safety and risk monitoring
00:10
HD
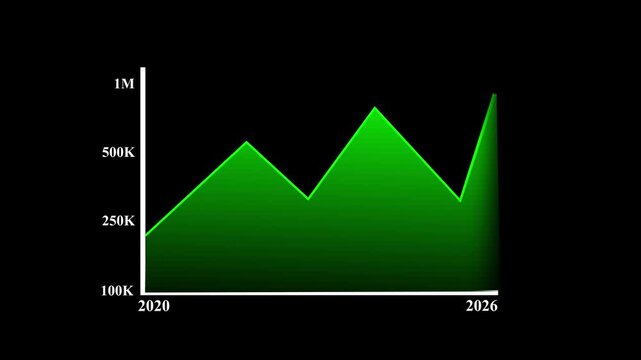
Green chart rises and falls over a four year period
00:08
HD
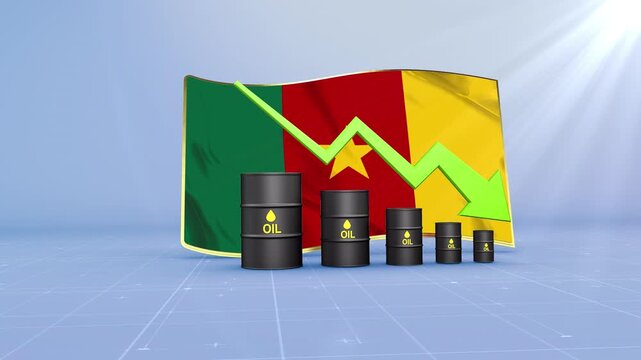
Cameroon Crude Oil Price Drop with Oil Barrels Downward Green Arrow and 3D Financial Data Visualization Graphs for Economy and Business Concept
00:11
HD
Financial dashboard animation showing a downward trend with graphs and charts, indicating a stock market crash, economic recession, business failure, and financial crisis on a futuristic interface
00:10
HD
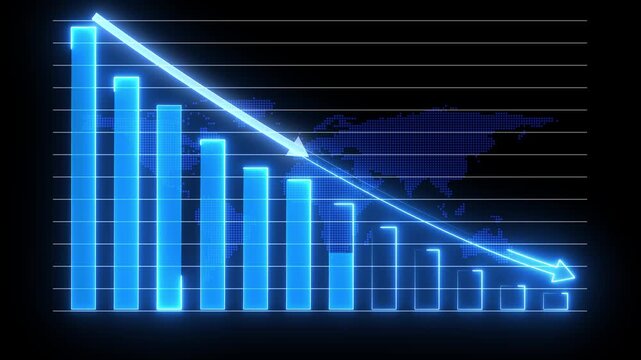
Animation showing downward blue arrow over bar graph indicating financial decline
00:14
HD
Renewable energy expanding across patchwork fields and countryside landscape. Wind turbines producing sustainable electricity for modern power infrastructure. Clean technology supporting carbon
00:12
HD
Glowing blue neon continuous line forming up and down arrows isolated on black background, perfect for finance, trade, and data exchange concept.
00:10
HD
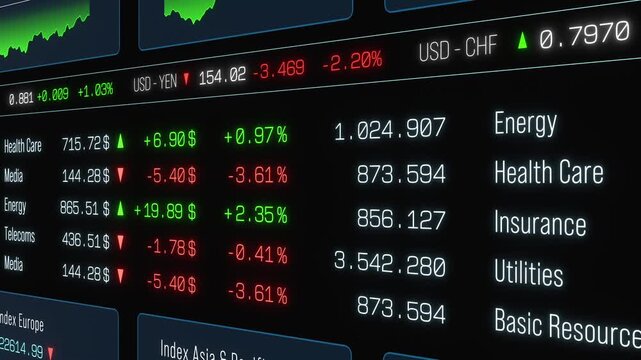
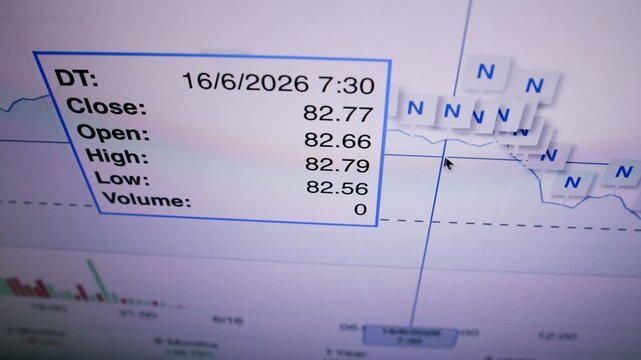
Stock market sector data, trading board, prices and changes, up and down. Financial market, sector data, prices, trading volume, investment information.
00:10
HD
Outline bar chart animation reveals downward falling fiscal columns. Financial economic loss reflects across the outline bar chart. Negative corporate investment data marks the bar chart.
00:12
HD
Churn Rate Percentage Decrease Animation on Green Screen Background.
00:06
HD
Radiation level indicator scale. Low normal & high meter infographic animation on black background. Showing high radiation level color gauge indicator for environmental and safety monitoring.
00:10
HD
Cryptocurrency trading. Bitcoin stock graphic. Bitcoin mining and Finance banking management concept, oil and Money trading, Digital trade platform. Profit and loss graph. Online trading
00:13
HD
Zoom in and out animation the four arrows symbol. Large black symbol in the center and four small symbols around. Seamless looped 4k animation on white background
00:12
HD
Two curved arrows pointing in opposite directions minimal animation
00:06
HD
Community Impact Word Cloud
00:11
HD
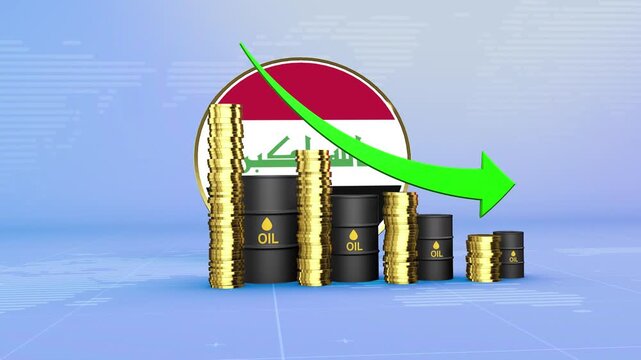
Iraq Oil Prices Decline with Oil Barrels, Gold Coins and Downward Green Arrow, 3D Economic and Financial Market Concept
00:11
HD
Business concept customer loyalty, client acquisition, and analytics of leaving customers, showing customer lifecycle management and marketing strategy for improvement
00:17
HD
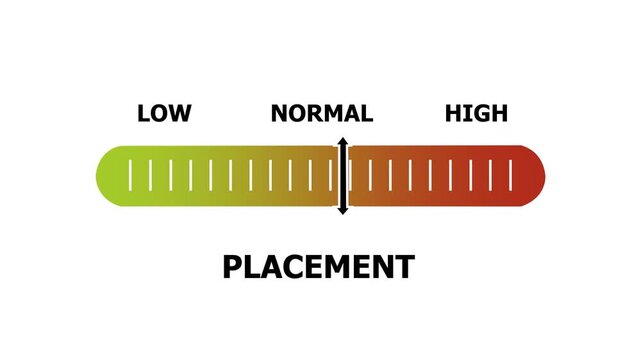
placement level indicator scale. Low normal & high meter infographic animation. Showing high placement level color gauge indicator. on a white background 4k animation video
00:10
HD
Bright white 3D number 2023 text animation floating against a deep black void offering a vibrant and modern visual for the year with a sense of digital energy.
00:10
HD
Neon green dollar coin stack with downward arrow animation for financial growth and savings concepts
00:10
HD
Success level indicator scale. Low normal & high meter infographic animation on black background. Showing high success level color gauge indicator for goal achievement and performance monitoring.
00:10
HD
White dashed line graph with dots on black background chart data
00:10
HD
Senegal Oil Price Falling with Oil Barrels Downward Green Arrow and 3D Financial Data Visualization Graphs for Economy and Business Concept
00:11
HD
Informational graphic presents Boost vs Drain on a split screen. Text colors subtly change over a light gray background, focusing on a critical concept
00:06
HD
Animated financial bar chart and line graph showing data trends on a dark purple background
00:08
HD
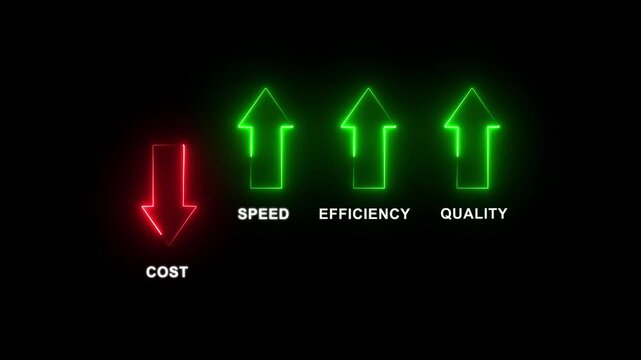
Businessman reduces cost while boosting speed efficiency and quality with digital interface animation on a black background. Motion graphics of quality and cost control concept
00:10
HD
Mobile Network Signal Strength Animation
00:15
HD
Hand holding a glowing infinity symbol representing circular economy concept
00:08
HD
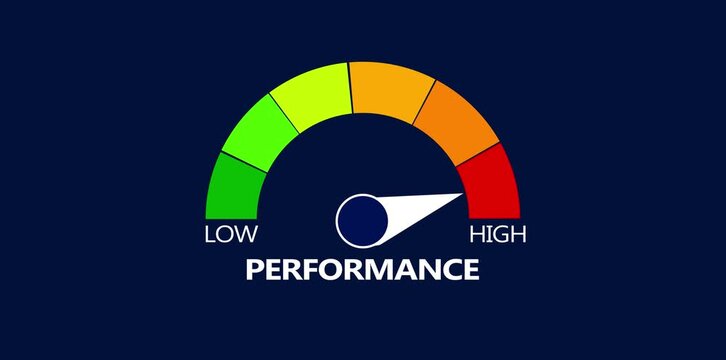
High Performance Gauge Indicator Animation. Speedometer Icon with arrow Indicate high level
00:10
HD
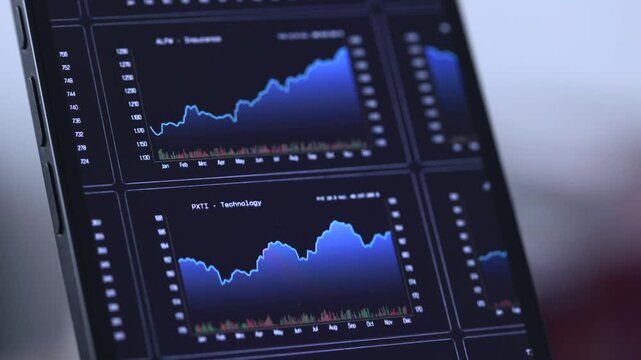
Smartphone shows charts up and down, line graph, stock market and exchange data, trading screen. Investment, business, financial market, analyzing, growth, wealth.
00:09
HD
Business decline bar chart animation with falling line graph and shadow effects on transparent background. Indicate revenue decline, financial loss, negative growth
00:06
HD
Cryptocurrency trading. Bitcoin stock graphic. Bitcoin mining and Finance banking management concept, oil and Money trading, Digital trade platform. Profit and loss graph. Online trading
00:12
HD
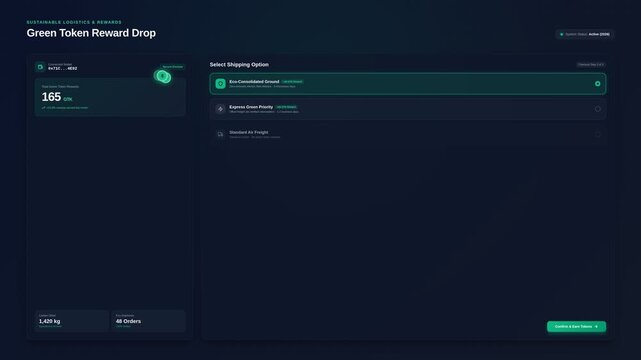
Digital interface with logistics shipping options carbon offset token rewards, for sustainable supply chain management, carbon footprint reduction, eco-friendly business operations
00:20
HD
Economic graph animation going down with an arrow isolated on white background
00:10
HD
One-Click Checkout Word Cloud
00:11
HD
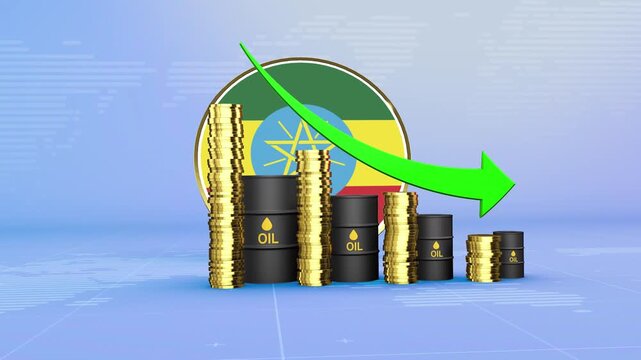
Ethiopia Oil Prices Decline with Oil Barrels, Gold Coins and Downward Green Arrow, 3D Economic and Financial Market Concept
00:11
HD
Business spending optimization concept strategic financial planning, budget management, and cost reduction strategies for increased profits and resource allocation
00:17
HD
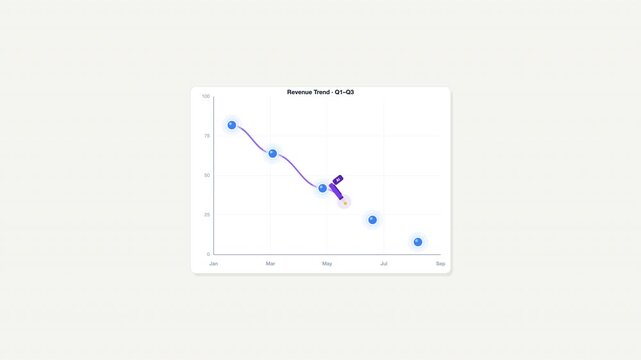
Revenue trend 6m line chart with blue circles and purple wavy line. Suitable for financial presentations, reports, and data analysis projects.
00:10
HD
Bright white 3D number 2047 text animation floating against a deep black void offering a vibrant and modern visual for the year with a sense of digital energy.
00:10
HD
Cost control and quality improvement concept. Red bar chart with line graph showing cost reduction and improving quality. Successful business strategy, efficiency, product optimization and management
00:06
HD
Bar Chart and Line Chart Down Graph
00:08
HD
Bar chart for declining business performance by month. the curve shows a downward move .chart graph animation, 4k arrow is making downfall on a grid ...
00:10
HD
Kyrgyzstan Oil Price Falling with Oil Barrels Downward Green Arrow and 3D Financial Data Visualization Graphs for Economy and Business Concept
00:11
HD
Quality control and company cost reduction. Cost and quality control concept. Successful organization strategy and management.
00:10
HD
Animated dollar sign filling with green liquid representing 80 percent progress financial growth concept dark background with subtle green lines
00:06
HD
Financial loss concept illustration showing a downward trend arrow pointing at a stack of cash and a golden coin representing economic decline and market volatility
00:05
HD
Declining bar chart with downward trend, Blue bar chart with falling line graph decline in business data, finance performance and analytics animation
00:07
HD
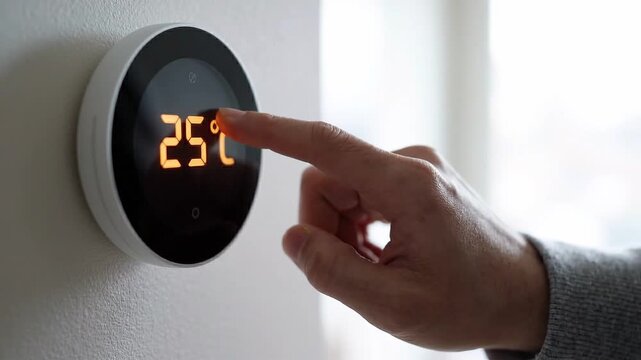
Man hand adjusting smart thermostat temperature on wall from 23 to 26 and 25 degree. Digital climate control and energy saving concept for modern home automation
00:08
HD
Red and green arrows that represent player substitutions in football (soccer) on a transparent background (Alpha channel). Stock market price change concept.
00:06
HD
Green Bar Chart Showing Financial Decline with Stacked Coins and Upward Arrow finance. Stacked coins on green bars showing financial decline with upward arrow overlay, graph.
00:12
HD
Cartoon Piggy Bank Animation with Laptop Displaying Decreasing Financial Chart and Dropping Coins for Business Loss and Budget Crisis Concept.
00:07
HD
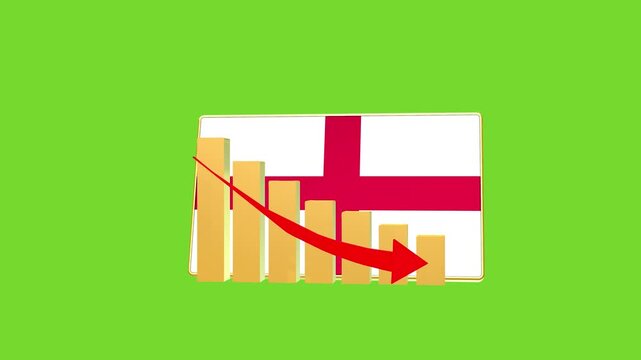
England economic bar chart graph showing decreasing downturn with national Flag 3D animation on black background.
00:16
HD
Close-up laptop screen, trading board, stock market data, index chart up and down, price information. Financial market, sector data, trading volume, investment, bull market, chart moving up.
00:09
HD
Glowing neon line House under protection icon with up arrow isolated on black background. a glowing light drawing a neon outline of houses decreasing in size. House, home building. 4K animation Video.
00:10
HD
Leveraging carbon pricing to drive emission reductions and investment in low carbon technologies
00:05
HD
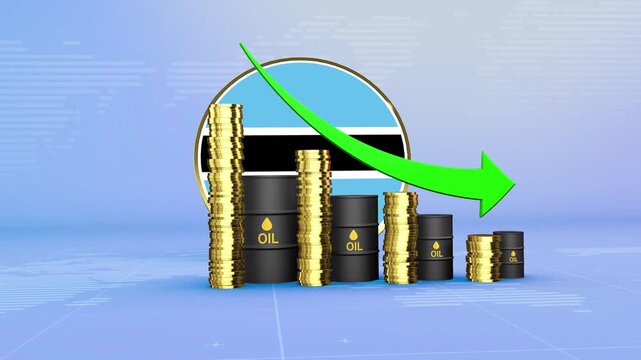
Botswana Oil Prices Decline with Oil Barrels, Gold Coins and Downward Green Arrow, 3D Economic and Financial Market Concept
00:11
HD
Hand offering machinery, like a lawnmower, the financial concept of leasing and rent, with symbols representing business, property, and growth on a white background
00:17
HD
Neon Line Graph Arrow Downwards Against Black .Abstract neon line arrow down business graph.4k video animated.
00:13
HD
Bright white 3D number 2020 text animation floating against a deep black void offering a vibrant and modern visual for the year with a sense of digital energy.
00:10
HD
Cyan downward arrow for cost and upward arrow for with percentage symbols on a solid black background for business performance analysis
00:10
HD
Business graph chart with down trend arrow icon animation. red color animation on black background.
00:05
HD
A business professional works diligently on a laptop, focusing on data analysis for effective cost reduction strategies. The modern office environment emphasizes efficiency and innovation
00:10
HD
Pakistan Oil Price Falling with Oil Barrels Downward Green Arrow and 3D Financial Data Visualization Graphs for Economy and Business Concept
00:11
HD
Cost cuts motion background, with animated red, arrows for business, finance presentations
00:08
HD
Business Analytics Dashboard Motion Graphic with Growth Statistics
00:10
HD
Animated bar chart showing decline and growth, data visualization with gradient bars, financial performance, statistics
00:10
HD
Quality control and company cost reduction. Cost and quality control concept. Successful organization strategy and management.
00:10
HD
Interest rate increase arrow animation.Financial, business, and statistical analysis.
00:10
HD
White line graph showing a peak and decline on grid. White line graph for business data and trend. Digital white line graph animation for report.
00:06
HD