パスワード設定用のリンクを に送信しました。今後は、購入画面にアクセスする際にパスワードが必要になります。
制限なく作成可能 — 無制限のダウンロードと、強力な AI 編集機能
新しいフィルターが追加されました
並べ替え

ビデオ 内の increase and decrease の検索結果 19,774 件

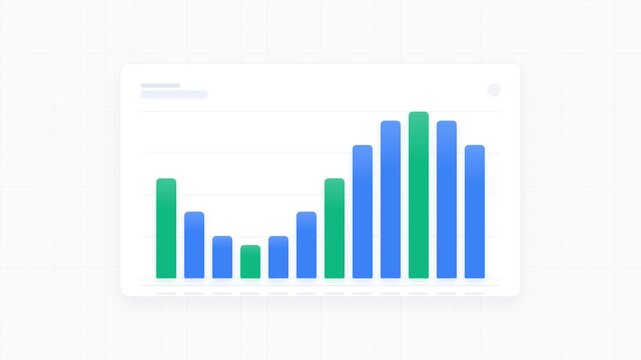
Animated bar chart showing growth and decline metrics
00:10
HD
Green rising zigzag arrow on black background showing stock market recovery, with video animation.
00:10
HD
black business graph chart growth up down or signal on white background with alpha channel. Business up and down signal concept.
00:07
HD
White dollar sign with green fill and grey 40 percent number on dark background with green abstract lines representing financial growth and economic data analysis
00:06
HD
hand touches a blue rectangle on chromakey increases it and drags
00:06
HD
Dollar Sign For Financial Loss And Falling Revenue Wiggle Doodle Animation With Alpha Channel. Currency Symbol And Market Decline, Transparent Background. 4K Loop Hand Drawn Icon.
00:06
HD
Person icon holding money on a hand, symbolizing receiving advantageous financial conditions for credit with decreasing graphs and house icon
00:17
HD
Minimalist bar chart animation showing declining business trends
00:10
HD
Animated scanner targeting money cutting icon for financial budget reduction concept.
00:05
HD
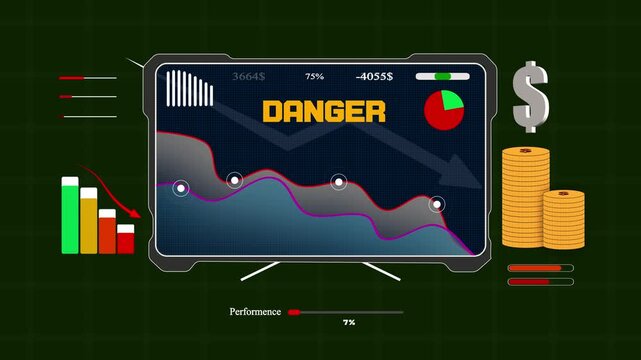
Financial downside danger tracked on a high-tech monitor illustrating sudden capital reduction and shifting economic metrics
00:15
HD
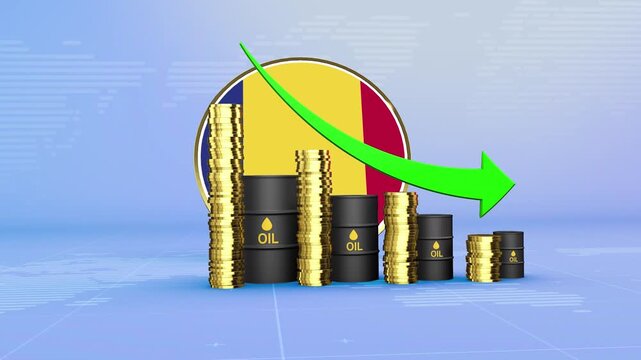
Romania Oil Prices Decline with Oil Barrels, Gold Coins and Downward Green Arrow, 3D Economic and Financial Market Concept
00:11
HD
Dynamic Promotional Banner Featuring a Fifty Percent Discount Offer for Modern Digital Marketing Campaigns and Online Retail Sales Events
00:10
HD
Virtual Try-On Word Cloud
00:11
HD
Liechtenstein Oil Price Falling with Oil Barrels Downward Green Arrow and 3D Financial Data Visualization Graphs for Economy and Business Concept
00:11
HD
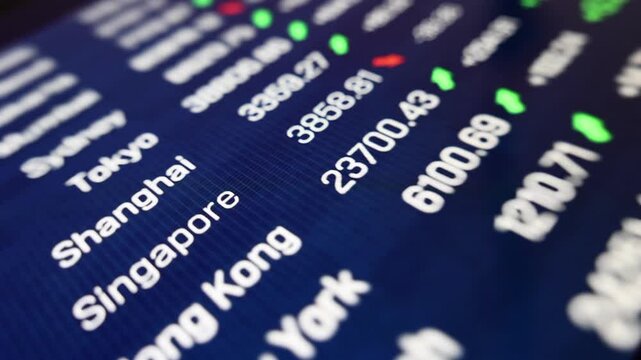
Close-up screen financial markets dashboard, global stock index data, trading board. Investment, stock exchange data, price, risk, strategy, analyzing, business.
00:11
HD
A graph is plotted against a lime-yellow background; the green elements, which represent gains, are trending upward and are marked with arrows, while the red elements, representing losses, are positio
00:10
HD
Financial market downturn concept with declining stock chart, red downward arrow and digital data display representing investment loss, recession, economic crisis and trading risk
00:16
HD
Corporate Success Animation Rising Arrow on Business Graph
00:10
HD
Zigzag line with a downward arrow falling trend loss decline and negative business direction animation
00:06
HD
Cost and quality control concept. Successful organization strategy and management. Quality control and company cost reduction, neon 4k video.
00:10
HD
Bar chart animation with earth globe. Bar chart global financial growth data. Bar chart international business analytics graphic on black background for trade.
00:07
HD
Glowing neon line graph downwards against black background animation. Stock market losses and descending trading graph and downward arrows recession
00:10
HD
Animation footage of a graph showing a downward trend, a downward bar graph, and an arrow chart
00:11
HD
?Adjusting the thermostat: a hand setting room temperature from 72°f to 68°f
00:06
HD
Professional HTML and SVG animated vertical bar chart featuring ten red bars showing a declining trend and an orange downward diagonal arrow on a solid chroma key green background.
00:10
HD
Carbon capture and offset icon depicting green plant sprout growing out of co2 cloud symbol vector
00:15
HD
Business concept visualizing human resource management, assessing employee potential, analyzing productivity metrics, and optimizing labor allocation for efficient organizational development
00:17
HD
Red arrow pointing down animation. Continuous Bouncing Motion Graphic for Directions and Download.
00:10
HD
Car Interior View with Floating Superimposed Green Sustainability Icons Set Against Scenic Snowy Mountain Landscape, Dynamic Concept Motion Graphic for Eco-Friendly Electric Vehicle Tech.
00:13
HD
Interest rate and dividend. business financial investment, business growth, income, motion graphic of marketing and profit concept.
00:10
HD
Netherlands Oil Prices Decline with Oil Barrels, Gold Coins and Downward Green Arrow, 3D Economic and Financial Market Concept
00:11
HD
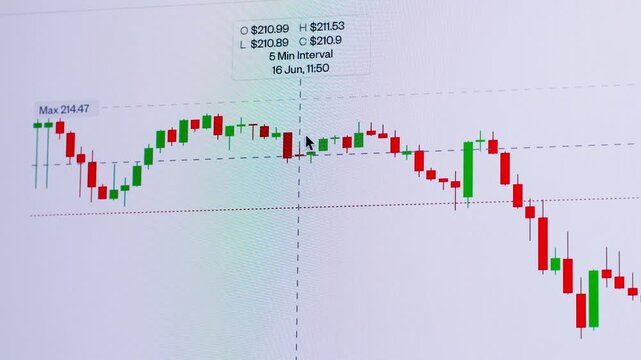
Stock Market Candlestick Chart Animation Showing Bullish Trend Rise Followed by Bearish Trend Fall, Financial Trading, Forex, Crypto Investment Analysis Graph on Dark Grid Background Loop
00:09
HD
Irrigation Scheduling Word Cloud
00:09
HD
Italy Oil Price Falling with Oil Barrels Downward Green Arrow and 3D Financial Data Visualization Graphs for Economy and Business Concept
00:11
HD
Cryptocurrency trading. Bitcoin stock graphic. Bitcoin mining and Finance banking management concept, oil and Money trading, Digital trade platform. Profit and loss graph. Online trading
00:12
HD
neon simple $ icon animation video
00:10
HD
Financial market downturn concept with declining stock chart, red downward arrow and digital data display representing investment loss, recession, economic crisis and trading risk
00:16
HD
Candles of the stock market, price falls. Falling prices of securities. Loss of assets in equities stock. Decreasing trend showing unsuccessful performance and losses failure due to economic.
00:10
HD
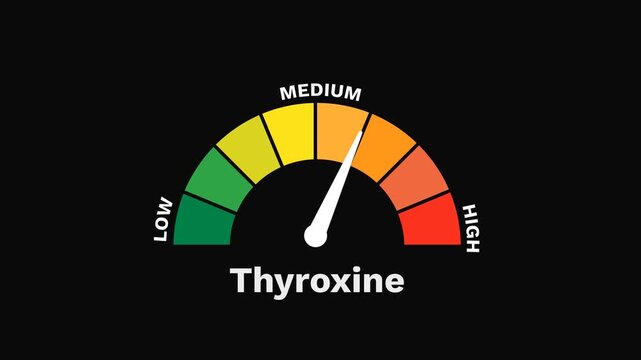
Thyroxine Level Gauge Increasing and Decreasing Indicating Metabolic Activity Animation
00:19
HD
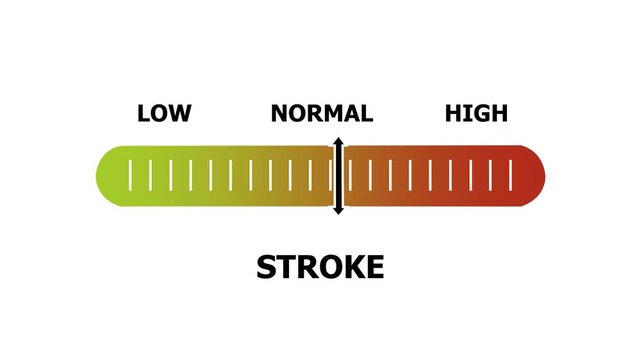
stroke level indicator scale. Low normal & high meter infographic animation. Showing high stroke level color gauge indicator. on a white background 4k animation video
00:10
HD
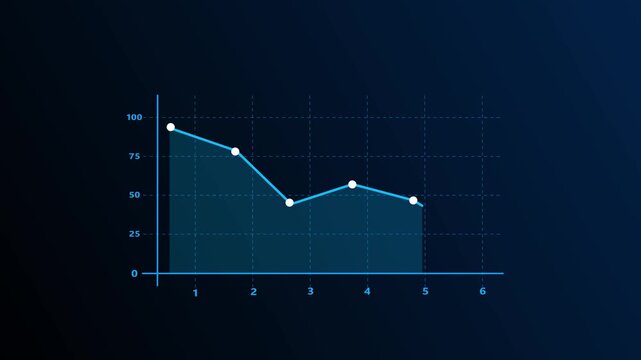
Modern line graph displays falling investment market trends. Technical line graph monitors negative corporate revenue data. Financial crisis concept with digital line graph.
00:10
HD
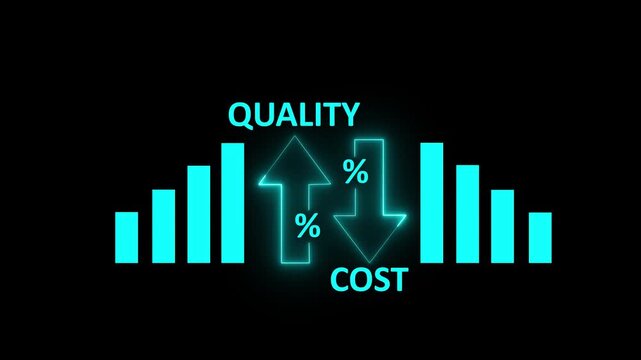
Quality vs Cost Comparison Chart with Business Decision Making and Performance Analysis Concept on Black Background..
00:10
HD
Financial Stock Market Graph Showing Upward and Downward Trends with Data Analysis
00:15
HD
Bright white 3D number 2049 text animation floating against a deep black void offering a vibrant and modern visual for the year with a sense of digital energy.
00:10
HD
Red rectangular stamp with the word WARNING in distressed white font on a white background
00:06
HD
word LOSS dips letter by letter as a red downward graph line draws beneath it and ends in a descending arrow. Useful for financial loss with a transparent alpha channel for compositing
00:08
HD
Business data showing a decrease in operational costs, symbolizing financial efficiency, cost reduction, and budget optimization for companies and enterprises
00:17
HD
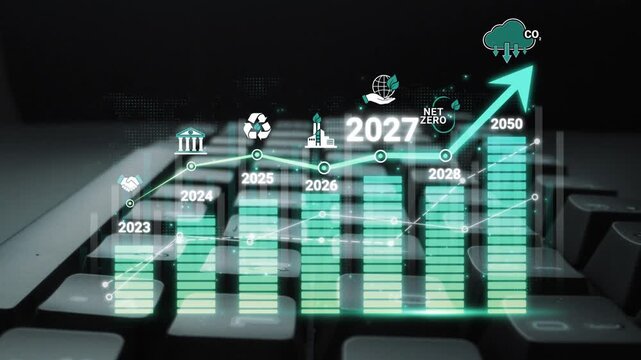
Futuristic Business Growth Chart Displaying Years 2023 to 2050 with Eco-Friendly Themes and Emphasis on Sustainability and Carbon Neutrality Sigmoid
00:10
HD
Fiery percent symbol glowing in dark space numeric character animation loop.
00:10
HD
25 percent off discount badge isolated on dark background.
00:06
HD
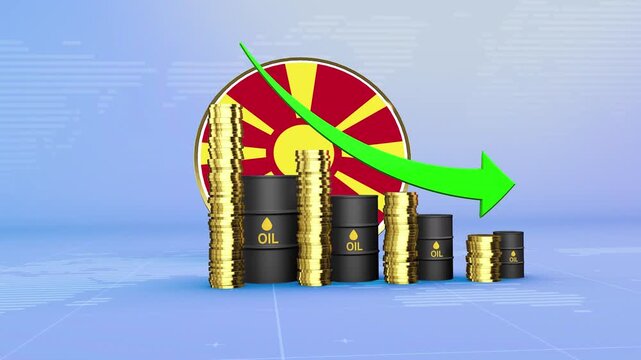
Macedonia Oil Prices Decline with Oil Barrels, Gold Coins and Downward Green Arrow, 3D Economic and Financial Market Concept
00:11
HD
Volume Level Control Animation with Speaker Sound Wave, Plus and Minus Buttons on Soft Peach Background
00:09
HD
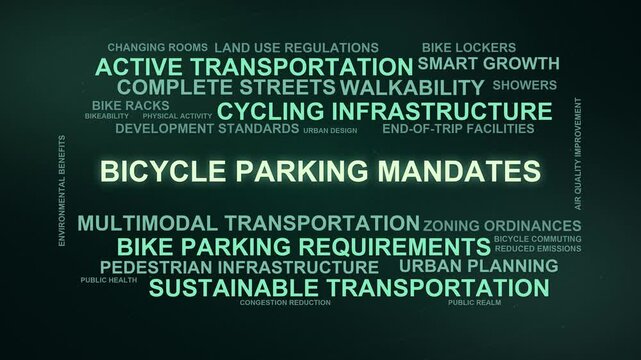
Bicycle Parking Mandates Word Cloud
00:09
HD
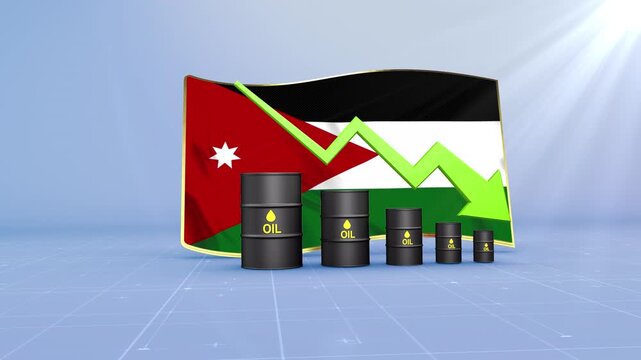
Jordan Oil Price Falling with Oil Barrels Downward Green Arrow and 3D Financial Data Visualization Graphs for Economy and Business Concept
00:11
HD
Purple bar chart showing downward trend with arrow graph. Financial loss chart for corporate performance failure metrics. Digital bar chart animation for network alert.
00:12
HD
glowing neon Global business analyzing concept with trade. Financial figures and charts showing a downward trend, business crash and economic collapse 4k video animation.
00:10
HD
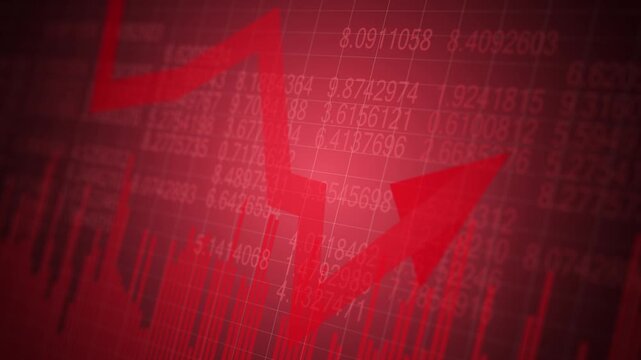
Financial market downturn concept with declining stock chart, red downward arrow and digital data display representing investment loss, recession, economic crisis and trading risk

00:16
HD
Red bar chart with downward arrow on white background representing market decline
00:05
HD
Bar Chart, Profit Down, financial decline trend line chart, Economic crisis, recession, inflation, decrease graph. Bar chart Profit down. Concept of economic crisis, recession, inflation.
00:10
HD
Red chart background glows with financial data. White and orange candlesticks show market movements. Green and yellow lines track rising and falling trends
00:10
HD
blood sugar level indicator scale. Low normal high meter infographic animation on black background. Showing high pressure level color gauge indicator.4k quality animation video
00:10
HD
Quality vs Cost Comparison Chart with Business Decision Making and Performance Analysis Concept on Black Background..
00:10
HD
Red Downward Arrow Icon Animation with Blue Gradient Background and Subtle Glow
00:05
HD
Wheat and barley field poor vegetation with patchy green zones and dry soil strips. Agricultural land showing crop failure and drought conditions. Farming crisis with reduced harvest and weak crop
00:24
HD
acceleration race
00:10
HD
US dollar coin inflation rise and fall value financial animation HD 4K
00:12
HD
Illicit trade of Opioids tramadol and oxycodone or oxy is significant public health danger. Supplies contaminated with potent synthetic fentanyl. Counterfeit pills increases risk of fatal overdose.
00:17
HD
Bright white 3D number 2002 text animation floating against a deep black void offering a vibrant and modern visual for the year with a sense of digital energy.
00:10
HD
Loss prevention plan concept strategic financial management, risk reduction, profit increase, and business growth through calculated actions and analysis
00:17
HD
Hand drawn white zigzag arrow moving upward and downward on a dark background. 4K horizontal video
00:06
HD
Luxembourg Oil Prices Decline with Oil Barrels, Gold Coins and Downward Green Arrow, 3D Economic and Financial Market Concept
00:11
HD
Economic recession downward graph with red arrow isolated on white background animation
00:10
HD
Historical cost Animation
00:06
HD
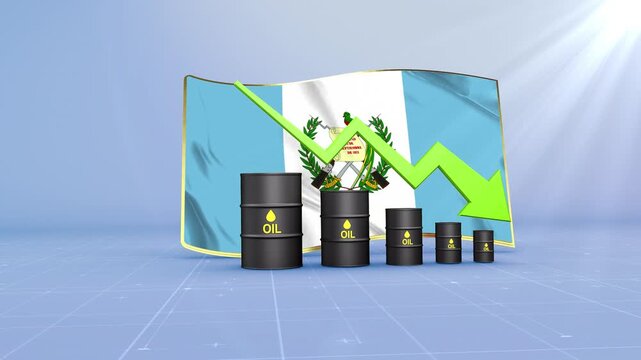
Guatemala Oil Price Falling with Oil Barrels Downward Green Arrow and 3D Financial Data Visualization Graphs for Economy and Business Concept
00:11
HD
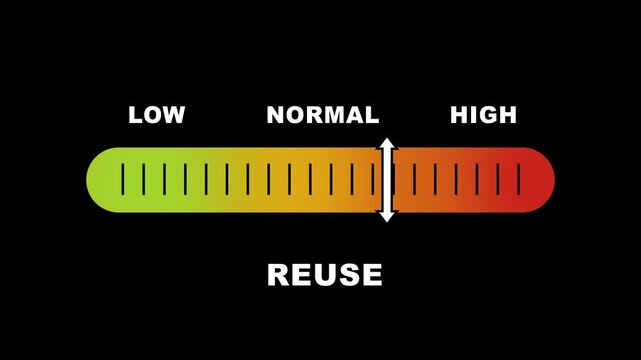
Reuse level indicator scale. Low Normal High meter infographic animation on black background. Showing high reuse level color gauge indicator for sustainability and eco-friendly practices.
00:10
HD
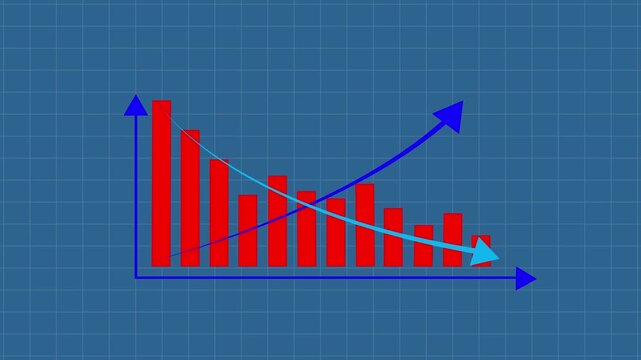
Red bar chart with line graph showing cost reduction and improving quality.. growing business concept.
00:10
HD
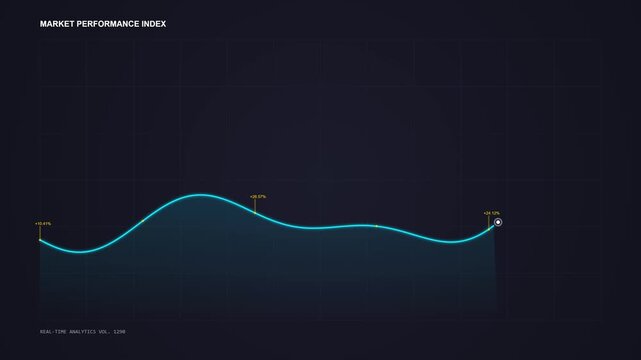
Animated Line Graph Illustrating Market Performance Trends and Data Visualization in 2023.
00:10
HD
climate justice level indicator scale. Low normal & high meter infographic animation. Showing high climate justice level color gauge indicator. on a black background 4k animation video
00:10
HD
Business graph. loss graph direction. damage business graph. down business graph icon. business or finance concept icon animation.
00:07
HD
AI supports net zero goals via virtual assistant insights, AI-based green strategies, and artificial intelligence for climate-aware business planning. Kernel
00:14
HD
Financial market downturn concept with declining stock chart, red downward arrow and digital data display representing investment loss, recession, economic crisis and trading risk
00:16
HD
Dollar Coin with Up and Down Arrows on Green Screen
00:05
HD
Download free with trialBusiness efficiency concept on black background. how much a company or organization can produce as it relates to time, cost and quality.
00:15
HD
Financial Market Decline and Economic Downturn Falling Dollar Value, Decreasing Wealth, Shrinking Investment Returns, Lower Asset Prices, and Increasing Financial Risk
00:10
HD
Bar chart and line graph icon showing financial data trend analysis and business performance animation
00:10
HD
New Arrivals Discount Offer Precision Quality Advertisement.
00:15
HD
Bar Chart: A dynamic and eye-catching bar chart with a gradient of vibrant neon colors illustrates data growth and progress on a reflective surface,
00:10
HD
Business grow-ting arrow. Rising bar follow the arrow. Abstract neon arrow growth , success concept. Profit growing icon animation.
00:10
HD
Market index fund investment strategy involving financial analysis, portfolio management, and monitoring market trends for passive income growth and long term asset accumulation
00:17
HD
Growth medium, text, word level concept. 4K video. on transparent background.
00:10
HD
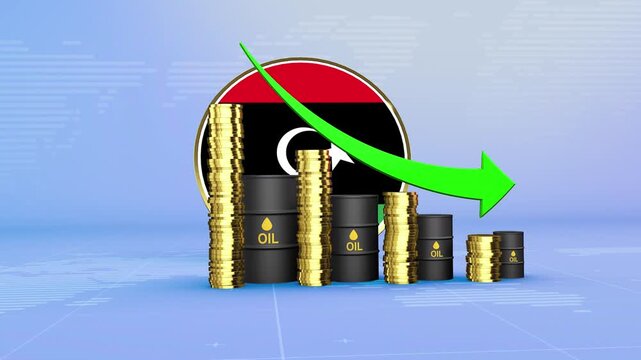
Libya Oil Prices Decline with Oil Barrels, Gold Coins and Downward Green Arrow, 3D Economic and Financial Market Concept
00:11
HD
abstract red stock market line graph grid background, trading and financial data concept
00:05
HD
Abstract increase icon on black background. Dollar rate up looped icon. Reduce costs sign and symbol. motion video 4k quality..
00:06
HD
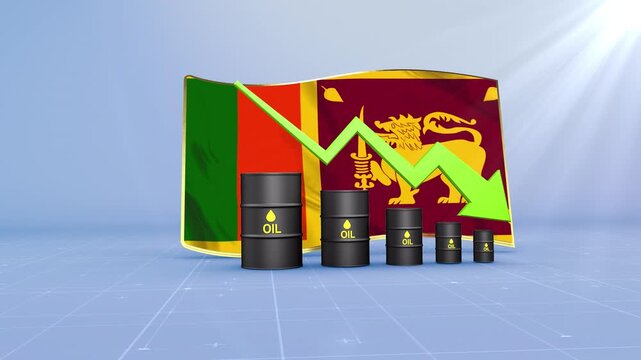
Sri Lanka Oil Price Falling with Oil Barrels Downward Green Arrow and 3D Financial Data Visualization Graphs for Economy and Business Concept
00:11
HD
Bar chart China map red economic decline sphere financial crisis with bar graph red arrow showing China economic decline
00:08
HD
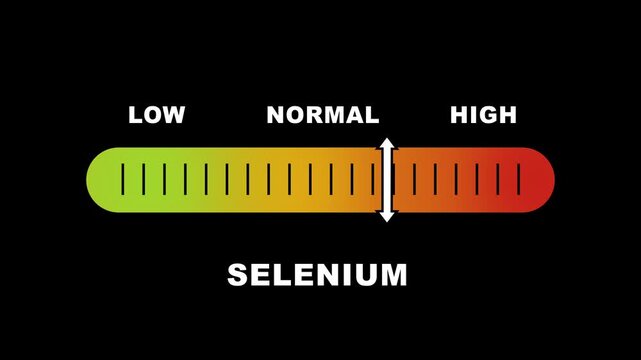
Selenium level indicator scale. Low normal & high meter infographic animation on black background. Showing high selenium level color gauge indicator for nutrition and antioxidant health monitoring.
00:10
HD
Business Bar Chart Growth Report Data Visualization On White Background
00:10
HD
carbon monoxide level indicator scale. Low normal & high meter infographic animation. Showing high carbon monoxide level color gauge indicator. on a white background 4k animation video
00:10
HD
Green arrow pointing down over a dollar sign icon on a black background
00:10
HD
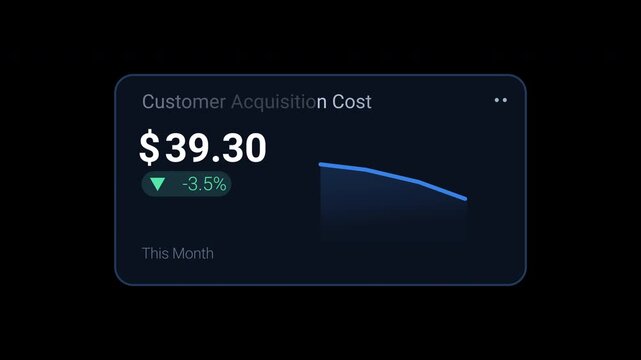
Blue fintech customer acquisition cost KPI dashboard card with currency value, decrease percentage and trend graph. Animated motion graphics component for marketing reports, startup analytics,
00:10
HD