パスワード設定用のリンクを に送信しました。今後は、購入画面にアクセスする際にパスワードが必要になります。
制限なく作成可能 — 無制限のダウンロードと、強力な AI 編集機能
新しいフィルターが追加されました
並べ替え

ビデオ 内の increase and decrease の検索結果 19,770 件

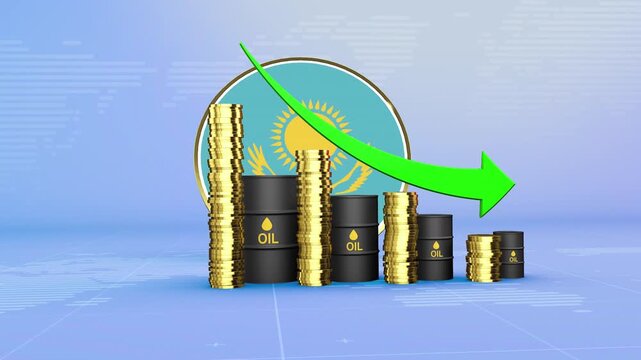
Kazakhstan Oil Prices Decline with Oil Barrels, Gold Coins and Downward Green Arrow, 3D Economic and Financial Market Concept
00:11
HD
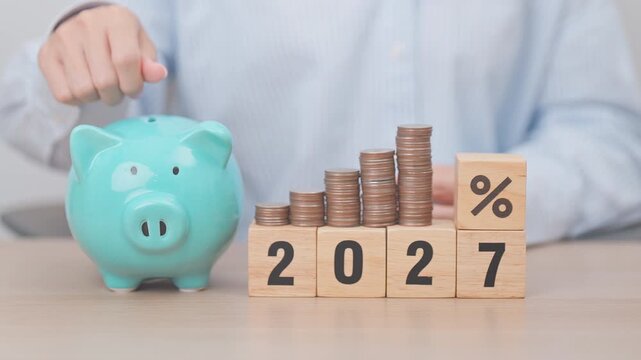
2027 New year with percentage change to UP and Down arrow with coin stack. Interest rate, GDP, stocks market, financial, deflation and Inflation, mortgage, debt, Loan and Economic Recession
00:10
HD
Gold coin stacks as growth charts on dark background
00:10
HD
Cost reduction business finance concept. Businessman cost reduction icon with down arrow for budget management and 4k Animation video on Black Background
00:10
HD
Digital Light Intensity Slider HUD Monitor Interface
00:10
HD
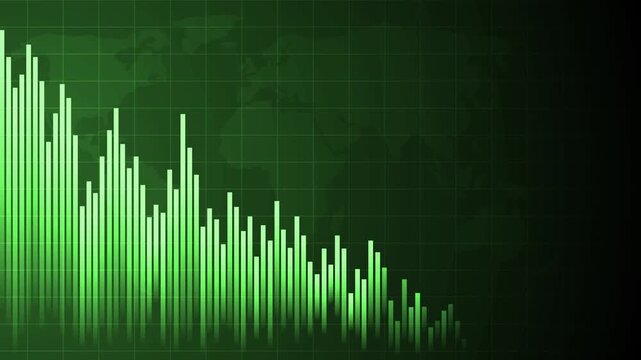
Abstract financial chart with falling bars downward market trend and low performance with grid and world map details animation
00:10
HD
Clean Carbon Reduction Tracker Dashboard with Descending Emissions Steps and Green Energy Growth
00:05
HD
Financial Growth Trend Animation with Positive Revenue Indicators
00:09
HD
White line chart with moving trends on black background grid. Financial success graph for corporate business performance analysis. Animated bar graph report.
00:13
HD
Lean thinking concept. Cost reduction concept. Business process improvement. Maximising productivity and quality, reducing time and cost. Cost cutting, lean process for surviving the recession.
00:10
HD
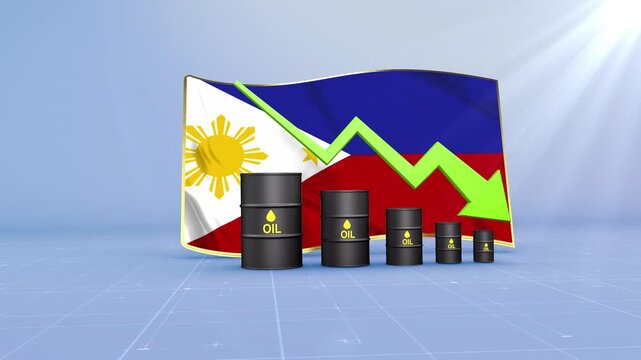
Philippines Oil Price Falling with Oil Barrels Downward Green Arrow and 3D Financial Data Visualization Graphs for Economy and Business Concept
00:11
HD
Illustration depicting an expenses reduction strategy, showing financial charts, budgeting for assets, and planning cost saving initiatives for business operations
00:17
HD
4k .Cost reduction concept. Cost wording on decrease money with down arrow. Cost Management, Economy recession, low budget, Effective business,
00:10
HD
Neon blue bar graph animation. Animated data technology business finance abstract background looping motion graphics modern digital presentation visuals financial growth success progress statistics.
00:12
HD
Animated Bar Chart Growth and Decline Data Visualization
00:08
HD
A simple line graph showing a downward trend with purple dots indicating data points on a black background, representing data analysis and decline.
00:08
HD
Financial Decline Graph with Percentage Symbol and Falling Data Blocks
00:10
HD
Red Downward Trend Graph on Green Screen Background
00:15
HD
US dollar coin inflation rise and fall value financial animation.
00:06
HD
Digital Slide Deck Presentation Animation Showing Revenue Growth User Increase and Cost Reduction Metrics
00:10
HD
Bahrain Crude Oil Price Decline with Oil Barrels and Downward Green Arrow
00:11
HD
Cost reduction and cost saving through digital transformation, business cost and 2026 optimization, operational cost reduction, financial saving, and resource efficiency 4k video animation.
00:06
HD
Large black shekel symbol zooms in and out at the center, surrounded by four small copies. Seamless looped 4k animation on white background
00:12
HD
Animated neon blue financial downtrend line graph showing market decline and economic recession concept with glowing digital chart isolated on a deep black background, for presentations
00:10
HD
Business growth concept animation, Business line arrow .Chart arrow still goes Down animation. Graph decreasing. Business animation. Economy concept. arrow down
00:10
HD
Abstract organic shapes growing in size against a blue background with cinematic motion
00:05
HD
Digital Business Stock Market Data and Growth Financial Trading Chart  Animation looping Seamless Motion Background. Business stock data concept
00:19
HD
Professional Business Growth Chart Animation with KPI Analytics
00:09
HD
Discount percent signs moving on abstract background with dynamic curved lines
00:08
HD
Trading screen East Europe market index chart up, stock market and currency data. Sector data, business, financial market, prices, trading board, investment strategy, market research.
00:10
HD
Curved arrow pointing down and to the right with a flowing shape animation
00:06
HD
Financial operations with currency exchange and banking fees, optimizing capital for cost reduction and efficient money payments within global economic transactions
00:17
HD
Triglycerides level indicator scale. Low normal & high meter infographic animation on black background. Showing high triglycerides level color gauge indicator for blood health and cardiovascular.
00:10
HD
Red Bar Chart Declining Trend Data Analysis Business Growth.
00:10
HD
Abstract decrease icon on green background. Reduce cost concept with dollar and down arrow animation.
00:10
HD
Mouse cursor dragging a slider to adjust text size. Digital interface for user experience.
00:10
HD
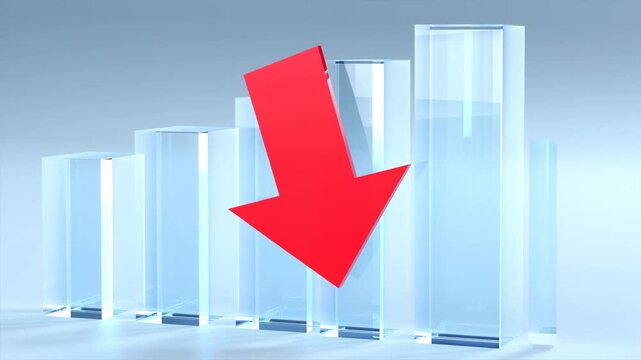
Red Arrow Pointing Down in Front of Glass Bar Chart Showing Financial Decline
00:05
HD
3D Rendered Red Percent Symbol Isolated on a Clean Light Gray Background for Black Friday and Sales Promotions
00:05
HD
Three large digital numbers counting down on dark background with dark reflective surface close
00:05
HD
Hand-drawn financial line graph declining downward on white background, for business presentations arrow
00:10
HD
Estonia Oil Prices Decline with Oil Barrels, Gold Coins and Downward Green Arrow, 3D Economic and Financial Market Concept
00:11
HD
Calculator App Icon with Changing Numbers on Green Screen
00:07
HD
Zoom in and out animation the close symbol. Large black symbol in the center and four small symbols around. Seamless looped 4k animation on white background
00:12
HD
A high-fidelity financial chart displays a fluctuating market trend on a computer screen with a total value of $1685.97 showing a 0.04% increase.
00:14
HD
Blue Neon Dollar Sign with Downward Arrows in Circle
00:10
HD
arrow down business graph icon animation. business chart concept. A neon down business graph icon graphic concept. animation
00:10
HD
Ticker display. table grid Stock exchange screen number with financial trade index rates, finance fund stocks price increase and decrease charts arrow up and down
00:20
HD
Revenue and Profit Growth Animation for Corporate Business Reports
00:08
HD
A CO2 cube and a dollar money bag. Recycling grants. Reducing environmental impact while generating income. Increase in the cost of emission quotas for enterprises. Waste recycling
00:14
HD
3D Business Statistics Bar Chart with Downward Arrow Showing Financial Decline, Falling Revenue, Market Loss and Negative Growth Data Visualization on Green Screen
00:05
HD
Futuristic dollar countdown timer animation, glowing dollar symbol integrated with a circular countdown display, numbers decreasing smoothly from 0 to 200
00:10
HD
Business hand holding a financial risk meter while monitoring asset value fluctuations and checking investment portfolio data and analytics for timely market decisions
00:17
HD
Responsibility level indicator scale. Low normal & high meter infographic animation on black background. Showing high responsibility level color gauge indicator for accountability and performance.
00:10
HD
Four grey circles animating and scaling on white background with copy space
00:08
HD
Business growth concept in graph chart showing marketing sales profit increasing and decreasing to future target . growing business concept. Clean Hi-tech style technology chart with a grid Mockup.
00:12
HD
Animated Red Bar Chart Showing a Declining Negative Business Trend
00:09
HD
Declining bar chart with downward trend, Blue bar chart with falling line graph decline in business data, finance performance and analytics animation
00:07
HD
Abstract financial chart with falling bars downward market trend and low performance with grid and world map details animation
00:10
HD
Abstract glowing neon swipe arrow. 4k animation. Down to up neon line arrow direction animation. Neon line raising business arrow on black background.on black backgraund .HD video animation.
00:10
HD
Down arrow business graph chart animation. Loss business graph icon animation.  on black background. 4k video
00:10
HD
Qatar Oil Prices Decline with Oil Barrels, Gold Coins and Downward Green Arrow, 3D Economic and Financial Market Concept
00:11
HD
Minimalist animated bar chart showing negative financial trend with declining revenue growth and economic downturn concept for corporate business presentations and data analysis reports in media
00:10
HD
Animated 3D Bar Chart Showing Decreasing Values for Data Analysis and Business Presentations.
00:05
HD
business graph icon. Business Loss Graph Symbol Minimal Design. Declining Bar Chart Icon with Downward Arrow
00:06
HD
LGBTQ economic bar chart graph showing decreasing downturn with national Flag 3D animation on black background.
00:16
HD
Aerial view sunset with clean air exhaust pipe for air pollution reduction. Economic growth, industrial energy, Environment sustainability. Business and technology development nature. Factory Palm oil
00:15
HD
Israel Oil Price Falling with Oil Barrels Downward Green Arrow and 3D Financial Data Visualization Graphs for Economy and Business Concept
00:11
HD
Increase counting numbers 0 to 50k digital clock or timer display with decimal point.4k motion graphics video animation
00:10
HD
Abstract dollar sign icon and up arrow animation on a white background. Upward arrow and dollar icon. High pricing icon. profit, investment, growth business, economy, finance and success concept
00:10
HD
Zoom in and out animation the share arrow symbol. Large black symbol in the center and four small symbols around. Seamless looped 4k animation on white background
00:12
HD
Business crisis line chart animation with downward arrow loop on black background...
00:13
HD
Pricing adjustment process involves calculating costs, managing finances, and setting competitive prices to optimize business performance using financial data and strategic analysis
00:17
HD
Animated interface icons with growth decline idea and alert symbols on white background
00:08
HD
Business concept: reducing cost while increasing financial growth and optimization strategy, infographic animation for corporate presentations
00:10
HD
line graph showing cost reduction and improving quality. Successful business strategy, efficiency, product optimization and management. Business steady growth concept with rising progress bar chart
00:10
HD
Bar chart glowing in vibrant blue light depicts a decreasing numerical trend with a prominent downward arrow signaling reduced fiscal output or negative profit margins for your professional report.
00:10
HD
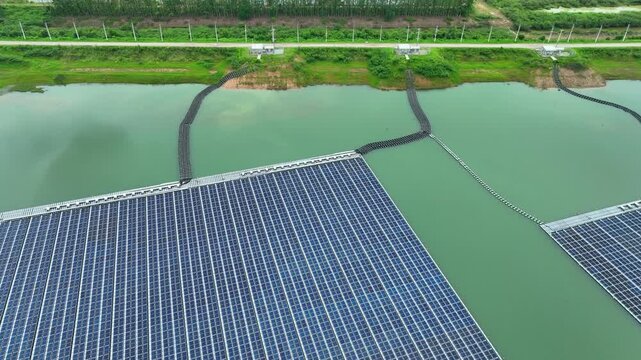
Drone photography captures a massive floating solar farm, demonstrating efficient land use, renewable energy development, and ESG-focused infrastructure for sustainable growth. Thailand. 4k.
00:12
HD
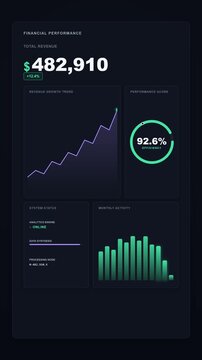
Modern financial dashboard with charts and growth metrics on dark background.
00:08
HD
Ticker display. table grid Stock exchange screen number with financial trade index rates, finance fund stocks price increase and decrease charts arrow up and down
00:20
HD
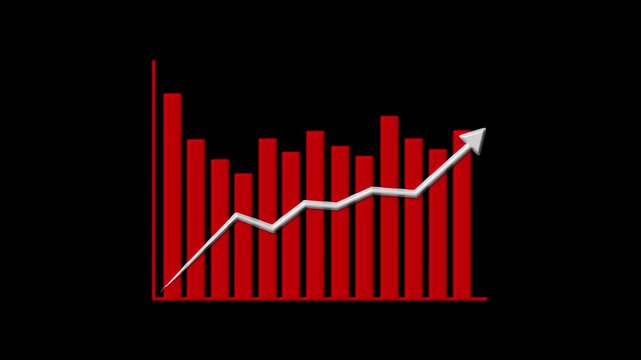
Red Bar Graph with Downward Trend and White Arrow Showing a Rise chart
00:07
HD
Nicaragua Oil Prices Decline with Oil Barrels, Gold Coins and Downward Green Arrow, 3D Economic and Financial Market Concept
00:11
HD
Red 3D forty percent symbol on black background
00:08
HD
glowing neon line business graph growth arrow to down arrow. Financial business Loss down graph chart with red neon line, glowing red neon downward graph with arrow indicating decline, 4k video
00:10
HD
Bar chart for declining business performance by month. the curve shows a downward move .chart graph animation, 4k arrow is making downfall on a grid ...
00:10
HD
Animated bar graph showing monthly data trends with orange bars against a black background
00:15
HD
Testosterone Level Gauge Increasing and Decreasing Indicating Hormonal Activity Animation
00:19
HD
Moldova Oil Price Falling with Oil Barrels Downward Green Arrow and 3D Financial Data Visualization Graphs for Economy and Business Concept
00:11
HD
Progressive numbers counting down in circles on black background with cinematic motion for business analytics
00:46
HD
Mobile Network Signal Strength Animation
00:05
HD
Lean thinking concept. Cost reduction concept. Business process improvement. Maximising productivity and quality, reducing time and cost. Cost cutting, lean process for surviving the recession.
00:10
HD
Animated yellow bar chart and line graph showing financial data on grid background
00:10
HD
Percentage allotments concept financial income distribution, tax planning, economy growth, and budget allocation with documents, money stacks, and a calculator
00:17
HD
Glowing neon line House under protection icon with up arrow isolated on black background. a glowing light drawing a neon outline of houses decreasing in size. House, home building. 4K
00:10
HD
Neon glowing medical thermometer icon animation. That's indicates weather temperature 20 degree increase or decline. Thermometer equipment showing hot or cold weather.
00:10
HD
Three word kinetic typography sequence displaying Clients Ready Buy with sequential letter spacing reduction and sharp zoom transition
00:12
HD
Decarbonization, featuring a vibrant green plant in the foreground with a CO2-emitting industrial chimney in the background, symbolizing the balance between industry and environmental sustainability.
00:15
HD
COVID-19 risk level indicator scale. Low normal & high meter infographic animation on white background. Showing high COVID-19 level color gauge indicator for public health and disease monitoring.
00:10
HD
Business leaders discuss implement environmental sustainability strategies net zero carbon goals corporate responsibility using ESG reports data at meeting
00:11
HD
Lush green forest canopy with cloud graphic, CO2 letters and arrows symbolizing carbon reduction for a healthier environment.

00:07
HD
Downward Trending Bar Chart with Red Arrow on Black Background graph data
00:07
HD