パスワード設定用のリンクを に送信しました。今後は、購入画面にアクセスする際にパスワードが必要になります。
制限なく作成可能 — 無制限のダウンロードと、強力な AI 編集機能
新しいフィルターが追加されました
並べ替え

ビデオ 内の increase and decrease の検索結果 19,769 件

Digital Volume Control Animation Increasing and Decreasing, Isolated on Green Screen
00:10
HD
Battery charging animation loop, showing power level increasing and decreasing with a lightning bolt symbol on a dark background. This digital interface icon represents device power status.
00:10
HD
Dense green ground vegetation creating natural soil protection demonstrates moisture conservation, temperature reduction, and ecological support for healthy land environments.
00:12
HD
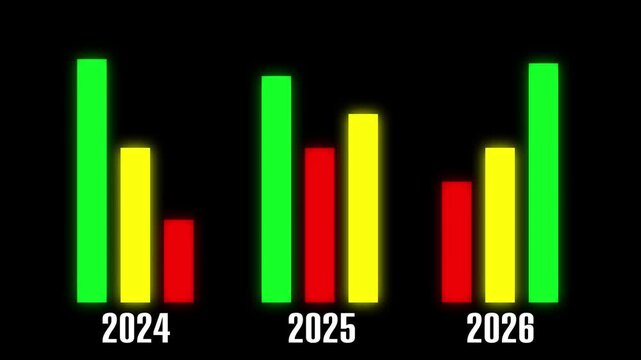
Bar graphs animation displays annual fluctuating financial market trends. Corporate business revenue metrics update on bar graphs. Profitable trading drives active graphs.
00:13
HD
Businessman analyzing profit and quality management concepts long term cost planning, product quality, budgeting, financial forecasting, and company revenue and expense projections.4k video
00:10
HD
Self care is a vital concept for maintaining mental well being, depicting a balanced approach to life with a focus on personal health, stress management, and a mindful living environment
00:17
HD
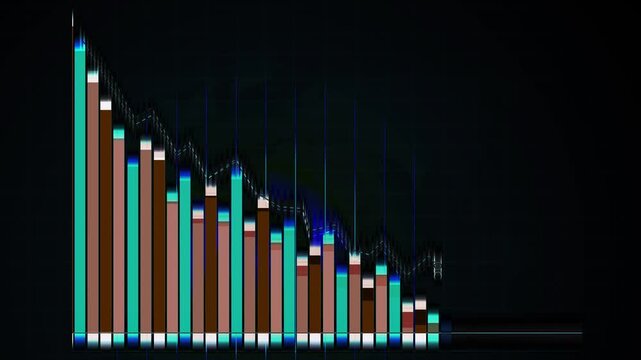
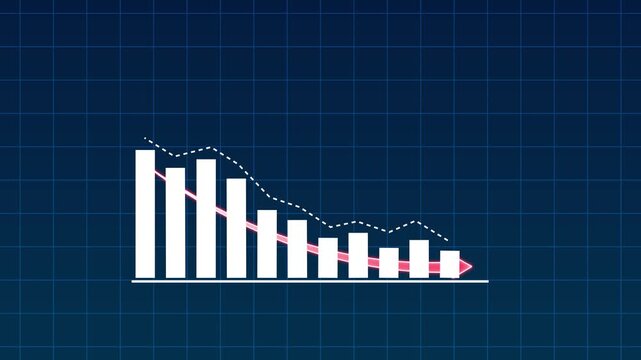
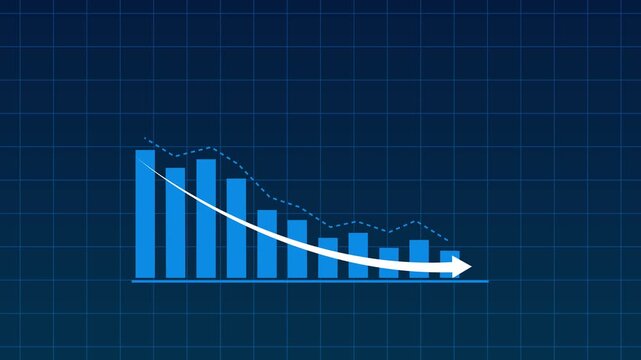
Declining bar chart with downward trend, Blue bar chart with falling line graph decline in business data, finance performance and analytics animation
00:07
HD
Cost reduction concept. Cost wording on decrease money with down arrow. Cost Management, Economy recession, low budget, Effective business, Expense reduce on transparent background
00:10
HD
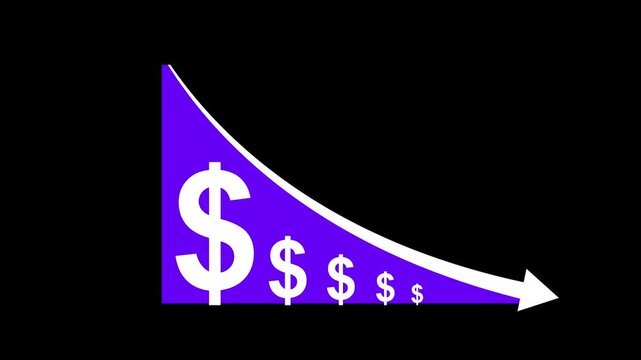
decrease icon animation video. dollar rate decrease today.
00:05
HD
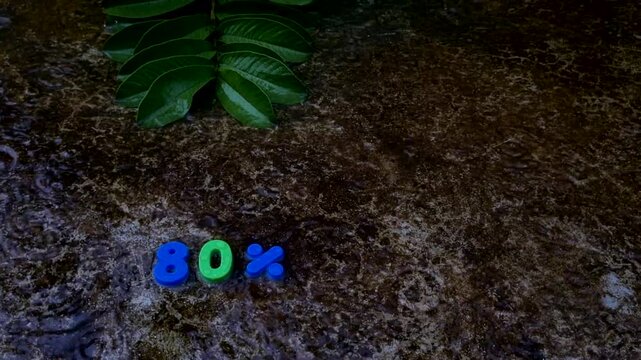
Eighty percent discount sign represented by colorful plastic numbers on wet ground during rain
00:18
HD
Zoom in and out animation the sparkles symbol. Large black symbol in the center and four small symbols around. Seamless looped 4k animation on white background
00:12
HD
Animated bar graph chart data visualization business finance financial report growth marketing technology. Animated bar graph chart business finance data visualization abstract background.
00:05
HD
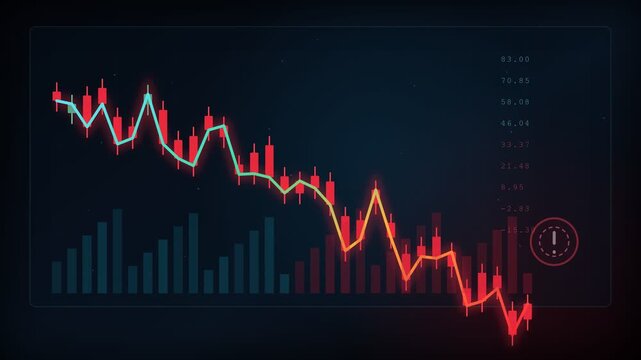
Digital animation showing a falling stock market with a bearish candlestick chart and line graph, representing financial recession, economic crisis, investment loss, and market volatility concepts
00:10
HD
Glowing Downward Arrows Stock Market Crash and Loss Concept Motion Graphic video...
00:10
HD
Dollar currency price drop concept. circle with down arrow moving animation on a black background.

00:10
HD
Close-up screen financial markets dashboard, global stock index data, trading board. Investment, stock exchange data, price, risk, strategy, analyzing, business.
00:10
HD
Glowing red cost chart animation with a descending arrow, declining prices, financial loss, market trends, and economic changes on a black background, 4K video
00:21
HD
dollar down icon symbol.Dollar price collapse. Dollar price fall.Money reduction icon, white stroke on clean black background seamless loop motion design graphic element 4k animation.
00:10
HD
Taiwan Oil Prices Decline with Oil Barrels, Gold Coins and Downward Green Arrow, 3D Economic and Financial Market Concept
00:11
HD
Business graph chart with growing business concept. Abstract decreasing business graph chart animation background.Motion graphics of concept
00:10
HD
Animated vertical volume control slider on dark background
00:07
HD
A group of professionals engages in a dynamic discussion about environmental sustainability, focusing on the implementation of ESG objectives and strategies. Raster
00:20
HD
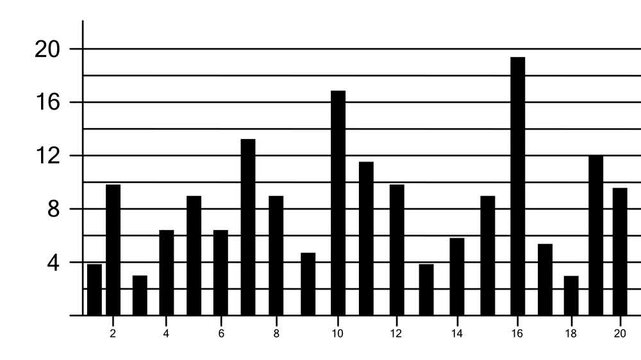
Business graph crash down with red arrow. Motion graphics of down business arrow on a white background  4k video
00:10
HD
Ticker display. table grid Stock exchange screen number with financial trade index rates, finance fund stocks price increase and decrease charts arrow up and down
00:20
HD
Bright white 3D number 2005 text animation floating against a deep black void offering a vibrant and modern visual for the year with a sense of digital energy.
00:10
HD
Personal finance tracker income growth, expense reduction, and budget planning with financial analysis and saving money
00:17
HD
Declining bar chart with downward trend, Blue bar chart with falling line graph decline in business data, finance performance and analytics animation
00:08
HD
Golden dollar sign cut by red scissors symbolizing budget reduction and financial savings concept
00:10
HD
Associative Nitrogen Fixation Word Cloud
00:09
HD
3D Blue Upward Arrows Animation on Black Background, Declining Trend and Business Loss Concept
00:08
HD
Zoom in and out animation the volume symbol. Large black symbol in the center and four small symbols around. Seamless looped 4k animation on white background
00:12
HD
Dynamic production dashboard animation with fluctuating efficiency graphs and status indicators, symbolizing business growth, data analysis, and operational progress, for corporate presentations.
00:08
HD
Many Pills Medication Decreasing Increasing With Dolly Move
00:09
HD
Bar chart animation displays declining columns with a falling trend line. Corporate business financial losses reflect on bar chart. Economic downturn marks the chart.
00:08
HD
Increase and decrease line animation on financial business chart. Economic graph icon on white background for finance concepts and analytics.
00:10
HD
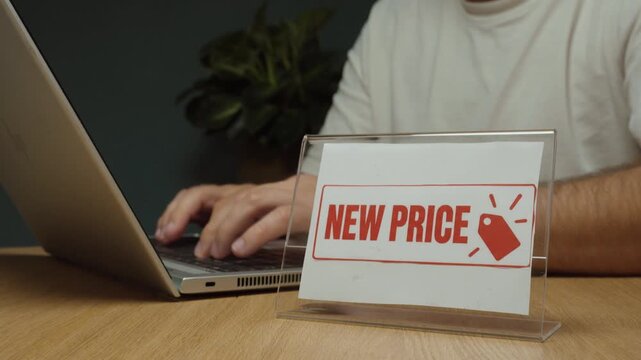
Man works on a laptop and then places a “New Price” sign on the desk, representing price changes, retail pricing, sales and updated costs.
00:17
HD
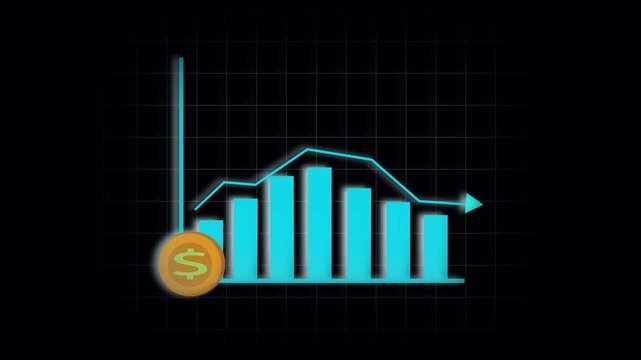
Animated business investment decline financial chart stock market economy abstract background loop. Stock market graph animation financial chart business economy dollar coin money decrease trend.
00:06
HD
A glowing teal-to-green neon icon featuring side-by-side vertical elements resembling a directional or up-and-down arrow symbol against a dark background.
00:10
HD
Suriname Oil Prices Decline with Oil Barrels, Gold Coins and Downward Green Arrow, 3D Economic and Financial Market Concept
00:11
HD
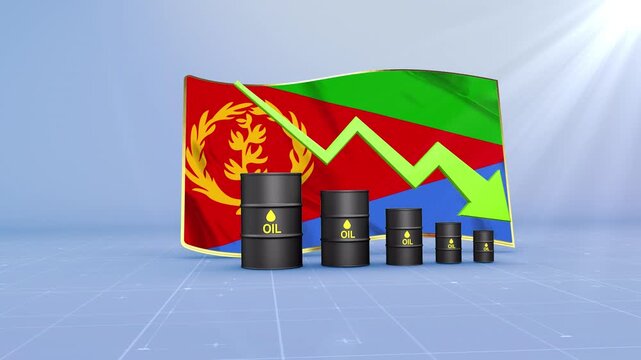
Eritrea Oil Price Falling with Oil Barrels Downward Green Arrow and 3D Financial Data Visualization Graphs for Economy and Business Concept
00:11
HD
stock market green arrow upward profit return growth graph chart animated continuous single line drawing isolated on black background, line art animation illustration design sign symbol video
00:10
HD
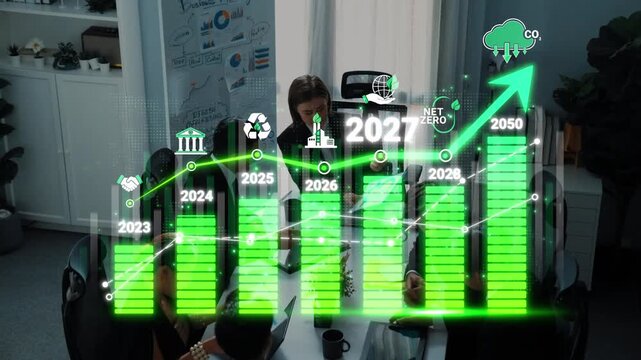
Projection of Carbon Neutral Goals with Business Strategy and Environmental Impact Charting Sustainable Growth in Corporate Meetings Sigmoid
00:20
HD
Business Financial Infographic Showing Operating Costs Reduction and Forty Percent Margin Optimization
00:08
HD
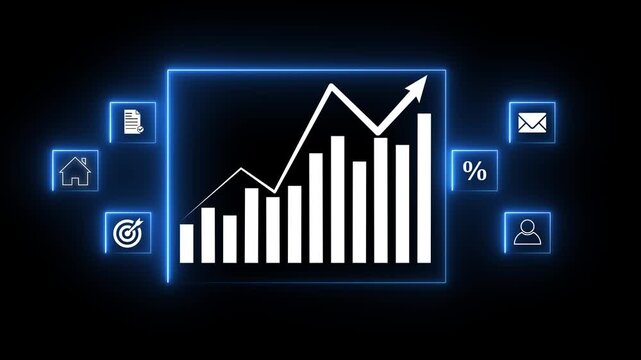
Business growth concept in colorful graph chart showing marketing sales profit increasing and decreasing to future target . growing business concept. Clean Hi-tech style technology chart with a grid.
00:12
HD
Animated glowing financial bar chart and arrow displaying market drop and stock recovery for video overlay
00:06
HD
Political instability risk causing market fluctuations, declining investments, and economic uncertainty, depicted with financial charts, a warning sign, and a decreasing dollar value
00:17
HD
Fullscreen icon animation on green background. Exit full screen mode, multimedia player animation. Increasing and decreasing screen size animation. Zoom expand for screen scaling and full screen mode
00:08
HD
Line graphs animation displays fluctuating financial market data on dark. Corporate business revenue performance metrics update on line graphs. Investment drives graphs.
00:06
HD
Customer Success Word Cloud
00:11
HD
Line art success graph icon animation. Finance and business, Financial report. Financial analysis icon. Animated line growth and decrease diagram.
00:05
HD
As focal length decreases, autumn leaves and round seed clusters hang against dark green foliage.
00:15
HD
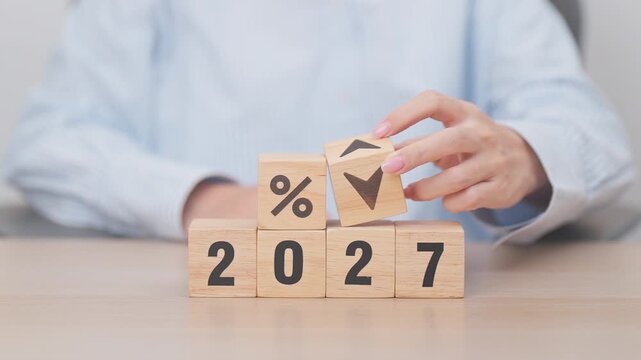
2027 New year with percentage change to UP and Down arrow with coin stack. Interest rate, GDP, stocks market, financial, deflation and Inflation, mortgage, debt, Loan and Economic Recession
00:09
HD
Framed Volume Slider Animation from Zero to Maximum with Mute Control for Digital Audio Interfaces
00:08
HD
Cost 2028 business finance concept. Businessman cost reduction icon with down arrow for budget management and 4k Animation video
00:10
HD
Dynamic Mega Sale Comic Book Style Promotion.
00:15
HD
Glowing neon line of dollar sign icon. Dollar rate decrease icon animation . Money symbol with stretching arrow down. Rising prices. Business cost sale icon.
00:10
HD
Contrasting Financial Market Trends Showing Sharp Red Decline Against Rising Green Growth with Opposing Arrows, Market Recovery, Volatility, and Business Transformation
00:10
HD
Financial bank graph with down arrow and dollar sign with up arrow suitable for finance concepts, economic downturn, stock market analysis.
00:06
HD
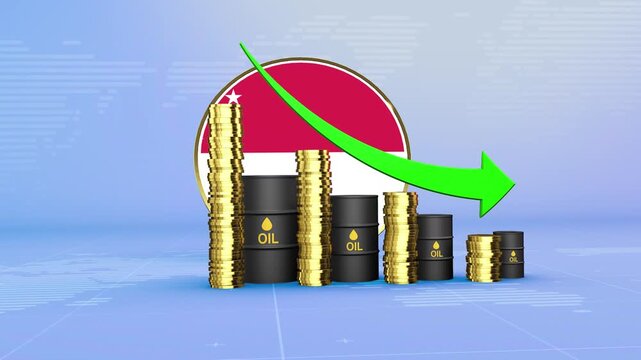
Singapore Oil Prices Decline with Oil Barrels, Gold Coins and Downward Green Arrow, 3D Economic and Financial Market Concept
00:11
HD
Moving digital Business Growth Financial Trading Chart and Stock Market Data Animation looping Seamless Motion Background. Business stock data concept
00:25
HD
Financial Growth Trend Animation with Positive Revenue Indicators
00:09
HD
A businessman engages with virtual reality technology to visualize concepts around carbon neutrality and sustainability, representing modern innovation in the workplace. Raster
00:16
HD
Bar Chart, Profit Down, financial decline trend line chart, Economic crisis, recession, inflation, decrease graph. Bar chart Profit down. Concept of economic crisis, recession, inflation.
00:10
HD
Business growth concept in graph chart showing marketing sales profit increasing to future target. Motion graphics of business graph concept
00:10
HD
Animated dollar sign with 55 percent indicator and green gradient fill on dark background with abstract green lines representing financial growth and data analysis
00:06
HD
Performance objectives concept icon highlighting a range of business goals, from agile development and process optimization to achieving quality benchmarks and evaluating outcomes
00:17
HD
Glowing blue business bar chart with downward arrow and declining line curve. Symbolizing revenue drop, financial loss, negative growth, market downturn 4K
00:07
HD
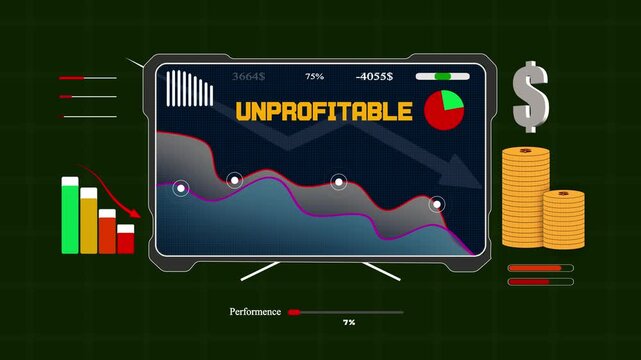
Economic metrics on an electronic display representing non-profitable returns and reduced business traction
00:15
HD
Phased Retirement Word Cloud
00:11
HD
Neon blue financial graph icon with dollar sign and scissors cutting line symbolizing cost
00:08
HD
Business graph chart drop circle with down arrow moving animation on black background. Decreasing business graph and down arrow for business loss falling, bad economy recession concepts
00:10
HD
2027 New year with change to UP and Down arrow. Interest rate, GDP, stocks market, financial, deflation and Inflation, mortgage, debt, Loan and Economic Recession
00:09
HD
Bar Chart Data Visualization Abstract Blue Bars.
00:10
HD
Pulsating neon pink line graph animation on black background, representing fluctuating financial market trends and data visualization
00:05
HD
glowing neon arrow direction on black background, neon arrow sign animation.
00:10
HD
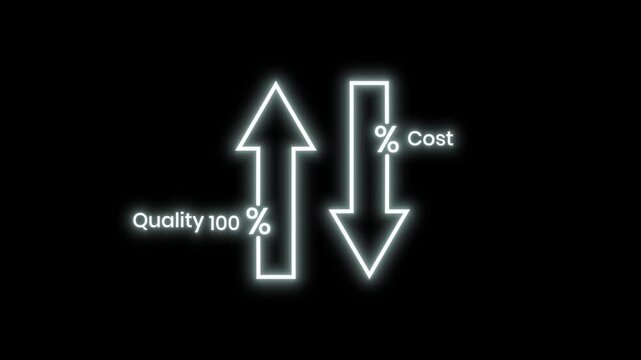
Neon Line Drawing Arrow Animation Showing Quality One Hundred Percent Increase And Cost Decrease With Transparent Alpha Channel For Business Infographics Presentation Loop VFX
00:12
HD
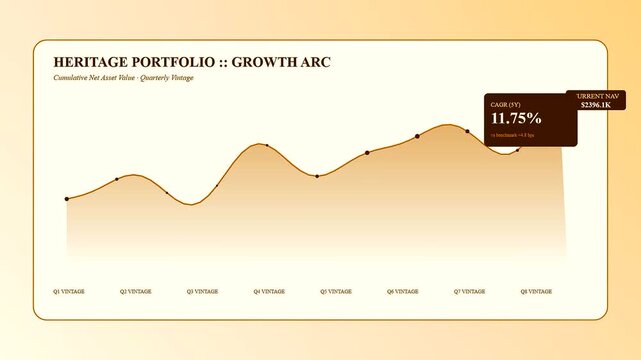
A sophisticated wealth management dashboard visually illustrating the growth arc of a heritage portfolio, detailing cumulative net asset value with quarterly vintage analysis for financial tracking.
00:06
HD
graph chart up down business statistics
00:06
HD
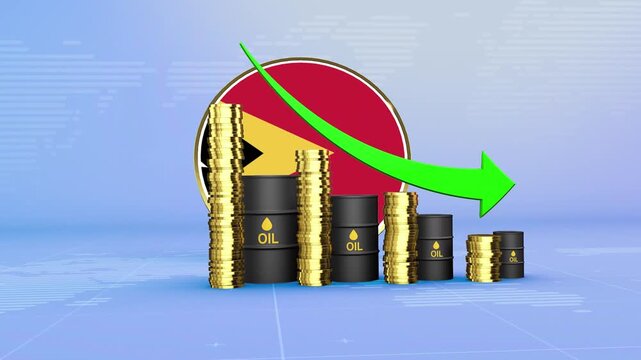
Timor Leste Oil Prices Decline with Oil Barrels, Gold Coins and Downward Green Arrow, 3D Economic and Financial Market Concept
00:11
HD
Declining bar chart with downward trend, Blue bar chart with falling line graph decline in business data, finance performance and analytics animation
00:07
HD
Download free with trialBusiness efficiency concept on black background. how much a company or organization can produce as it relates to time, cost and quality. motion graphics of increasing arrow.
00:15
HD
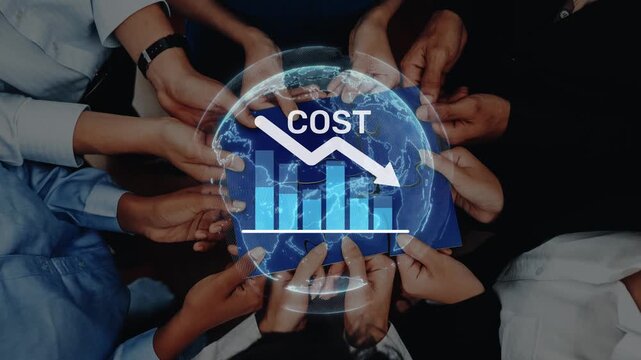
A diverse group of hands coming together to hold a graphic symbolizing cost reduction, featuring a downward trend and financial data in a global context. Raster
00:15
HD
Abstract neon arrow growth , success concept. Profit growing icon animation. Growing business graph symbol animation.
00:10
HD
animated of cost symbol dollar increase and decrease icon, money, dollar sign with arrow down. Money loss concept. Business loss. Cash with down arrow stocks graph, concept of financial crisis,
00:10
HD
Close-up of Scalp Inflammation with Hair Loss - A detailed close-up shot reveals a scalp affected by inflammation, showing red, irritated skin with several small bumps and sparse hair growth.
00:08
HD
Planning budget and income for secure savings and future investments, managing finances effectively for economic growth and stability
00:17
HD
Glowing blue business bar chart with downward arrow and declining line curve. Symbolizing revenue drop, financial loss, negative growth, market downturn 4K
00:07
HD
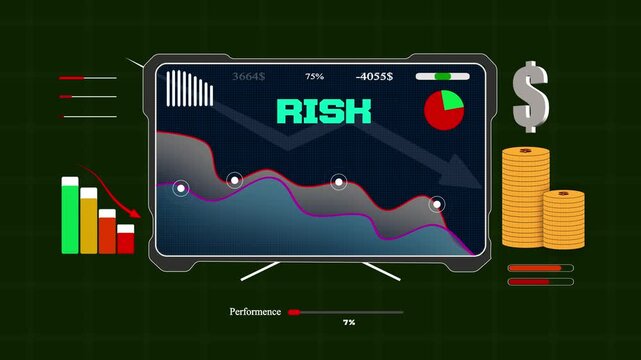
Modern electronic screen displaying professional risk metrics and decreasing charts for investment strategy and bank marketing
00:15
HD
Aquaponics Bio-Filtering Word Cloud
00:09
HD
CO2 cloud icon digital interface environmental data green field blue sky sustainability technology climate change renewable energy rural landscape carbon footprint nature environmental technology
00:08
HD
Green energy zero emission carbon co2 reduction graph charts,business virtual touch screen to show alternative energy growth.Corporate 4k video..Generative AI
00:15
HD
Stock market tickers with digital animation of the evolution of stock market prices. Normal financial chart of stock exchange data - 4K animation
00:15
HD
Twenty percent animation with green neon arrows. Twenty percent digital data visualization. Twenty percent financial growth graphic on black background.
00:07
HD
Business growth concept in graph chart showing marketing sales profit increasing to future target on white background. business graph success animation 4k video
00:10
HD
Autoimmune patients exploring holistic healing practices like functional medicine, detox, and stress reduction.
00:10
HD
focus level indicator scale. Low normal & high meter infographic animation. Showing high focus level color gauge indicator. on a white background 4k animation video
00:10
HD
business graph chart and success arrow indicating profit profit and loss business plan motion graphics.
00:10
HD
Bright white 3D number 2038 text animation floating against a deep black void offering a vibrant and modern visual for the year with a sense of digital energy.
00:10
HD
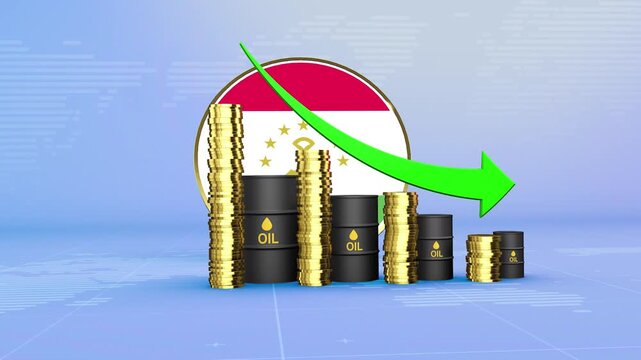
Tajikistan Oil Prices Decline with Oil Barrels, Gold Coins and Downward Green Arrow, 3D Economic and Financial Market Concept
00:11
HD
Red glowing data visualization on dark rough surface
00:10
HD