パスワード設定用のリンクを に送信しました。今後は、購入画面にアクセスする際にパスワードが必要になります。
制限なく作成可能 — 無制限のダウンロードと、強力な AI 編集機能
新しいフィルターが追加されました
並べ替え

ビデオ 内の decrease arrow の検索結果 13,054 件

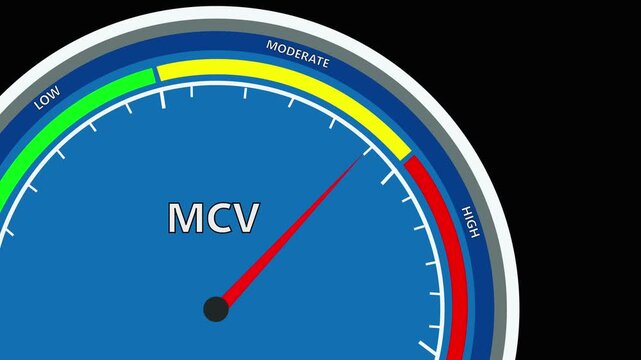
mcv speed  meter or indicator conceptual animation
00:10
HD
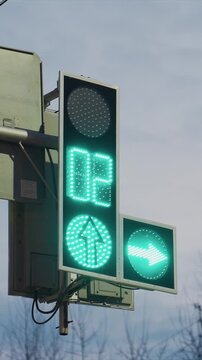
Green pedestrian countdown timer changes to yellow then red. sequence shows numbers decreasing from 04 to 52 with corresponding signal lights and arrows
00:19
HD
Financial crisis downtrend  graph animation video
00:06
HD
Vertical Red Down Arrow Overlay for **Social Media Description** Reels 4K
00:10
HD
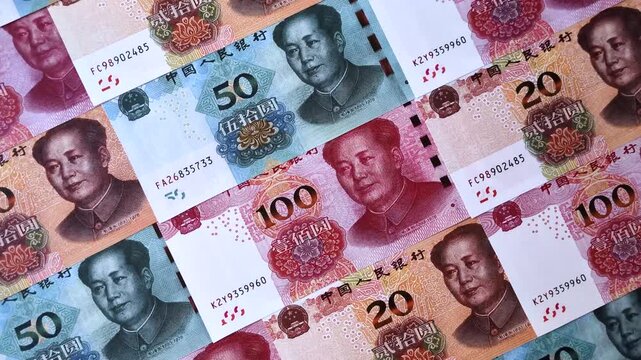
Chinese paper money, yuans in various denominations. China money as a business background for your design
00:17
HD
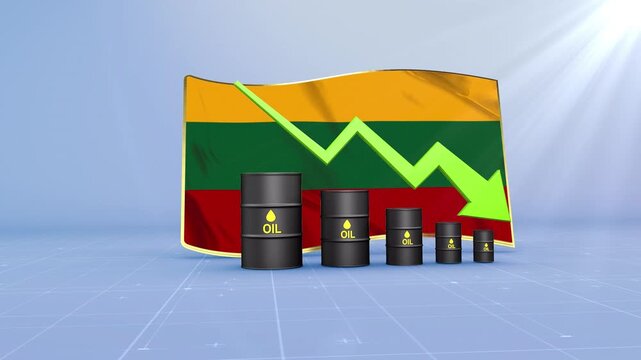
Lithuania Oil Price Falling with Oil Barrels Downward Green Arrow and 3D Financial Data Visualization Graphs for Economy and Business Concept
00:11
HD
Financial management system transforming high risk levels into minimized regulatory burdens and reduced financial exposure, protecting assets and ensuring business stability
00:17
HD
reliability index level indicator scale.Low normal high meter infographic animation on black background. Showing high pressure level color gauge indicator for health monitoring and safety analysis.4k
00:10
HD
line graph showing cost reduction and improving quality. Successful business strategy, efficiency, product optimization and management. Business steady growth concept with rising progress bar chart
00:10
HD
Animation of Black Wavy Downward Trend Line Graphic Symbol Isolated on Green Background
00:05
HD
Smog level indicator scale. Low normal & high meter infographic animation on black background. Showing high smog level color gauge indicator for air quality and environmental monitoring.
00:10
HD
Laptop with Business Chart and Growth Graph Animation Office Analytics Motion Graphic
00:05
HD
business revenue decline graph finance
00:10
HD
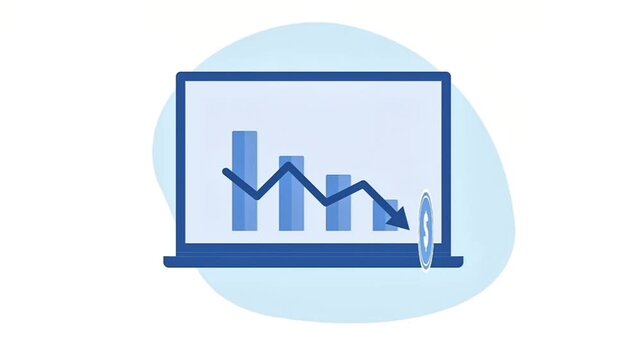
Laptop screen displays declining financial chart with arrow pointing down.
00:08
HD
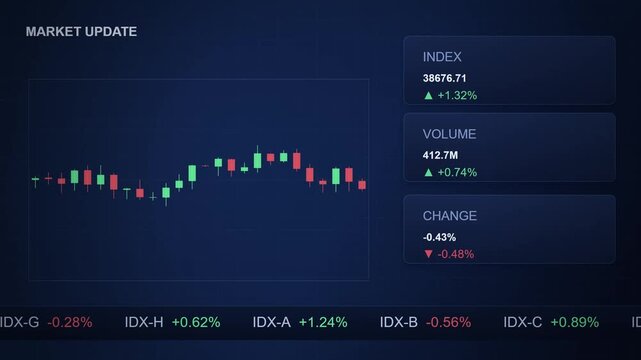
Financial dashboard featuring an animated candlestick chart, floating index cards with percentage arrows, and a scrolling ticker tape on a corporate blue backdrop.
00:10
HD
Business growth concept in graph chart showing marketing sales profit increasing to future target . growing business concept. animation
00:10
HD
​Pixelated white downward arrows continuously falling against a vibrant red background
00:12
HD
Financial growth and decline animation with green up arrow red down arrow and spinning gold dollar coin on green background
00:15
HD
Glowing neon Percentage growth and decline icon with up and down arrows. financial, business, and statistical analysis. Up and down percentage arrows icon. Perfect for reports and dashboards. 4k video
00:10
HD
Digital Business Decline Illustration Featuring Market Downturn on Laptop Screen with Decreasing Bar Chart and Financial Loss Trend
00:08
HD
 blue bar graph representing a cost reduction with a downward arrow and dollar sign indicating decreased expenses and financial savings on a dark grid backdrop .4k
00:10
HD
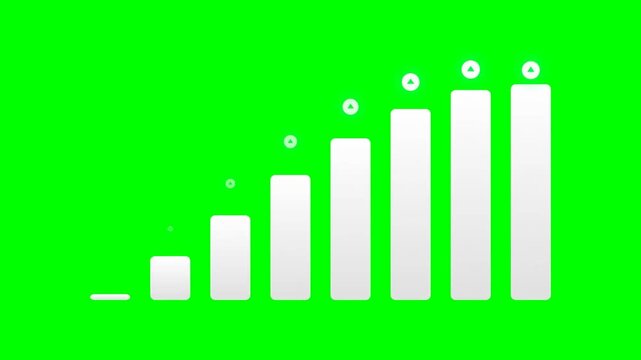
Animated White Bar Chart Showing Growth and Data Fluctuations on Green Screen for Business Statistics
00:05
HD
Black line icon of a dial weighing scale with up and down arrow signs representing weight change, scale calibration, load adjustment, and measurement
00:10
HD
Dynamic Flash Sale Promotion Banner with Lightning Bolt Icon and Progress Bar for Digital E-commerce Animation
00:08
HD
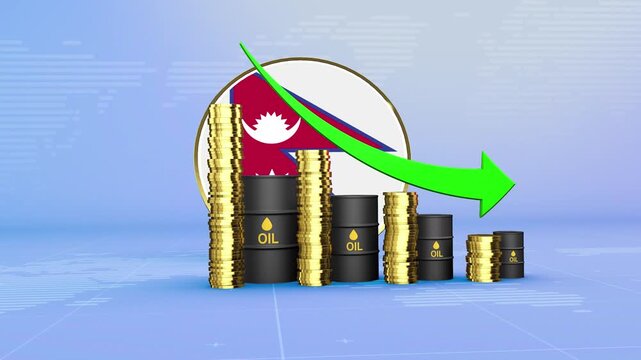
Nepal Oil Prices Decline with Oil Barrels, Gold Coins and Downward Green Arrow, 3D Economic and Financial Market Concept
00:11
HD
Oil Price Drop with Oil Barrels and Green Arrow, Economic Crisis Concept Oil Price Decreasing Animation
00:11
HD
Financial market analysis currency depreciation, inflation, and economic crisis concepts with charts, arrows, and coins, representing a challenging global economic period
00:17
HD
activity level level indicator scale.Low normal high meter infographic animation on black background. Showing high pressure level color gauge indicator for health monitoring and safety analysis.4k
00:10
HD
Descending finance bar chart with arrow animation, Descending values with curved trend lines and arrow, dollar symbols scattered
00:09
HD
Animated Comparison Graph Showing Increasing Quality and Decreasing Cost on Green Screen Background
00:10
HD
Business graph. loss graph direction. damage business graph. down business graph icon. business or finance concept icon animation.
00:07
HD
Financial distress animation on a digital monitor showing high-tech revenue analytics and profit decline for corporate marketing reports
00:15
HD
Cost wording on decrease money with down arrow. Cost Management, Economy recession, low budget, Effective business, black 4k
00:10
HD
Neon green financial line graph animation showing economic recession with falling dollar currency symbols representing market crash and loss.
00:10
HD
Neon money bag with dollar symbol and downward arrow animation in pink and green on black background, finance crisis, economic downturn, financial loss, or currency depreciation
00:07
HD
Oil Price Decline and Falling Energy Market Value Illustrated by Multiple Oil Barrels with Downward Arrows, Representing Lower Crude Prices, Market Pressure, Supply Dynamics, and Economic Impact
00:10
HD
Pressure level indicator scale. Low normal high meter infographic animation on black background. Showing high pressure level color gauge indicator for health monitoring and safety analysis.
00:10
HD
Chinese paper money, yuans in various denominations. China money as a business background for your design
00:10
HD
Yellow neon art presenter beside board with graph person icon and decreasing arrow
00:08
HD
Downward Trending Red Arrow and Bar Chart Analytics Animation
00:05
HD
Price Drop Discount Animation with Shopping Box and Falling Coins on Green Screen Background
00:08
HD
Global economic crisis concept featuring a globe, money symbol, and red downward arrow representing financial decline and market instability.
00:10
HD
Neon style cryptocurrency data diagram animation for stock market analysis video
00:08
HD
Business concept: reducing cost while increasing financial growth and optimization strategy, infographic animation for corporate presentations
00:10
HD
Cuba Oil Prices Decline with Oil Barrels, Gold Coins and Downward Green Arrow, 3D Economic and Financial Market Concept
00:11
HD
Digital screen displaying a financial interface with a descending line graph and bar charts, indicating a stock market crash, economic recession, and a bearish market with falling prices
00:10
HD
Market volatility risk exposure concept financial instability, falling currency value, and potential loss in investments through dynamic charts and warning signals
00:17
HD
impact score level indicator scale.Low normal high meter infographic animation on black background. Showing high pressure level color gauge indicator for health monitoring and safety analysis.4k video
00:10
HD
Quality improvement and cost reduction concept with blue quality line rising and red cost line falling. Concept of business strategy, management, efficiency and performance optimization
00:12
HD
down-directional red arrow loop animation with shadow on white background ideal for business, investment, financial, and failure. Arrow icon concept animation, arrows sign down
00:10
HD
Business graph. loss graph direction. damage business graph. down business graph icon. business or finance concept icon animation.
00:07
HD
Decrease icon for Reduce cost sign concept with dollar and down arrow animation on a white background. Dollar rate up to down looped sign and symbol icon animation concept
00:08
HD
Bar chart showing descending bars with downward arrow animation
00:06
HD
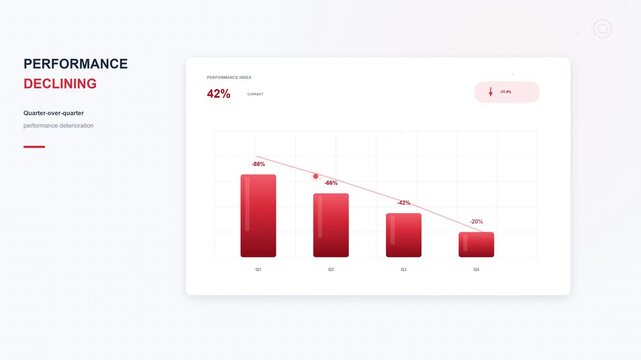
Animated Financial Chart Showing Quarterly Business Decline
00:10
HD
Financial market crash with downward red arrow, dynamic camera movement following stock chart decline
00:10
HD
3D blue arrow pointing downward with a white percentage symbol, representing decreasing rates, financial discounts, or economic decline against 4K stock animation video on a green screen background.
00:10
HD
efficiency level indicator scale. Low normal & high meter infographic animation. Showing high efficiency level color gauge indicator. on a black background 4k animation video
00:10
HD
Graph chart showing marketing sales profit increasing.Background Business 4k video icon
00:10
HD
Laptop screen shows declining coins and downward arrow graphic.
00:08
HD
Animated white dollar sign icon with downward arrow, business recession concept, financial loss symbol, chalk style motion graphic on Alpha channel, isolated, commas.
00:07
HD
Minimum profit levels illustrated on an electronic screen representing long term budget cuts and capital risk adjustments
00:15
HD
Algeria Crude Oil Price Drop with Oil Barrels Downward Green Arrow and 3D Financial Data Visualization Graphs for Economy and Business Concept
00:11
HD
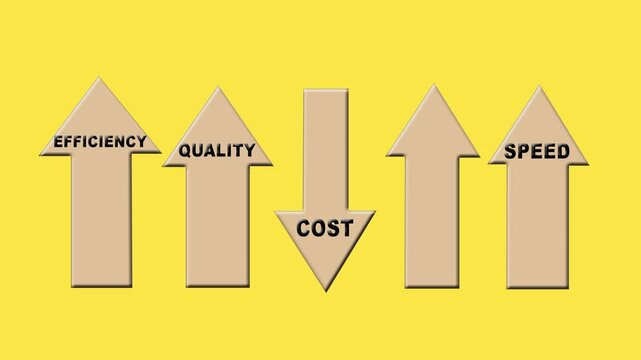
Business optimization concept. increasing efficiency, and speed while reducing costs
00:08
HD
3D White Arrows Falling Down Rain Particle Animation on Green Screen Background Chroma Key
00:15
HD
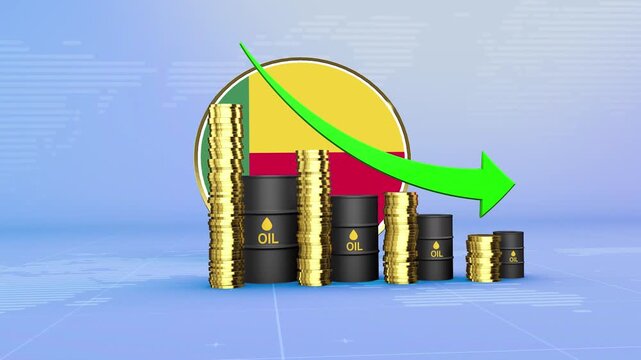
Benin Oil Prices Decline with Oil Barrels, Gold Coins and Downward Green Arrow, 3D Economic and Financial Market Concept
00:11
HD
Red Downward Arrow Animation for Economic Decline – Vertical Format with Alpha Channel
00:06
HD
White dollar sign graph showing a downward trend. money financial loss and economic downturn shown.
00:10
HD
alert status level indicator scale.Low normal high meter infographic animation on black background.Showing high pressure level color gauge indicator for health monitoring and safety analysis.4k
00:10
HD
Green Rectangle Highlighted by Red Vertical Arrows Indicating Compression or Focus
00:08
HD
Line icon of a group of people beneath a downward falling arrow representing team decline business loss and steadily falling overall performance level
00:10
HD
Policy level indicator scale. Low normal & high meter infographic animation on black background. Showing high policy level color gauge indicator for business governance and management analysis.
00:10
HD
3D euro symbol with down arrow
00:10
HD
Orange Down Arrow Animation with Downward Directional Indicator Movement on Green Screen Chroma Key Seamless Loop Motion Graphics
00:10
HD
Bear Market and Economic Crisis Concept with Broken Dollar Coin and Falling Arrow cartoon animation
00:10
HD
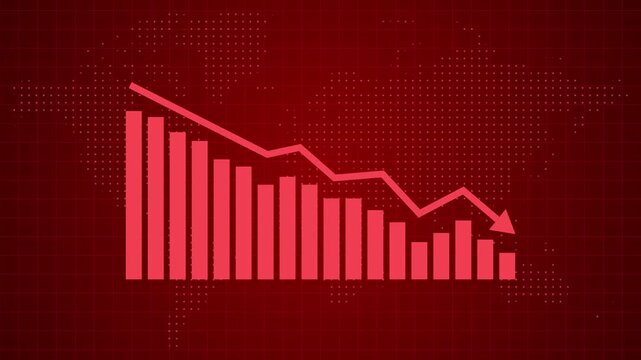
Red bar graph metrics track economic inflation drops across a world map. Financial market asset risk overviews look crisp using this data charting bar graph dashboard. Graph statistics decline.
00:12
HD
Business growth concept in graph chart showing marketing sales profit increasing to future target . growing business concept. Clean Hi-tech style technology chart
00:10
HD
potassium k level indicator scale. Low normal & high meter infographic animation. Showing high ptassium k level color gauge indicator. on a white background 4k animation video
00:10
HD
Declining Money Value and Financial Loss Illustrated by Stacks of Coins with Downward Arrows, Representing Falling Currency Value, Reduced Wealth, Market Decline, Inflation, and Economic Pressure
00:10
HD
Analyzing continuous financial returns, income, and business investments over time, balancing profitability with potential financial risks
00:17
HD
Commercial oil barrels track falling international market demand. Standard oil barrels visualize global fuel commodities trading loss metrics. Resource economic crisis using classic oil barrels.
00:11
HD
Animated Trio of Neon Arrows Pointing Downwards on Chroma Key Green Screen for Video Production
00:08
HD
Neon glowing down arrow with number 36 in futuristic digital style on black background on Black Background and features 4k Animation video
00:10
HD
Animated bar chart showing growth and decline metrics
00:10
HD
bank interest rates
00:06
HD
Paraguay Oil Prices Decline with Oil Barrels, Gold Coins and Downward Green Arrow, 3D Economic and Financial Market Concept
00:11
HD
Animated Three Red Arrows Pointing Down with Bounce Effect - Green Screen Chroma Key
00:15
HD
Business loss concept line graph falling down animation. financial loss graph chart line art animation.
00:08
HD
reputation score level indicator scale. Low normal high meter infographic animation on black background. Showing high pressure level color gauge indicator.4k animation video
00:10
HD
Declining oil prices with falling barrels and downward arrow animated video on transparent background showing market downturn, price drop, reduced demand, and economic decline concept
00:05
HD
North Ossetia Alania Country Flag and Bar Chart Graph Showing Decreasing Values a Red Arrow Economic Crisis Concept
00:11
HD
COVID-19 risk level indicator scale. Low normal & high meter infographic animation on black background. Showing high COVID-19 level color gauge indicator for public health and disease monitoring.
00:10
HD
Animated green chart of financial decline with a trend line chart. Economic crisis, recession, decrease graph. Bar chart. Profit down. Vector illustration isolated on white background.
00:06
HD
reflection Bar graph display continued growth of products and services
00:14
HD
Self-Actualization indicator scale. Low Normal High meter infographic animation on black background. Showing high self-actualization level color gauge indicator for personal growth and well-being.
00:10
HD
Animated dollar cash banknote declining icon on black background. Depicting cash banknote with downward arrow. Value dollar falling icon for economic decline and financial market concepts
00:10
HD
abstract business graph chart icon animation .Animated arrow growth up and down icon on background.
00:10
HD
zinc level indicator scale. Low normal & high meter infographic animation. Showing high zinc level color gauge indicator. on a black background 4k animation video
00:10
HD
Cyan Bar Chart with Downward Trend Arrow on Grid Background graph decline
00:12
HD
Curved White Minimalist Decline Arrow Animation on Green Screen Background
00:10
HD
Neon icon showing business decline with downward arrows and briefcase shape on black background
00:08
HD