パスワード設定用のリンクを に送信しました。今後は、購入画面にアクセスする際にパスワードが必要になります。
制限なく作成可能 — 無制限のダウンロードと、強力な AI 編集機能
新しいフィルターが追加されました
並べ替え

ビデオ 内の decrease arrow の検索結果 13,054 件

Blue Neon Arrows and Bar Chart on Black Background up arrow down arrow
00:10
HD
Red Neon Bar Graph with Downward Trend Arrow on Black Background chart bar chart
00:10
HD
network quality level indicator scale. Low normal high meter infographic animation on black background. Showing high pressure level color gauge indicator.4k animation video
00:10
HD
Bangladesh Crude Oil Price Decline with Oil Barrels and Downward Green Arrow
00:11
HD
Massive Financial Loss Animation with Decreasing Red Dollar Thousands (K) and Falling Chart Arrow on Black Background
00:05
HD
battery level indicator scale. Low normal & high meter infographic animation. Showing high battery level color gauge indicator. on a black background 4k animation video
00:10
HD
Health risk level indicator scale. Low normal & high meter infographic animation on white background. Showing high health risk level color gauge indicator for wellness and safety monitoring.
00:10
HD
Budget reduction animation on a digital monitor showing steady financial decline for maintaining long term corporate adjustments
00:15
HD
graph with arrow
00:08
HD
Decreasing Bar Graph Chart With Downward Arrow On Black Background Animation
00:12
HD
Falling Chart Digital Line Graph Animation Red Arrow Down Financial Market Crash Economic Recession Data Visualization 4K Video
00:10
HD
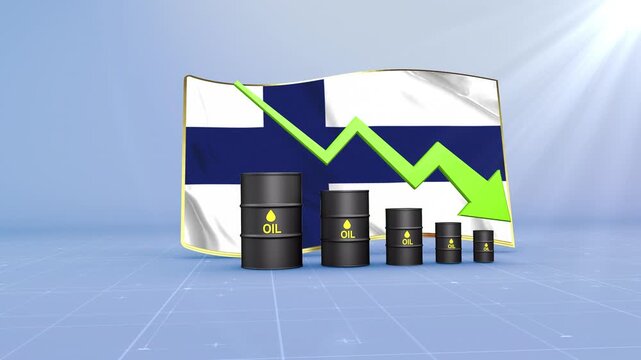
Finland Oil Price Falling with Oil Barrels Downward Green Arrow and 3D Financial Data Visualization Graphs for Economy and Business Concept
00:11
HD
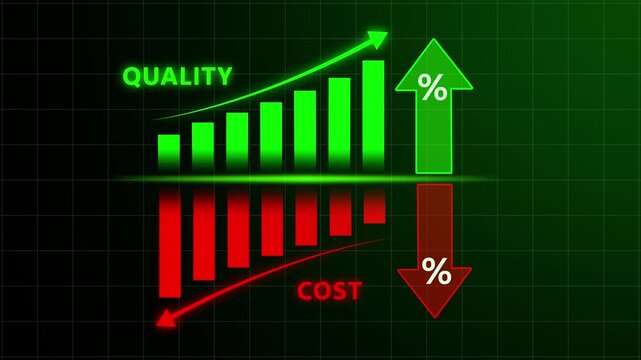
Abstract graph showing quality increasing and cost decreasing with percentage symbols and bar chart animation on black background. Percentage quality with up arrow, cost with down arrow. 4k video.
00:10
HD
Icon representing falling oil prices with a dollar sign and downward arrow
00:06
HD
Red down arrow icon animation
00:05
HD
Economic Recession Concept with Stacks of Gold Bars and Declining Red Arrow
00:10
HD
Neon cost reduction icon animation. Dollar down icon. Low price dollar concept. Cash with down arrow stocks graph, concept of financial crisis, market fall.4k Animation video on Black Background
00:10
HD
CO2 Emission and Reduction Icon Animation. Of carbon emission Arrow icon drawing on and fading out. Features On White Background.
00:08
HD
Animated white down graph icon designed in flat icon style. Finance, Business Info graphic animation on black background
00:10
HD
Minimalist black and gray chevron arrows animation loop on withe background, vertical downward direction pointer, flat scroll down or download sign, abstract motion graphics interface element.
00:10
HD
Quality increase and cost optimization for products or services to improve customer satisfaction and enhance company performance. Successful corporate strategy and management. Effective business.4k
00:10
HD
Glowing Animation of up and down business graph icon. down to up arrow. business growth arrow and graph chart, Bad Economy Recession Graph Chart . 4k video
00:10
HD
Animated Goal Achievement Gauge: Visualize Goal Completion from Low to High Levels with Dynamic Meter, Comparison Metrics, Performance Insights, and Motion Animation
00:10
HD
Timor Leste Oil Prices Decline with Oil Barrels, Gold Coins and Downward Green Arrow, 3D Economic and Financial Market Concept
00:11
HD
Business growth concept in graph chart showing marketing sales profit increasing to future target . growing business concept.
00:10
HD
calcium level indicator scale. Low normal & high meter infographic animation. Showing high calcium level color gauge indicator. on a white background 4k animation video
00:10
HD
Business down decrease concept in allusive graph chart showing marketing sales profit decrease to future target . Financial status of corporate business downward.
00:10
HD
Low-margin profit tracking visualized on a high-tech monitor illustrating tight financial limits and business revenue contraction
00:15
HD
Business growth concept in graph chart showing marketing sales profit increasing to future target . growing business concept. animation
00:10
HD
Abstract decrease icon on green background. Euro rate down looped icon. Reduce costs sign and symbol.
00:06
HD
Business strategy visualizing annual operational savings, managing financial risks, and achieving cost reduction through budgeting, planning, and automated efficiency, aiming for profit growth
00:17
HD
Swaziland Oil Price Falling with Oil Barrels Downward Green Arrow and 3D Financial Data Visualization Graphs for Economy and Business Concept
00:11
HD
weather level indicator scale. Low normal & high meter infographic animation. Showing high weathe level color gauge indicator. on a black background 4k animation video
00:10
HD
White arrow arching smoothly downward to the right on a vibrant green chroma key background. Ideal for motion graphics, presentations, and marketing content to indicate direction, decrease, or flow.
00:05
HD
Cost icon striking design
00:10
HD
Glowing neon decrease chart with dollar icon representing recession or financial loss
00:08
HD
Animated red dollar icon with downward arrow. Circular financial symbol. Black and green screen chroma key background.
00:10
HD
neon two ways arrow icon animated video
00:07
HD
Purple Down Arrow Animation with Downward Directional Indicator Movement on Green Screen Chroma Key Seamless Loop Motion Graphics
00:10
HD
nutrition score level indicator scale. Low normal high meter infographic animation on black background. Showing high pressure level color gauge indicator.4k quality animation video
00:10
HD
Countdown Clock Motion Graphics with Smooth Time Reduction Visualization
00:12
HD
Watch icon spinning, clock animation on transparent background with alpha channel. Clock icon flat style 24 hours day fast speed with of clock concept 4k video.
00:30
HD
Countdown timer with grey circular progress ring dot indicator and white digital display on dark background
00:30
HD
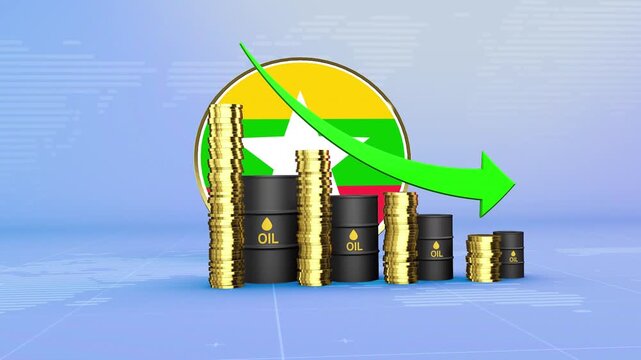
Myanmar Oil Prices Decline with Oil Barrels, Gold Coins and Downward Green Arrow, 3D Economic and Financial Market Concept
00:11
HD
Graph chart downtrend symbol graph - success. colored diagram. Graph showing rising arrow. Success arrow growth.
00:10
HD
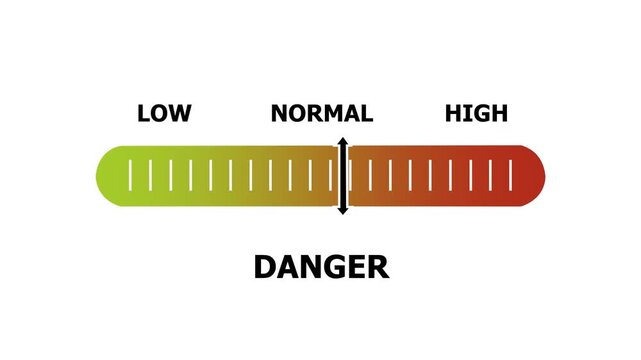
danger level indicator scale. Low normal & high meter infographic animation. Showing high danger level color gauge indicator. on a white background 4k animation video
00:10
HD
Fire danger level indicator scale. Low normal & high meter infographic animation on white background. Showing high fire danger level color gauge indicator for safety and risk monitoring.
00:10
HD
Decrease in profit on a digital monitor showing steady financial decline for maintaining long term corporate budget adjustments
00:15
HD
Line art success graph icon animation. Finance and business, Financial report. Financial analysis icon. Animated line growth and decrease diagram.
00:05
HD
Simple Left transition animation.Left text animation on black background in 4k.
00:06
HD
Decreasing financial costs for currency exchange and banking services, opportunities for saving money and improving financial efficiency
00:17
HD
Bahamas Crude Oil Price Drop with Oil Barrels Downward Green Arrow and 3D Financial Data Visualization Graphs for Economy and Business Concept
00:11
HD
A neon down business graph icon displays a glowing, downward-sloping line or bar chart, symbolizing decline, loss, or negative trends. The vibrant neon effect adds a modern, striking, and dynamic .
00:10
HD
Financial Loss Chart Line Icon. Animated line art graph showing downward trend and dollar coin for bankruptcy price drop and market loss animation. business loss concept animation.
00:06
HD
Green bar graph animation dynamic stock market decline recession financial crisis data visualization. Dynamic green bar graph chart stock market decline financial crisis recession downward arrow.
00:06
HD
Animated dollar coins decreasing from a stack
00:10
HD
The sales graph is going down, the profit graph is going down, the downfall graph is going down, the arrow graph is going down
00:07
HD
Blue and green arrows moving in opposite direction over the grid. Abstract arrows floating up and down in glowing neon lights depicting growth and crash mechanics in digital technology market concept
00:08
HD
Bar chart graph data animation displays falling financial sales lines. Chart graph monthly performance grid features a downward trend arrow. Data animation layout loops perfectly for video.
00:12
HD
progress status level indicator scale. Low normal high meter infographic animation on black background. Showing high pressure level color gauge indicator.4k quality animation video
00:10
HD
Animated green down graph icon designed in flat icon style. Finance, Business Info graphic animation on black background. 4k video
00:10
HD
Bar chart and globe showing global economic decline. Business loss symbol for international market crisis. Digital world chart animation for finance.
00:06
HD
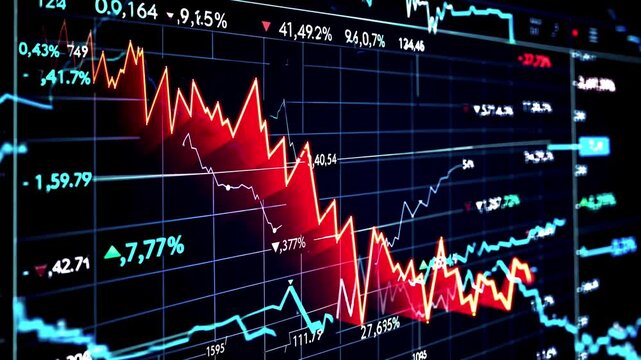
Chart candlestick downtrend crisis crash bankruptcy, low lost market stock trading trade loss negative, financial economy decay graph recession business decrease
00:20
HD
Spain Oil Prices Decline with Oil Barrels, Gold Coins and Downward Green Arrow, 3D Economic and Financial Market Concept
00:11
HD
Neon purple money bag with downward arrow icon symbolizing financial loss economic downturn
00:08
HD
Iodine level indicator scale. Low normal high meter infographic animation on black background. Showing high iodine level color gauge indicator for nutrition and thyroid health monitoring.
00:10
HD
Shiny purple 3d arrow icon pointing down next to a bar chart symbol representing financial decline or loss
00:05
HD
Inflation indicators on a digital display screen showing rising economic pressure and capital purchasing drops
00:15
HD
trans fat level indicator scale. Low normal & high meter infographic animation. Showing high trans fat level color gauge indicator. on a white background 4k animation video
00:10
HD
Acid rain level indicator scale. Low normal & high meter infographic animation on black background. Showing high acid rain level color gauge indicator for environmental pollution atmospheric.
00:10
HD
Business people collaborating and aiming for environmental sustainability goals, achieving zero emissions, and reducing carbon footprint through strategic planning and action
00:17
HD
Libya Oil Price Falling with Oil Barrels Downward Green Arrow and 3D Financial Data Visualization Graphs for Economy and Business Concept
00:11
HD
Decreasing trend showing unsuccessful performance and losses failure due to economic crisis. Candles of stock market, price falls. Falling prices. Loss economic crisis
00:10
HD
Graph with decrease, financial collapse animation, inflation crisis, global economic recession chart, profit loss, business bankruptcy, world map in red background
00:08
HD
Cash flow Meter Animation.Measuring Cash flow from Low to High Levels.Increasing and Decreasing Gauge from low to high Levels, Comparison Indicator for Data Visualization, perfomance, and Motion
00:10
HD
Work Safety Level Text or Word Low and Medium to High Meter Concept Animation on Black Background and Blue Screen
00:58
HD
Economic crisis concept and digital indicators overlap with destroyed city background
00:10
HD
Minimal red button icon with up and down arrows on a dark background, symbolizing control, direction, navigation, increase and decrease actions in a digital interface.
00:12
HD
Blue Neon Outline of Bar Chart with Upward Trend and Downward Arrow on Black Background graph statistics
00:10
HD
Set of Minimal Bar Charts, Financial Business Analytics, Performance, growth, loss, profit, decrease, increase, random data, motion graphic on a transparent background, alpha channel
00:31
HD
Neon costs reduction text icon glows, letters animate with downward pulse and flicker, modern finance tech style, dark background, clean loop, futuristic efficiency motion visuals.
00:10
HD
down arrow animation showing downward movement. Red arrow symbolizes alert, download, or decrease. Blinking directional arrow animation, arrow direction sign on black background.
00:10
HD
Money loss concepts. Arrow and dollar stocks graph, the stock price falls,  neon down arrow stocks graph with black background.
00:10
HD
Ireland Oil Prices Decline with Oil Barrels, Gold Coins and Downward Green Arrow, 3D Economic and Financial Market Concept
00:11
HD
Falling Chart with Arrow Animation, Animated Financial Crisis Chart with Trend Line Graph, Down business graph icon animation on black background.footage of Graph showing fluctuate downward trend.4k
00:10
HD
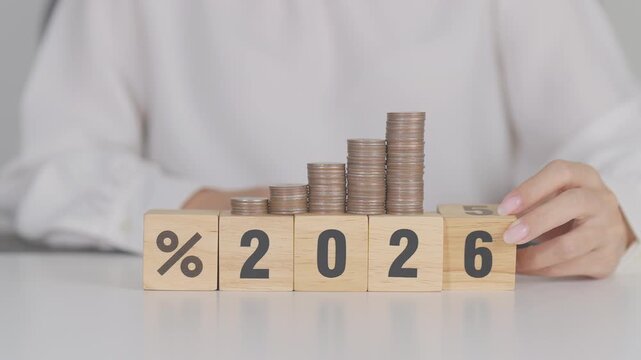
2026 New year with percentage change to UP and Down arrow with coin stack. Interest rate, GDP, stocks market, financial, deflation and Inflation, mortgage, debt, Loan and Economic Recession
00:09
HD
Red Downward Arrow: Symbol of Market Decline and Financial Loss
00:10
HD
Business data analysis graph with decreasing trend line and blue bars on black background with orange dots
00:10
HD
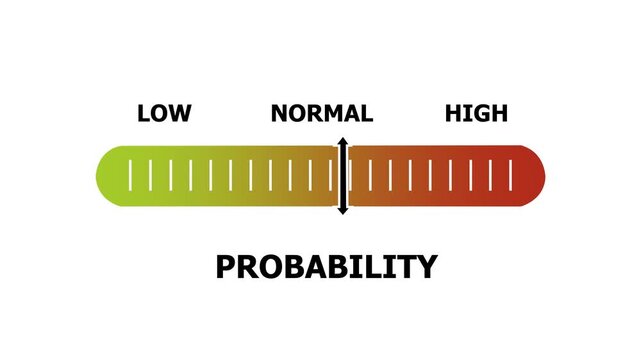
probability level indicator scale. Low normal & high meter infographic animation. Showing high probability level color gauge indicator. on a white background 4k animation video
00:10
HD
glowing neon Percentage growth and decline icon with up and down arrows. financial, business, and statistical analysis. Up and down percentage arrows icon. Perfect for reports and dashboards 4k.
00:10
HD
Business process having financial risks, showing an operational challenge impacting profit, and the potential for a monetary decrease due to internal or external factors
00:17
HD
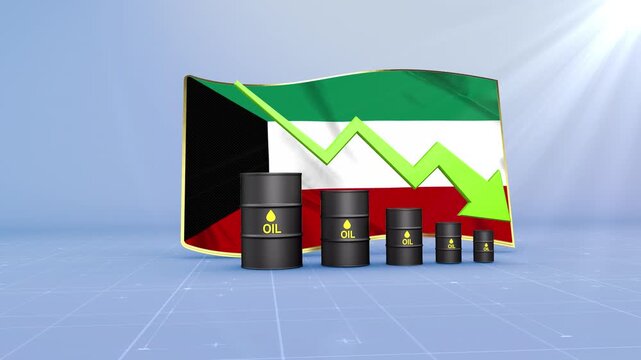
Kuwait Oil Price Falling with Oil Barrels Downward Green Arrow and 3D Financial Data Visualization Graphs for Economy and Business Concept
00:11
HD
Animated business infographic chart showing decrease in profits and financial decline. 4k financial diagram with appearing animated descending arrow, bar stats, lines and digital effects. Business
00:05
HD
Animated green arrow. Recession chart of economy. Economic crisis, recession, decrease graph. Profit down. Vector illustration isolated on white background.
00:07
HD
White Financial growth decrease icon isolated on blue background. Increasing revenue. 4K Video motion graphic animation
00:18
HD
Volume Level Text or Word Low and Medium to High Meter Concept Animation on Black Background and Blue Screen
00:58
HD
Arrow continuous line 4K animation video showing downward direction on a minimal background
00:10
HD
Red Arrow Graph Showing Downward Trend and Decline in Business Performance.
00:11
HD
business chart falling down animation
00:15
HD
Comparison simple Bar Charts, Financial Business Analytics, Performance, growth, loss, profit, random data, up and down, motion graphics on an abstract background
00:07
HD