パスワード設定用のリンクを に送信しました。今後は、購入画面にアクセスする際にパスワードが必要になります。
制限なく作成可能 — 無制限のダウンロードと、強力な AI 編集機能
新しいフィルターが追加されました
並べ替え

ビデオ 内の analytics graph の検索結果 191,682 件

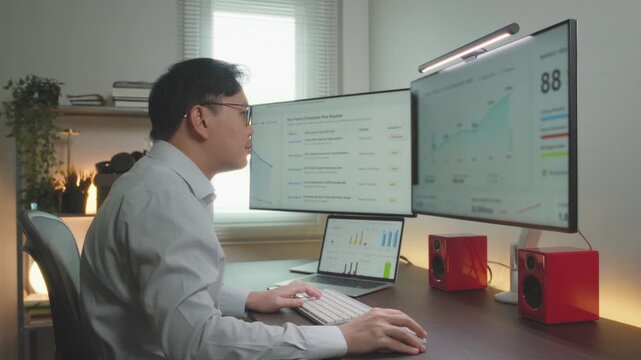
Side Profile Portrait of Stockbroker at Desk Looking at Computer Screens Showing Stock Exchange Data, Equity Charts, Investment Analytics, Asset Management, Financial Graphs to Track Market Trends
00:16
HD
A captivating visualization of dynamic financial growth featuring rising graphs against a city skyline backdrop, representing economic trends and market insights. Copula
00:10
HD
Analytics dashboard interface showing revenue charts user metrics and traffic data visualization
00:10
HD
Digital line graph tracks upward moving corporate revenue. Interactive line graph demonstrates successful financial forecasting. Economic growth concept with corporate line graph.
00:10
HD
Business intelligence and financial performance analysis report on white background, animated infographic bar chart, investment data analytic graph dashboard, success corporate market statistics trend
00:20
HD
Data Analyst analyze Data Financial Dashboard and Touch screen Monitor.
00:13
HD
Business meeting with laptop displaying analytics dashboard charts, graphs in corporate office. Professional team presentation, data visualization statistics, performance reporting, strategy planning
00:09
HD
Business team analyzing financial data and marketing strategy
00:20
HD
Finance growth chart graph stock market upward data analysis business abstract background with rising green line over bar graph showing market trend investment statistic concept digital chart
00:10
HD
Futuristic Data Analytics Dashboard Screen digital dashboard displaying charts, graphs, statistics, analytics interface. for finance visuals, business reports, corporate presentations, data analysis
00:19
HD
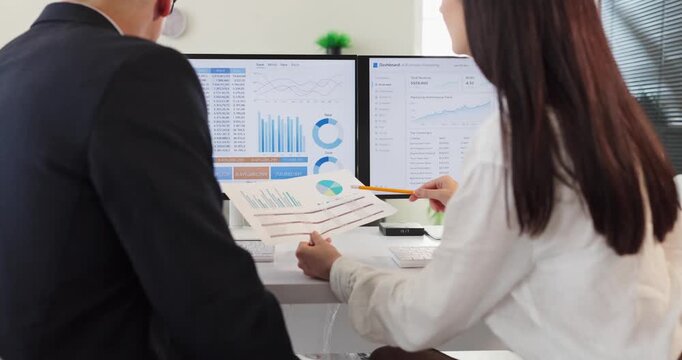
A detailed view of hands on a laptop and paperwork, colleagues collaborating over data charts in a fast-paced office meeting.
00:15
HD
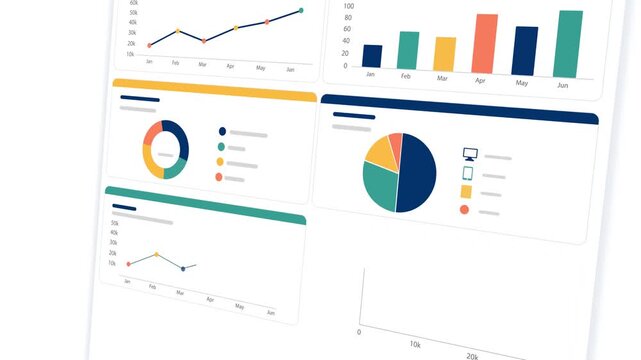
Business analytics dashboard with moving line chart, donut chart and bar graphs seamless loop, data visualization and reporting animation
00:06
HD
Abstract digital project management board with interactive task cards and notifications on a dark purple background
00:10
HD
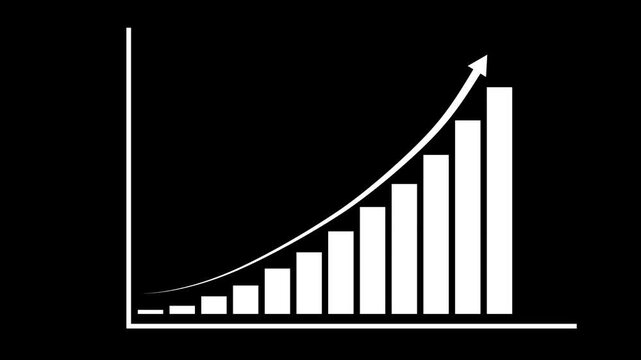
Minimalist Animated Financial Graph Showing Upward Trend on Black Background
00:10
HD
Trade business analytics graph and financial chart, blue stock market investment, , market business and exchange financial growth
00:20
HD
Futuristic digital data interface with abstract blue dashboard, ideal for big data, tech analysis, cybersecurity, and innovation themes. Technology data background
00:20
HD
Monitoring social media follower growth and content engagement performance metrics on an interface. Concept of channel optimization, audience reach, and analytics dashboard.
00:12
HD
A detailed overview of a dark-mode Industry 4.0 command center dashboard featuring real-time OEE metrics, production line status, and KPI cards in a corporate environment.
00:15
HD
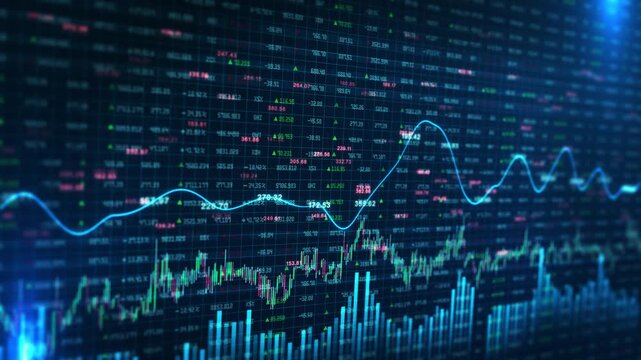
Stock market ticker terminal screen showing multiple live trading graphs and financial charts
00:30
HD
Financial chart background with rising bar graph and candlestick market data showing growth profit and upward trend animation
00:10
HD
Top Down View of Corporate Team Working Around Conference Table With Laptops and Documents as Linked Visualization Layer Appears, Glowing Ai Icons Represent Cloud Storage, Cybersecurity and Analytics.
00:12
HD
Explore a modern workspace showcasing advanced data analytics and cognitive technology with digital dashboards. Perfect for illustrating business strategy and innovation. Raster
00:20
HD
Data flow streams converging into a live analytics dashboard with radar chart, bar graphs and system load
00:16
HD
Business colleagues collaborating on a financial report, analyzing marketing data charts, and discussing company investment strategy during a corporate meeting in the office
00:22
HD
woman analyst uses a computer AI artificial intelligence and dashboard for data business analysis and Data Management System with KPI and metrics connected to the database for technology finance,
00:10
HD
Animated horizontal line chart with glowing area fill showing positive business growth trajectory on dark background
00:08
HD
Business intelligence and financial performance analysis report on white background, animated infographic bar chart loop, investment data analytic graph dashboard, enterprise market statistics trend
00:14
HD
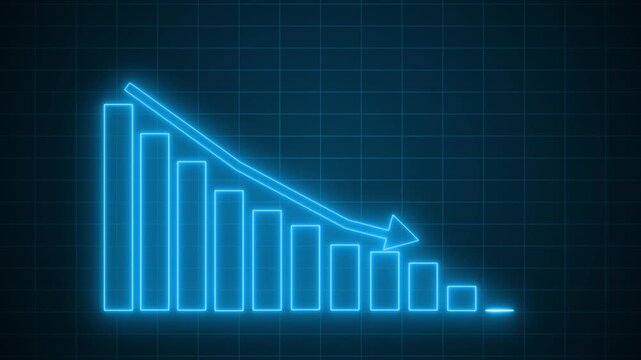
Neon-style bar chart showing descending bars with downward arrow animation
00:10
HD
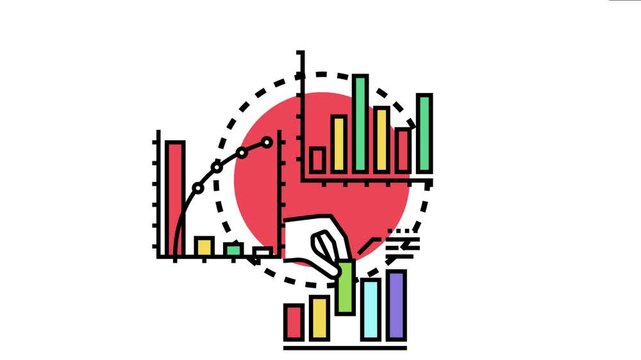
Hand placing a bar on a chart while displaying various types of graphical representations, concepts of data analysis, financial growth, and business strategy
00:17
HD
Financial Stock Chart Market Analysis Data Visualization financial data trends, price movement, analytics indicators. trading visuals, investment strategies, economic reports, fintech presentations.
00:20
HD
Digital analytics data background, glowing blue lines, dots, graphs, network. Represents business intelligence, financial growth, technology, innovation. Concept of big data, global communication
00:20
HD
Digital data graph with glowing blockchain network and modern finance technology background
00:10
HD
Hands working on a smartphone while graphs and icons are displayed on a screen representing data and analytics in business settings
00:10
HD
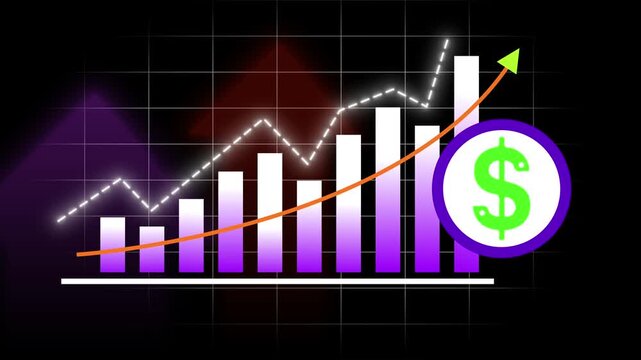
A vibrant red bar graph with a sharp upward trending curved arrow against a solid black background representing financial success and economic advancement
00:10
HD
Trade business analytics graph and financial chart, blue stock market investment, , market business and exchange financial growth
00:20
HD
Fraud Analyst Reviews Real-time Transaction Patterns
00:21
HD
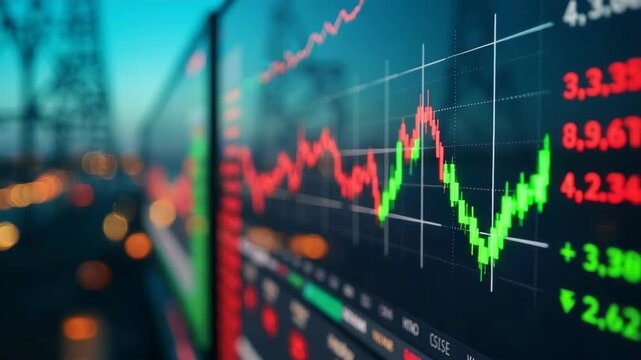
Close-up of financial charts displaying stock market data on a digital screen. Dynamic red and green graphs represent fluctuating stock prices in a modern trading environment.
00:10
HD
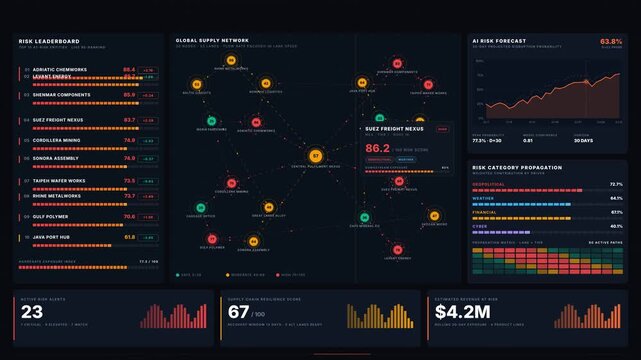
A dark-mode 4K risk analytics command screen showcases a global supply chain network graph with glowing nodes and animated risk indicators, highlighting potential disruptions and KPIs.
00:15
HD
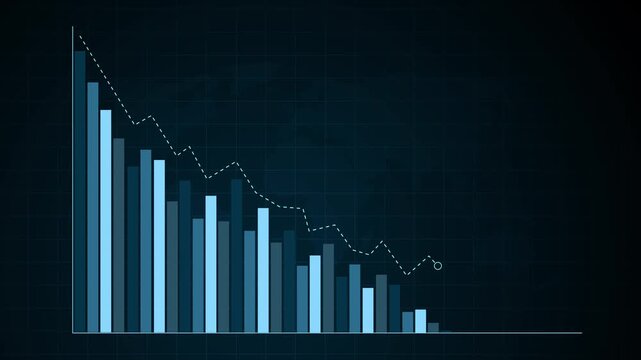
Declining bar chart with downward trend, Blue bar chart with falling line graph decline in business data, finance performance and analytics animation
00:07
HD
Businessman analyzing financial charts, counting coins, and using a calculator to evaluate asset sales and profits.
00:23
HD
Top Down View Corporate Office With Multiethnic Workers at Computer Stations as Linked Visualization Layer Appears, Glowing Blue AI Icons, Cybersecurity, Connectivity and Workflow Automation.
00:10
HD
Data analytics tools and visualizations showcasing diverse colorful charts, graphs, and metrics for business decision-making and strategic planning Sigmoid
00:20
HD
Business Innovation Light Bulb with Startup and Growth Icons
00:09
HD
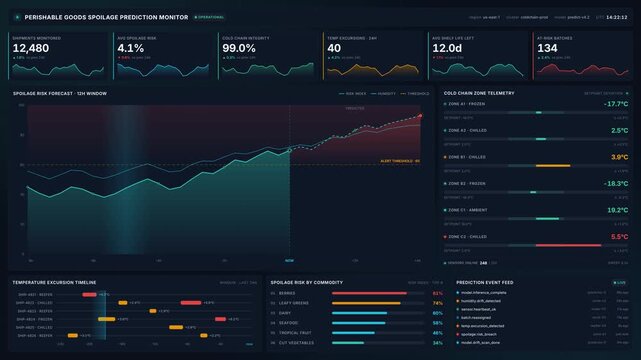
4k perishable goods spoilage prediction monitor dashboard with analytics, graphs, live telemetry data, for supply chain management logistics technology
00:20
HD
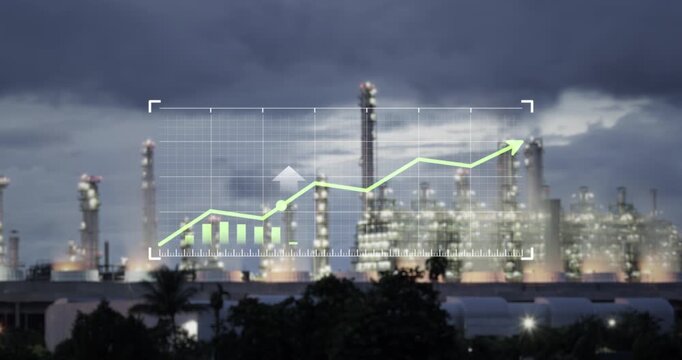
Financial chart overlays power plant and oil refinery, symbolizing global energy economic growth. Represent rising market prices, increased production and demand for petroleum and power generation.
00:18
HD
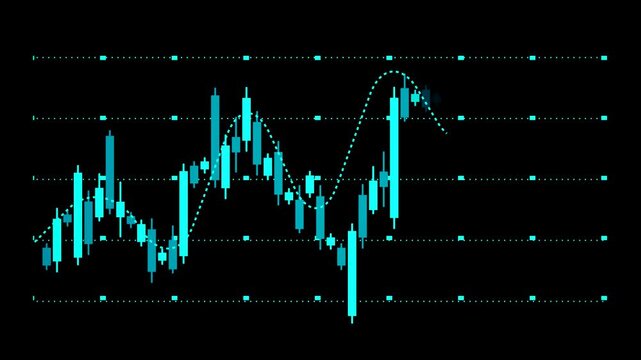
Display Bar trading graph financial stock market and investment, analytics chart with blue tones color and clean design on black background for overlay.
00:14
HD
Animated financial data graphs with moving sine waves and digital metrics for business analytics and market trends presentation
00:15
HD
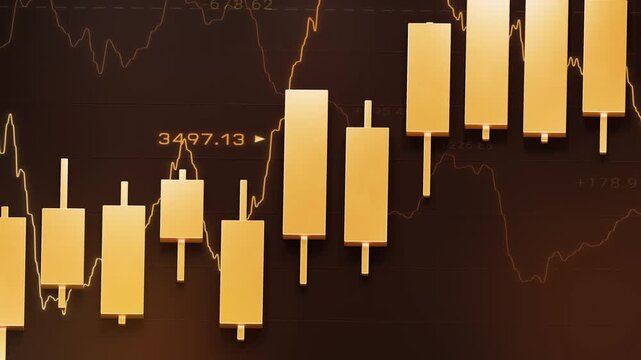
Golden candlestick bar floating with technical line chart, gold trading investment strategy, bullrish commodities market price trend graph, uptrend financial economic growth profit 3d rendering
00:18
HD
Close up of businesswomen or accountant using calculator calculate while working analytic business report on the workplace, Planning financial and accounting concept.
00:12
HD
Digital network data analysis future information technology Network Connections Nodes Social Media Content Complex Algorithms. AI Neural Network, Chatbot, Artificial Intelligence, LLM Visualization
00:20
HD
Minimalist Financial Growth Curve Chart on Black Background
00:10
HD
Modern business data analytics dashboard animation showing high growth with 3D bar chart display
00:10
HD
Overhead arc shot of office team analyzing financial graphs and documents during collaborative corporate meeting
00:12
HD
Industrial worker in hard hat and safety glasses reviews data dashboard on a computer monitor at a shipping container terminal.
00:19
HD
Blue stock market investment, trade business analytics graph and financial chart, market business and exchange financial growth
00:20
HD
Fraud Analyst Monitors Transaction Network Graph On Laptop
00:17
HD
Business analytics dashboard animation with revenue charts user metrics and traffic donut graph
00:15
HD
Oil Industry Growth Visualization with Graphs and Icons
00:10
HD
Animation of multiple charts visualizing the analysis of large amounts of data
00:14
HD
Close-up of a businessman checking financial data on clipboard documents and typing on a computer keyboard at his desk.
00:24
HD
Top Down View of Diverse Business Team Gathered Around Meeting Table With Laptops and Statistical Reports. Visualization Icons Represent Connectivity, Cloud Security. Action Zoom out camera.
00:07
HD
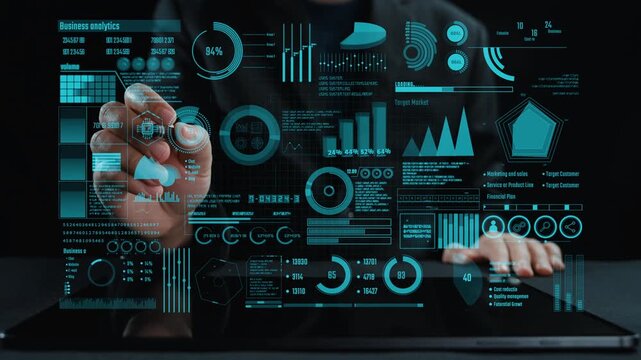
Businessman touching on hologram digital dashboard overlay showing graph charts, map and growth data animation, Holographic modern business analytics, finance planning and market performance
00:10
HD
Smart city skyline of Chicago showing futuristic financial data, stock market infographics, business analytics, big data visualization over urban landscape
00:06
HD
Close-up of hands typing on a keyboard with a digital graph overlay showing upward trends, symbolizing business growth and the influence of technology in data analysis. Copula
00:10
HD
Industrial business concept with rising financial graph overlaying oil refinery plant at night. Symbolize increasing oil prices, refinery operating costs and growth in global power and energy sector.
00:18
HD
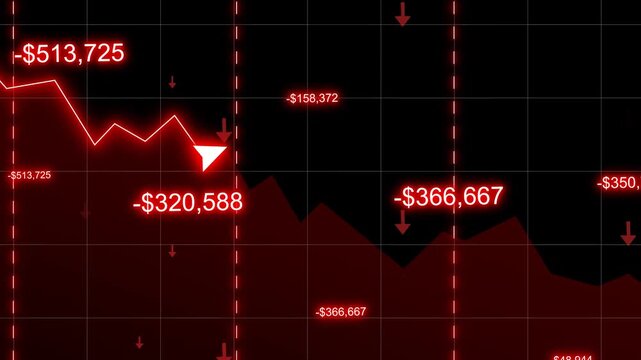
Financial Loss Graph Animation Showing A Dramatic Stock Market Crash With Falling Red Chart Line, Negative Dollar Values, Downward Arrows. Concept Of Economic Recession, Volatility, Investment Failure
00:19
HD
Declining bar chart with downward trend, Blue bar chart with falling line graph decline in business data, finance performance and analytics animation

00:08
HD
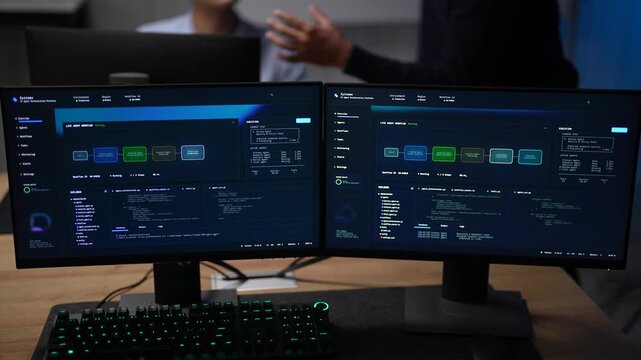
Twin monitors on a shared desk glow with an AI agent pipeline builder and a coloured node graph as blurred teammates move behind them inside a dark AI startup office.
00:11
HD
Business stock market trading graph growth chart concept Infographics animation rising up arrow. Futuristic Data Analytics Dashboard statistics finance visuals business reports, marketing sale profit
00:15
HD
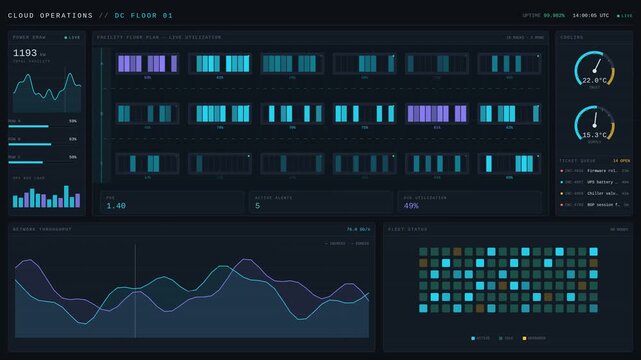
Digital data center cloud operations dashboard displaying real time analytics
00:15
HD
Person using a calculator and laptop, reviewing printed financial charts and reports on a desk, performing budgeting and data analysis in an office setting
00:05
HD
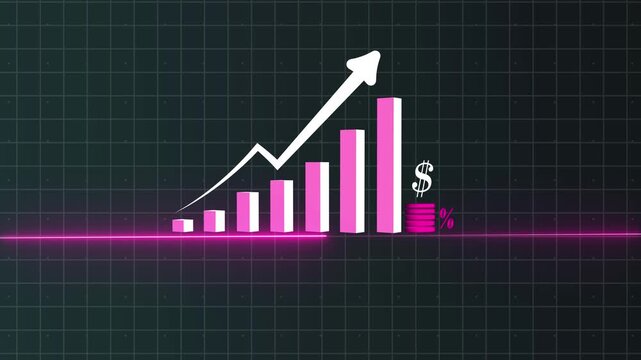
Motion animated footage. Statistics bars columns growth, arrow up. Finance, Bar graph going up, Profit concept, positive increase chart. business graph animation
00:10
HD
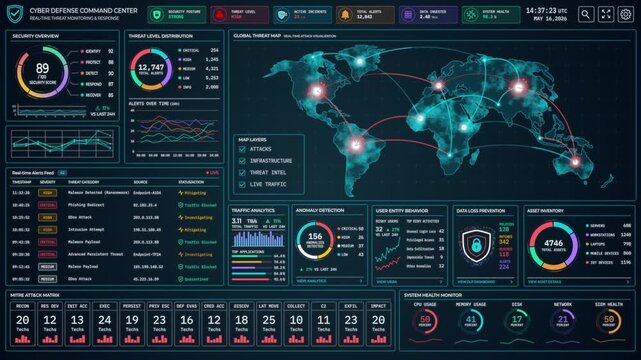
Motion graphic of a complex cybersecurity dashboard user interface for cyber defense and threat monitoring, featuring a global world map and data analytics for modern tech presentations.
00:15
HD
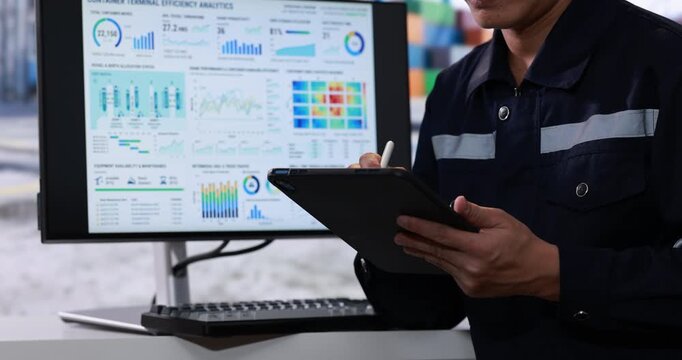
Industrial worker uses a tablet beside a computer monitor displaying colorful production data charts and performance dashboards in a factory office.
00:21
HD
Animated bar chart with rising trend arrow showing business growth and financial success
00:05
HD
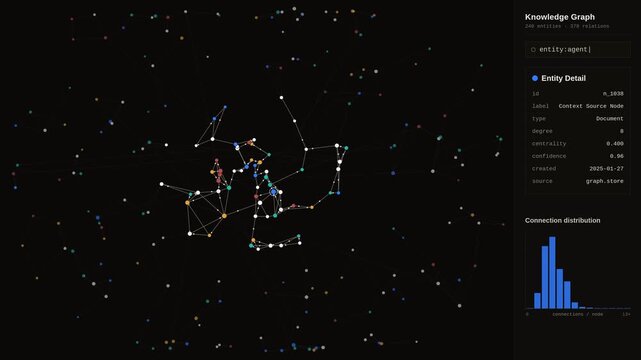
Dark-themed knowledge graph visualization dashboard with color-coded nodes and interactive sidebar interface. professional stock footage for technology, business, and editorial use.
00:15
HD
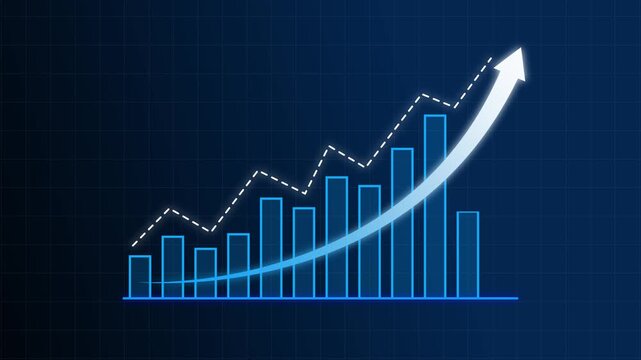
Bar graph animation with dashed line. Bar graph blue upward trend on grid. Bar graph business statistics graphic on black background for performance tracking.
00:11
HD
Dynamic business dashboard UI interface design vector illustration showing financial analytics charts and modern motion render graphics
00:10
HD
Analysts teamwork discuss finance data and dashboard. Colleagues review charts on computer screens and printouts, aligning analytics with metrics. Concept image of collaborative office analysis.
00:11
HD
Businessman analyzing financial charts, counting coins, and using a calculator to evaluate asset sales and profits.
00:14
HD
Top Down View of Businesswomen and Businessmen Meeting Around Office Desk With Laptops and Reports as Linked Visualization of Glowing Icons Statistics, Cybersecurity, SAAS and AI.
00:07
HD
Business growth roi increase with ai integration system development reduce cost improve efficiency successful corporate strategy innovation project management strategic planning corporate progress
00:05
HD
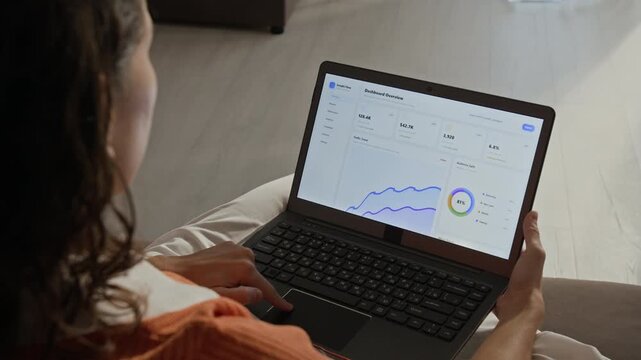
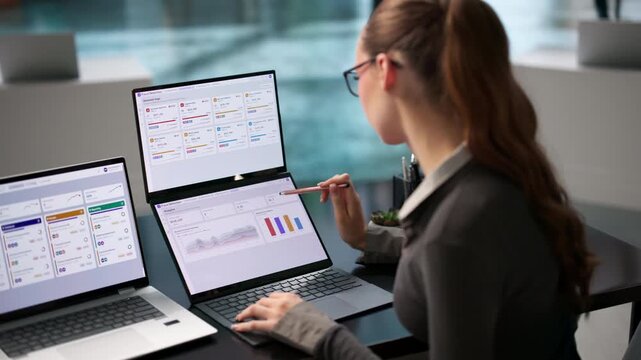
Over shoulder shot of Caucasian young adult woman analyzing business metrics and scrolling through dashboard analytics on laptop. Clip perfect for marketing campaigns about remote work and e-commerce
00:08
HD
A professional analyzing business data through an interactive digital interface, showcasing various graphs and metrics in a modern workspace setting. Cipher
00:13
HD
Financial stock market graph loop animation with HUD data and growing business chart background
00:19
HD
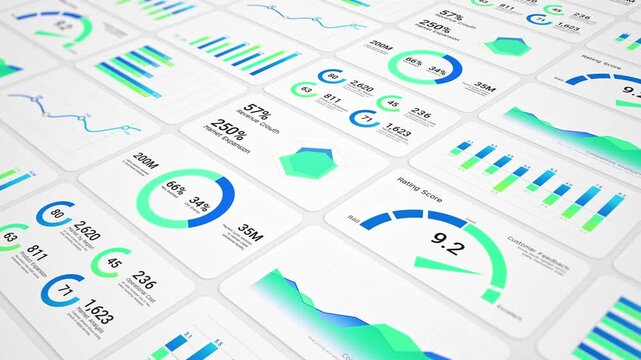
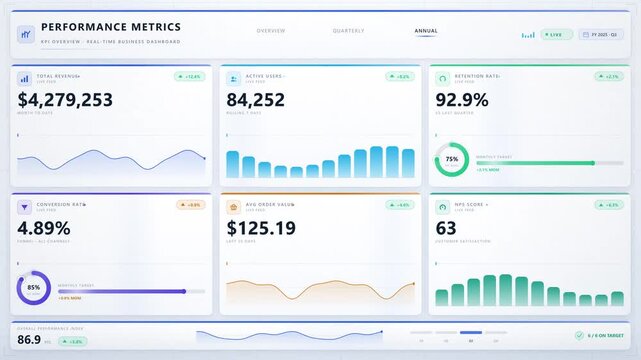
Modern Business Analytics Dashboard Animation with Multiple Data Visualization Panels like Charts, Graphs,  KPI Widgets, And Financial Statistics In A Clean Flat Design. Professional Website Metrics
00:49
HD
Financial market chart with candlesticks and line graph, Abstract financial chart with candlestick bars and line graphs market analysis growth and data trends animation
00:10
HD
Animated bar chart graph rising and falling financial animation
00:12
HD
Modern Business Intelligence KPI Dashboard with Radial Performance Gauge
00:10
HD
Business overview dashboard with revenue profit sales charts and KPI metrics on dark screen
00:15
HD
Neon Glowing Upward Growth Graph Chart on Black Background Minimalist Concept
00:08
HD
Advanced data analytics dashboard display. Business and financial investment. HUD infographic of financial. Information reports of business strategy for investment. Technology data analysis.
00:25
HD
Businessman Working On Financial Graph On Smart Phone. Close Up
00:15
HD
Reviewing business report on digital tablet
00:17
HD
Abstract technology background, big data digital  line wave business concept
00:12
HD
Stock market price chart for analysis. Business analytic looking at computer. 4k resolution, macro shot.
00:10
HD
Laptop with financial charts
00:12
HD
A professor is giving a presentation to his students. The class is reviewing a chart on a projection screen. The professor is gesturing with his hands and explaining the data shown.
00:10
HD
Businessman manager analyst reviewing analytics spreadsheet charts. In office he analyzes data on laptop and screen preparing reports and checking metrics. Core analytics and reporting concept.
00:09
HD
Big data visualization digital financial analytics, dynamic profit growth
00:12
HD