
Highlight Titles 5.0 - 3

3 Step Infographic with Colorful Accents

Three Steps for Business Growth Strategy Infographic Template

Simple Infographic with 3 Elements

Modern Growth and Progress Business Infographic Presenation with Steps Layout

Triple Hexagon Infographic

Process Infographic Clean Presentation Design Template
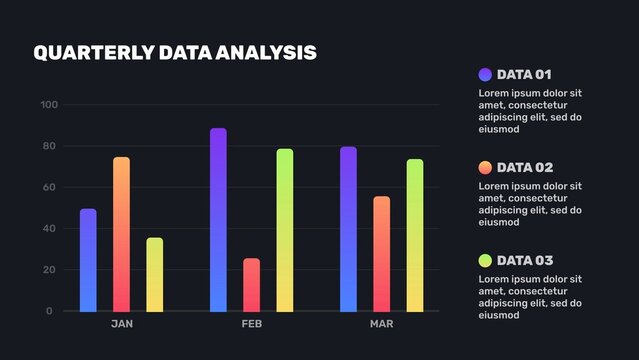
3 Bar Gradient Graph Data Analysis Infographic
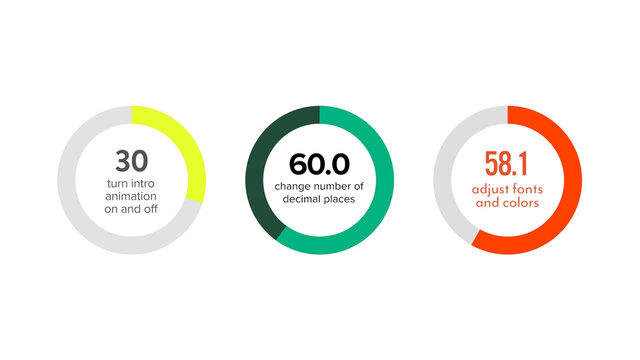
Circular Percentage Infographic with 3 Styles
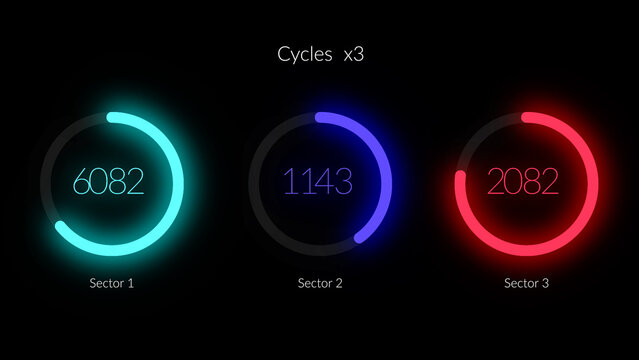
HUD Neon Infographics Cycles 3
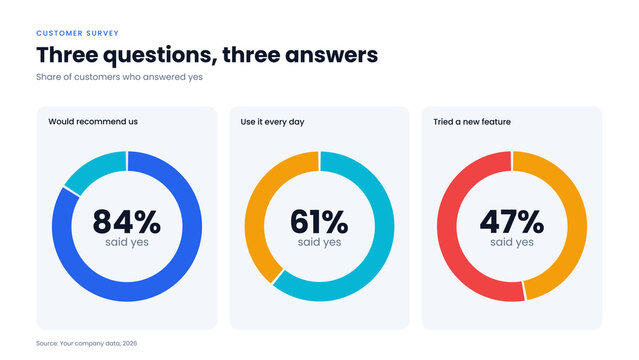
Infographic Three Donut Answers - Professional three donut charts infographic animation on clean white for survey answers, customer research and poll results

Infographic Layout with Three Rounded Sections

Bouncing Text Triple Title Vertical

Scribbles & Doodles TOP 3 Intro

Quotes Title 3

Minimalist Three column Bar Graph Infographic Layout

Colorful Three Section Pricing Tier Layout
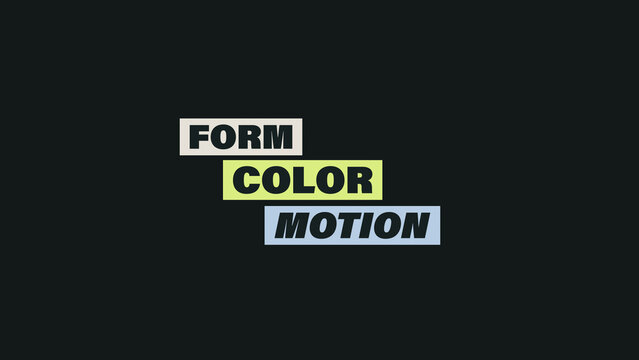
Animated Stepped Text Titles with Three Offset Boxes and Staggered Directional Headline Reveals

Tri Fold Brochure Design For Business Promotion

Green Pink Blue Three Step Education Infographic Template

Typing Titles - 3

3 Step Workflow Infographic

Three Directions Growth Strategy Infographic Template with Arrows

Colorful Circles Infographic Layout

Minimal Corporate Timeline Infographic Template for Business History Presentation

3 Grouped Circles Infographic 1
Seven Arrow Infographic

Infographic Animated 3 Values Chart Graph
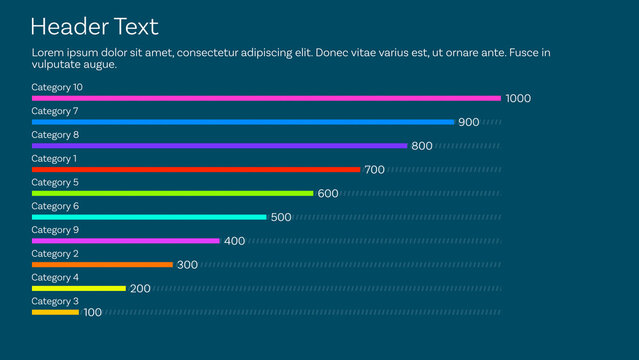
Horizontal Bar Chart for Design and Data Visualization Design and Slide Presentation and with 10 Animated Data Points + Responsive Custom Text + Color with Ordering Options and 3 Options for Bar Width
Company Marketing Plan Presentation Template
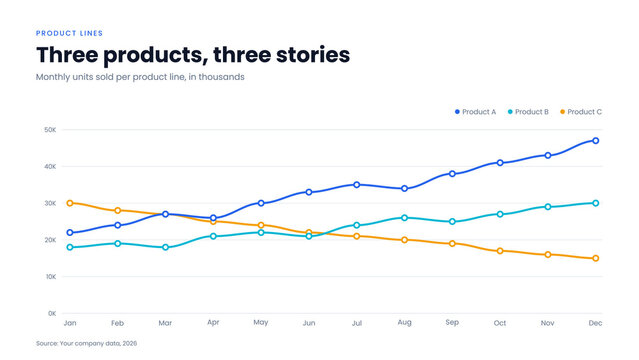
Infographic Three Product Lines - Professional multi line chart infographic animation on clean white for product line comparisons, sales trends and business reviews
3 Step Business Strategy and Planning Target Infographic Presentation

Bouncing Text Triple Title

Scribbles & Doodles TOP 3 Intro

Quotes Title 3
Info Panels with Abstract Background Layout
Businesspeople on Arrow Blocks Element Infographic 3
three Price Table Layouts with Colorful Accents

HUD Neon Infographics Cycles 3 – Futuristic Sci Fi Data Interface, Glowing Digital Dashboard Elements, Cyberpunk Analytics Charts, Tech UI Visualization Pack

Three Lines Type on Paper Texture Titles

Subscribe Elements 3.0 - 4
Glass 3 Options Venn Diagram
Business Project Infographic Template with 3 Options and Minimal Illustration
Modern 5 Steps Process Infographic Design Template with Numbers
Time Management Hourglass Timeline Infographic Template for Productivity
Three Data Branches Infographic
Ten Step Circle Arrow Infographic

Triangle Logic Infographic Data Visualiser
Infographic Layout with a Pyramid
9 Four-Color Square Creative Development Icons 3
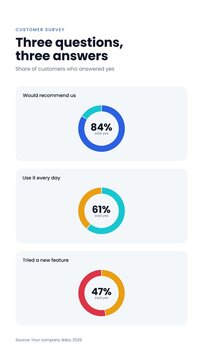
Infographic Vertical Three Donut Answers - Professional vertical 9:16 three donut charts infographic animation on clean white for survey answers, customer research and poll results
Gold Metallic Emblem Superhero Text Effect Geometric Bold Modern Font

Three Line Block Text Title
Trifold brochure Template

Call - Outs 3
Folded Circles and Dashed Lines Infographic Layout 3
Three Price Table Layouts with Colorful Accents
3 Pricing Plan Table Design Layout for Hosting Compare Infographic

Animated Pie Chart Infographic 3

Three Lines Type on Title Overlay

Typing Titles - 3
3 Step Infographic with Red, Yellow, and Orange Accents
Yearly Overview Trifold Brochure Template
Simple Infographic with three Elements
Minimal Business Timeline Infographic Template with 3 Steps for Company Growth
Lightbulb Elements Infographic 3
3 Layer Funnel Infographic
Bright Timeline Infographic 5
Infographic Layout with Arrows
Colorful Three Section Pricing Tier Layout
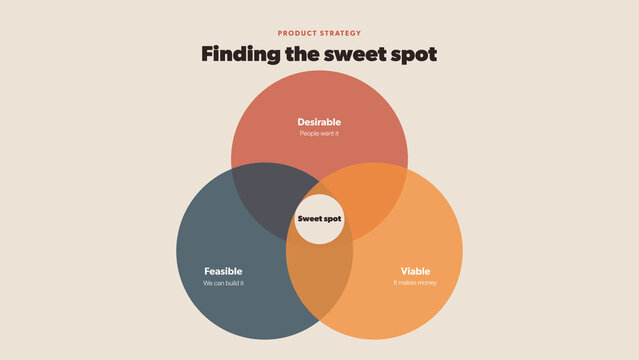
Infographic Three Circle Venn - Professional three circle venn diagram infographic animation in warm beige for product strategy, sweet spots and overlapping ideas
Multipurpose Three Section Numbered Tab Infographic 3
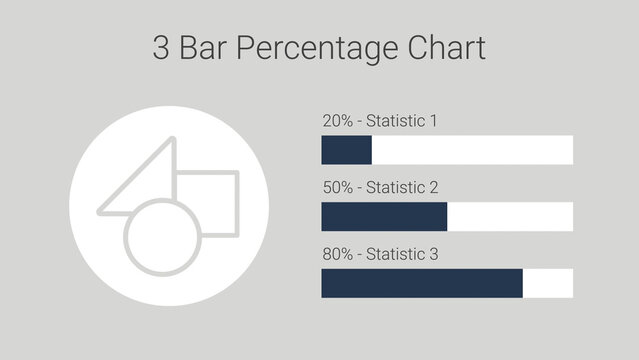
Clean 3 Bar Percentage Chart
Logistic Tri-Fold Brochure

Location Title 3
Three Section Geometric Shapes Infographic Layout

10 Cooking Animated Chalkboard Icons 3
Info Table Infographic Layout with three Columns
Präsentationslayout mit Dreiecken
無料

Type On Paper Texture Titles

Subscribe Elements 3.0 - 5
Glass Circular Step Infographic With 2-7 Options
3 Step Infographics Template with Businessman Illustration
Business Infographic Template With Three Circle Steps and Photos Placeholders

Three Color Caption Title
3 Gear Success Factors Infographic
3 Steps Circle Business Infographic Design
Bright Timeline Infographic 3
25 Circular Business and Finance Icons 3
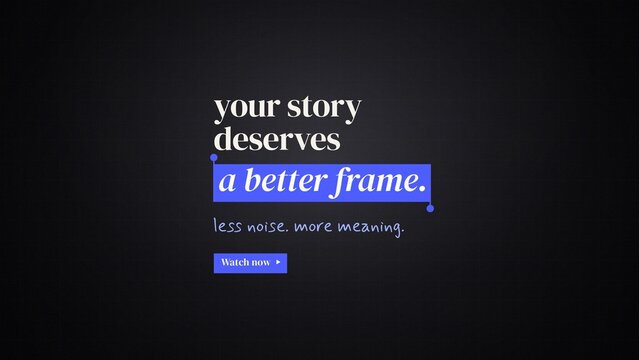
Highlight Titles 5.0 - 3

Subscribe Elements 3.0 - 4

Subscribe Elements 3.0 - 1

Call - Outs 3 (RGB)
3 Vertical Steps Info Chart Layout with Graphic Icons

Subscribe Elements 3.0 - 3
Simple Infographic Layout with Three Elements

Subscribe Elements 3.0 - 2

Subscribe Elements 3.0 - 3
Three Part Infogtaphic Layout
Three Section Vertical Puzzle Piece Infographic Layout