
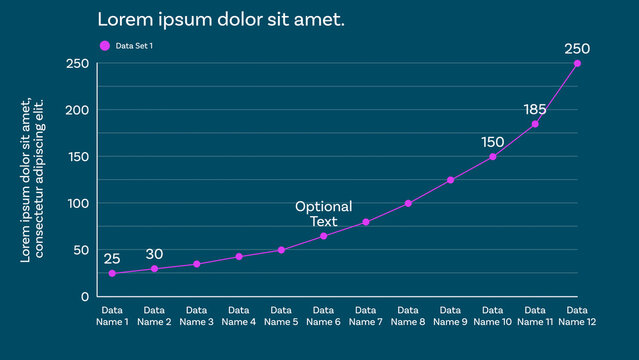
Responsive Line Graph for Clean and Modern Data Visualizations Design and Slide Presentations with up to 12 Animated Data Points and Optional Labels to show Percentages, Whole Values, and Custom Texts

Minimalist Timeline Infographic Template with Circle Elements and Photos

Rising Profit Line Graph Sales Growth Infographic
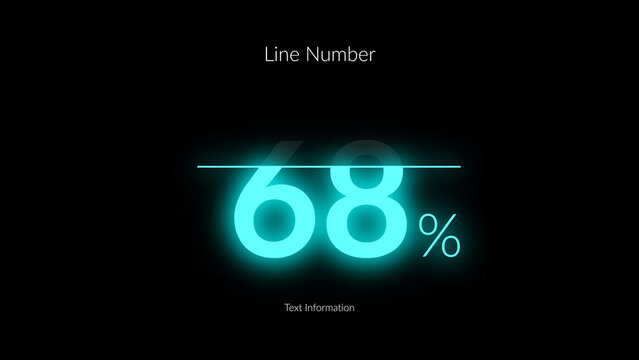
HUD Neon Infographics Line Number x1 – Futuristic Sci Fi Data Interface, Glowing Digital Dashboard Elements, Cyberpunk Analytics Charts, Tech UI Visualization Pack
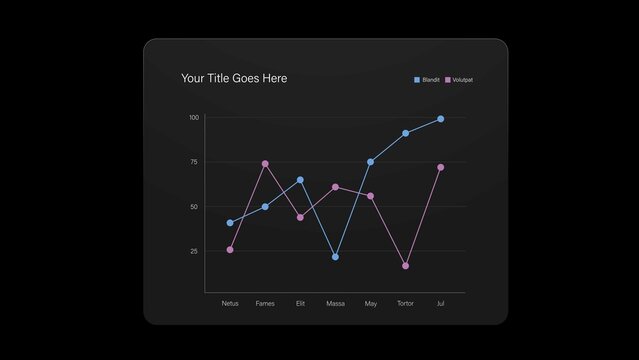
Line Chart Infographic Video Template

Abstract Glowing AI Neon Light Waves Background

Line Graph Chart Infographic for Time Series in Business Presentation Layouts

Modern Business Infographic Elements Set
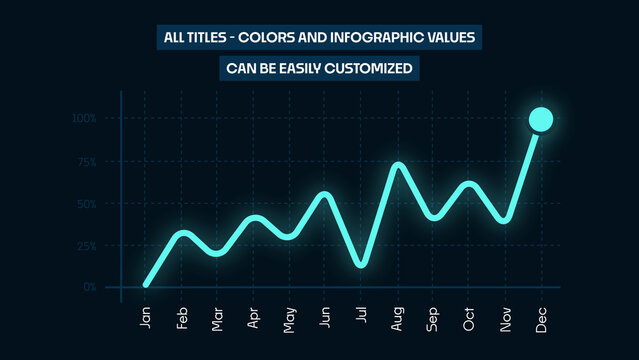
Animated Line Chart Infographics | Business Data Visualization and Analytics Graph

Vertical Green Technology Background

Vector set of 240 64X64 pixel perfect flat line web icons. Fully editable and easy to use.

Clean Call Outs
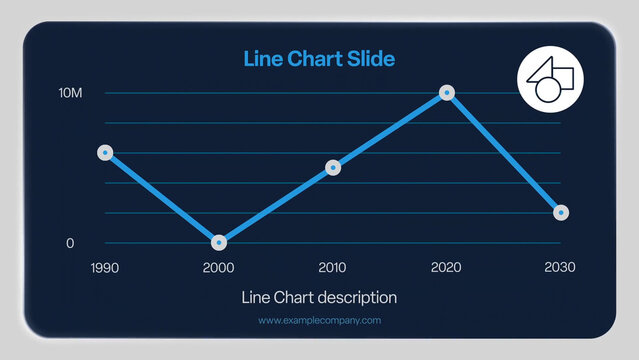
Elegant Line Chart Infographic Slide

Electric Circuit Icons Set
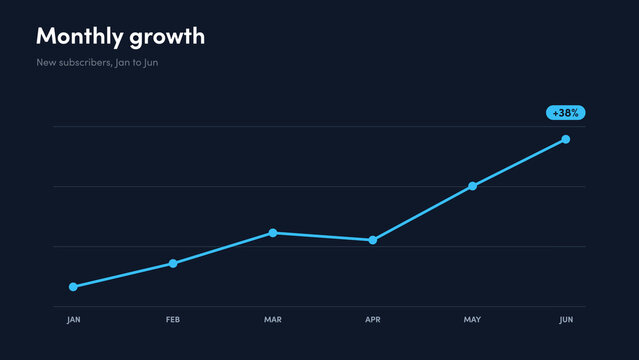
Infographic Growth Line - Professional growth line chart infographic animation with editable data points and a peak badge for monthly growth, reports and analytics

Business Agenda & Goals Line Icons
Call Outs 43

Green And Black Tech Company Flyer

Work Portfolio Magazine Template

5 Isolated Connectivity Backgrounds

Data Measurement Overlay

Minimalist Diagonal Company History Timeline Infographic Template with Photos
Grid Specimen Type Motion Minimal Title Sequence
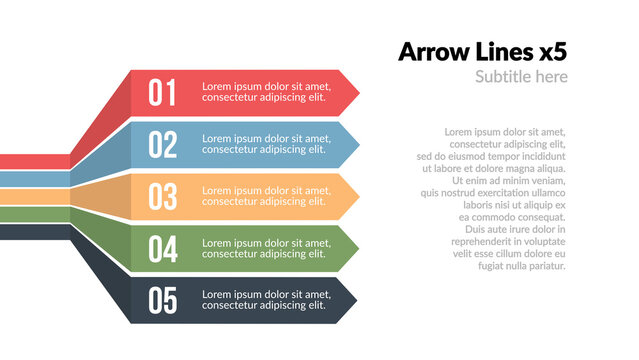
Arrow Lines X5 – Dynamic Callouts, Data Tags and Pointer Labels Animation, Modern Infographic Elements for Presentation and Interface Design
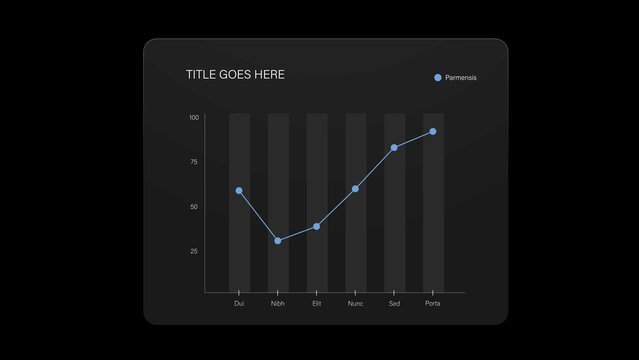
Line Chart Infographic Video Template

Annual Infographic Timeline Template with Gradient Wave Line
Line Graph Chart Infographic Vector with Cute Education Style for School Teachers
Prompt Optimization Stroke Icon Set
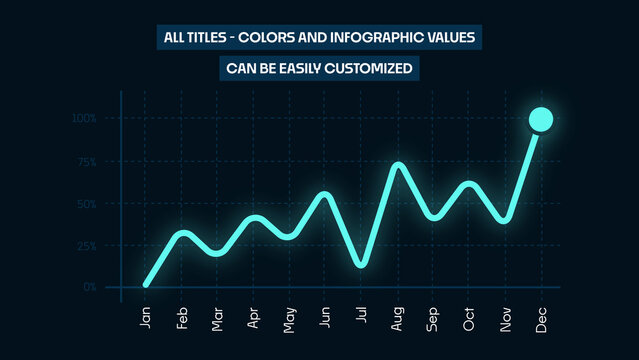
Animated Line Chart Infographics | Business Data Visualization and Analytics Graph

Corporate Presentation Background
Data Analytics Black and White Outline Style Icons Set

Clean Call Outs
Editable Graph Elements for Data Visualization Layouts
Cyan And Black Futuristic Hologram Photo Effect
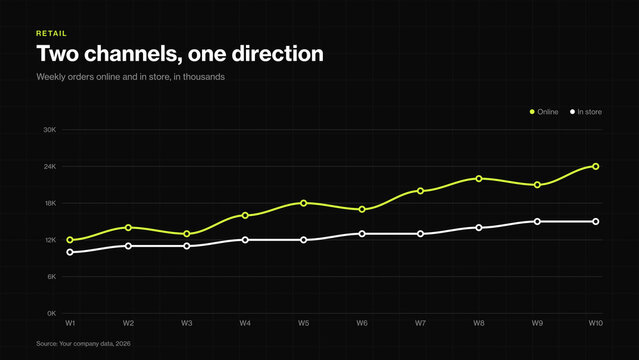
Infographic Two Channel Lines - Professional two line chart infographic animation in black and neon lime for sales channel trends, retail comparisons and growth updates

Futuristic Gaming Call Out Titles
Call Outs 11
Blue And Black Technology Annual Report
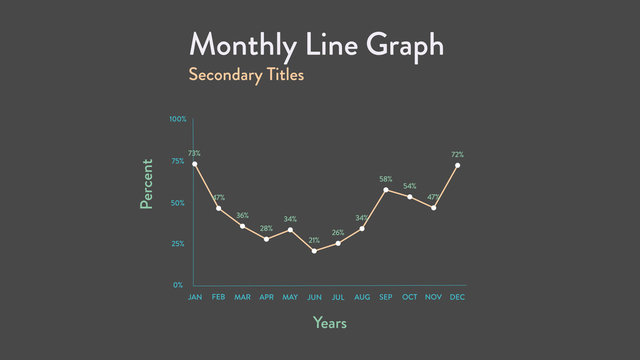
Monthly Line Graph Infographic
Isolated Four Abstract Network Backgrounds

Bitrate Transition
Minimalist Business Company History Timeline Infographic Template with Photos
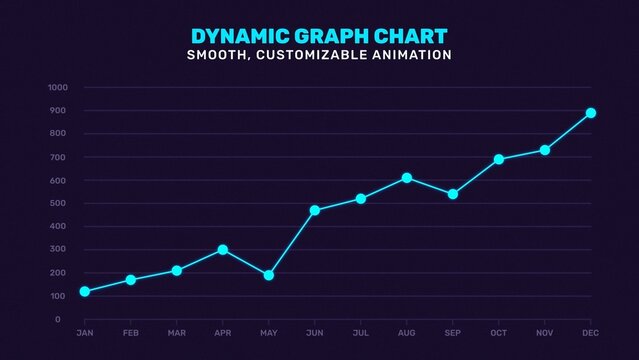
Dynamic Clean Modern Line Graphic Dot Infographic
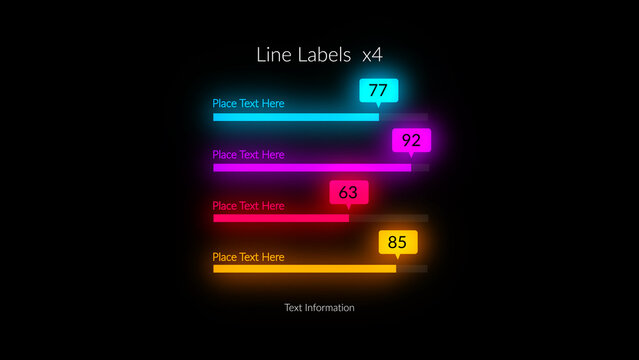
HUD Neon Infographics Lines Labels x4 – Futuristic Sci Fi Data Interface, Glowing Digital Dashboard Elements, Cyberpunk Analytics Charts, Tech UI Visualization Pack
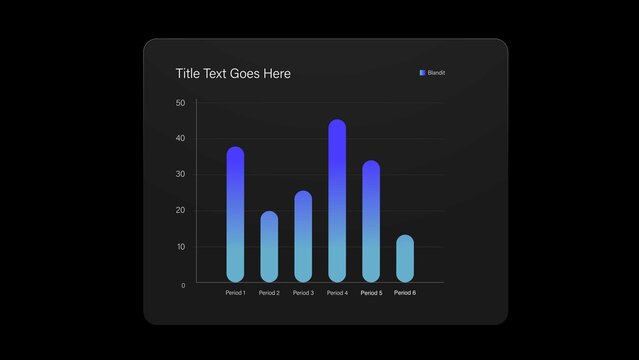
Infographic Bar Chart Video Template
Simple flat color data table layout templatewith light shadows
Line Graph Chart Infographic in Modern Corporate Business Presentation Style
Saas Platform Stroke Icons
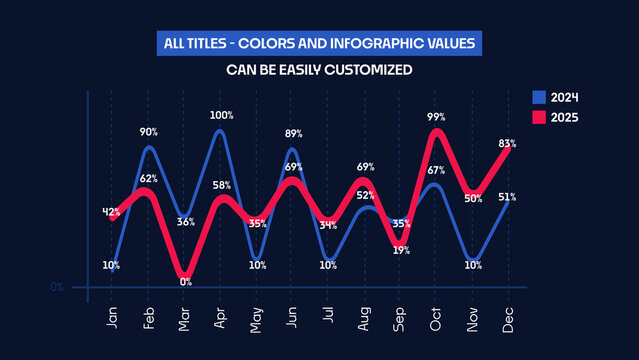
Animated Infographics Comparison Chart | Dynamic Line Graph for Business Finance and Marketing Data Visualization

Vertical Corporate Technology Background

Overlay Title 04

Hyper Abstract Title Sequence

Clean Quote Titles
Black Mind Intelligence Idea Thinking Line Icons Set
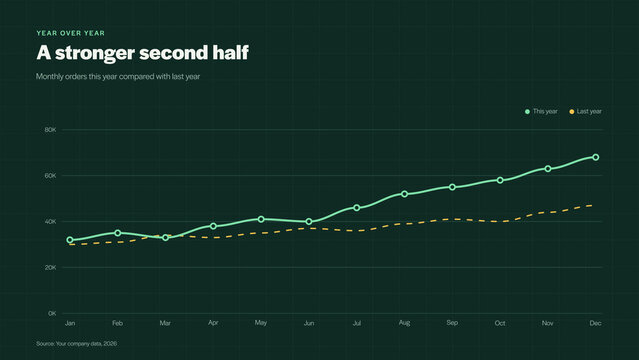
Infographic Year Over Year Lines - Professional two line chart infographic animation on dark green for year over year comparisons, sales trends and annual reviews

Startup Line Icons
Call Outs 4
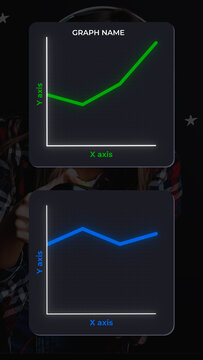
Mini Line Graph For Data Analytics And Trends Forecast

Scan Line Media
Blue Tech Text Effect
Vector set of cybersecurity and privacy line icons. Each icon is crafted on a pixel perfect 48X48 size grid with adjustable strokes. Professional design for data protection and network safety
Minimalist Business Company History Timeline Infographic Template with Photos and Icons

Stock Trading Animated Graph Title Template
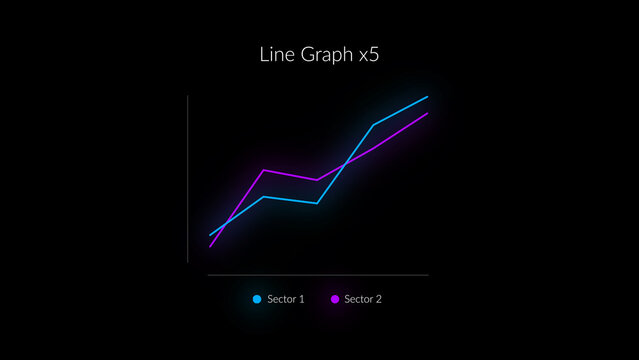
HUD Neon Infographics Line Graph x6
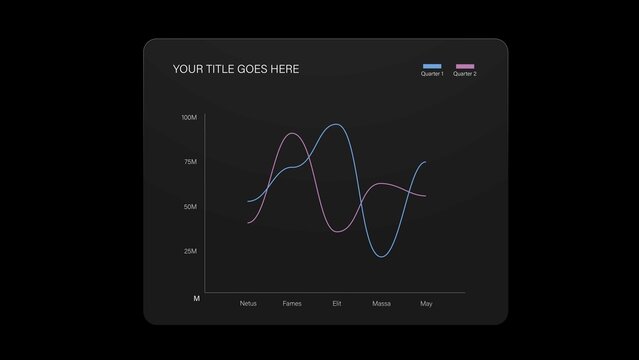
Line Chart Infographic Video Template
Colorful Circular Thin Line Process Infographic Diagram Template with Icons
Timeline Infographic Template
AI and Automation Stroke Icon Set
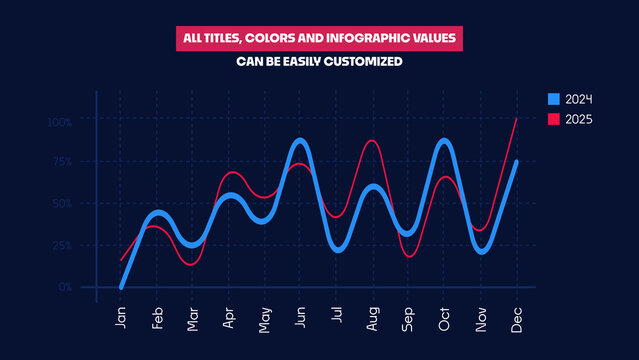
Corporate Infographics | Animated Line Charts Business Data Trends and Yearly Performance Analytics for Reports and Presentations
Vector Set of Network and Cloud Computing Flat Line Web Icons
4 Isolated Connection Backgrounds with Editable Colors
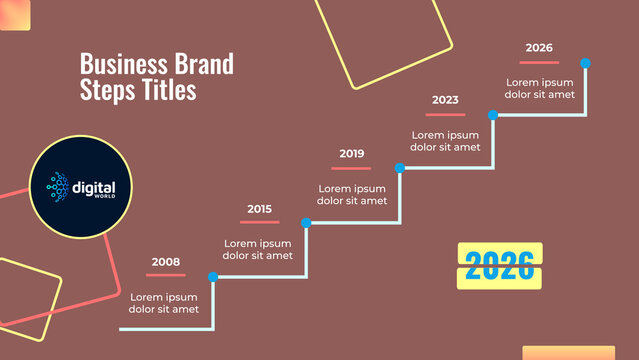
Business Brand Presentation Stages of Growth

Tech Overlays
Green And Black Matrix Code Rain Photo Effect
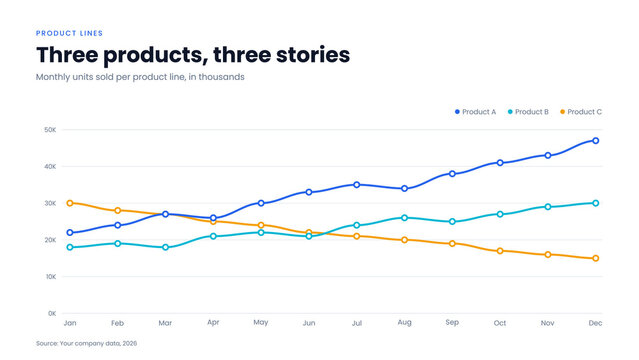
Infographic Three Product Lines - Professional multi line chart infographic animation on clean white for product line comparisons, sales trends and business reviews
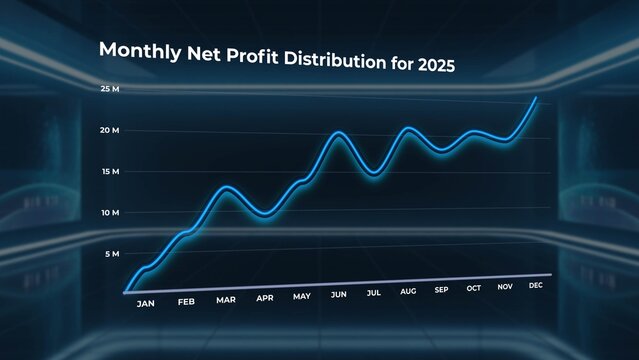
3D Glass Financial Line Chart

Call Outs 39
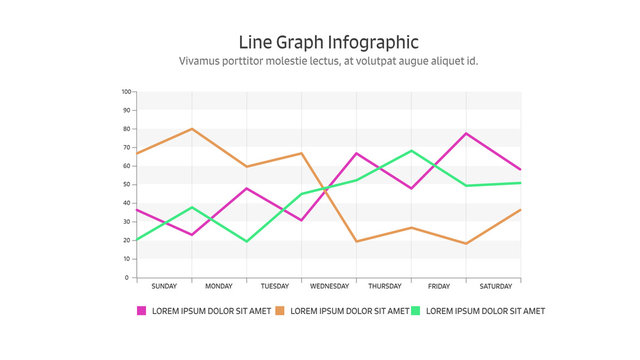
Line Graph Infographic

10 Different Preloaders with Custom Design
5 Step Workflow Infographic
Vector set of document filing and data line icons. Pixel perfect 48X48 size grid with adjustable strokes. Professional symbols for office paperwork, digital storage and file management
Minimalist Timeline Infographic Template with Image Gallery Layout

Glitch Grid Multiple Lines Cyber Colorful Logo Reveal

Arrow Lines X5 – Dynamic Callouts, Data Tags and Pointer Labels Animation, Modern Infographic Elements for Presentation and Interface Design
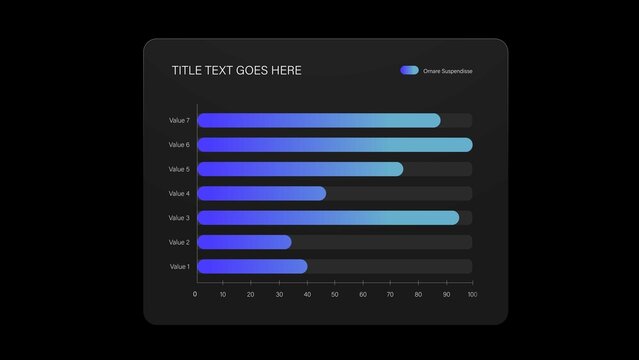
Infographic Bar Chart Video Template
Abstract Blue Tech Background with Glowing Lines for Presentation
Timeline Infographic Template in Modern Minimal Style
Minimalist Business Timeline Infographic Template for Company History Milestone Layout
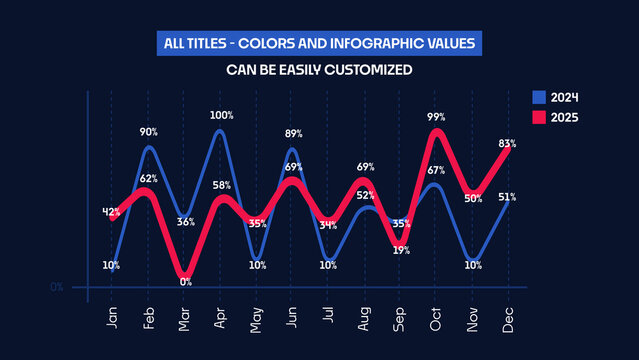
Animated Infographics Comparison Chart | Dynamic Line Graph for Business, Finance and Marketing Data Visualization
Multicolored Bar Graph Infographic
Isolated Globe and Technology Backgrounds
Science Conference Media Banner with Abstract Geometric Lines

Text Network Title
Black and White Generative AI Icons Line Style. AI Technology Icons Set
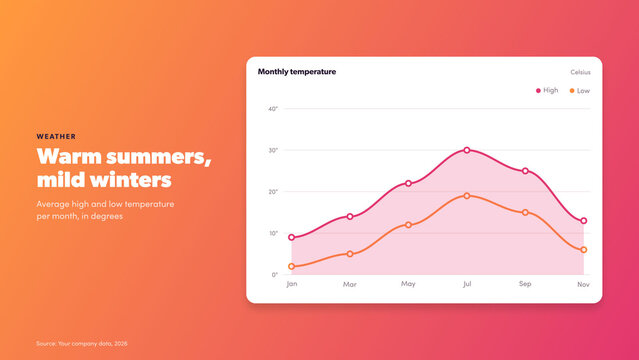
Infographic Temperature Range Lines - Professional temperature line chart infographic animation on a coral sunset gradient for weather reports, climate data and travel content

Business Management Line Icons
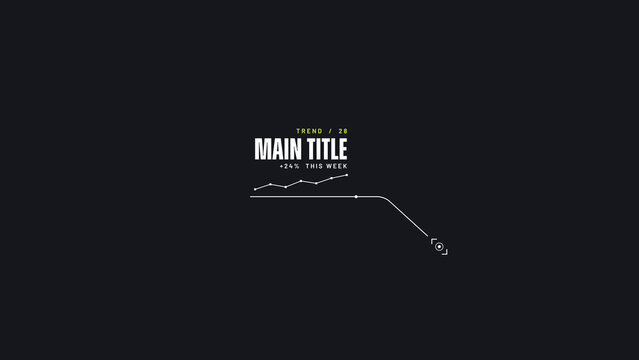
Call Outs 28
Business Report Presentation Template

Modern Call Out
3 Step Workflow Infographic