Et link til indstilling af din adgangskode er sendt til: For at få adgang til dine køb i fremtiden har du brug for en adgangskode.
Få 10 Stock-billeder med en gratis prøveversion
Nye filtre tilføjet
Sortér efter

21.614 resultater for grid system tracking i alle

8.547 resultater i video
Ev navigation interface scanning and tracking data on dark grid
00:10
HD
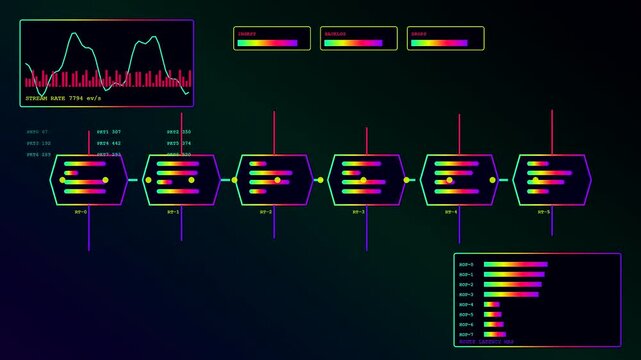
A digital token stream displays multiple neon bar graphs and fluctuating line charts on a dark interface grid for monitoring complex data flow systems
00:06
HD
Digital carbon capture tracking interfaces display complex environmental metrics via glowing geometric charts and neon tiered graphs presented on a dark screen in this animation
00:06
HD
4K smart grid dashboard with animated network topology map, real-time loss reduction gauges, and glowing data metrics on dark slate background for energy control.
00:15
HD
A vulnerability scanning interface showing digital block grids with moving arrow symbols and data charts in a dark software monitoring environment for complex system audit performance
00:06
HD
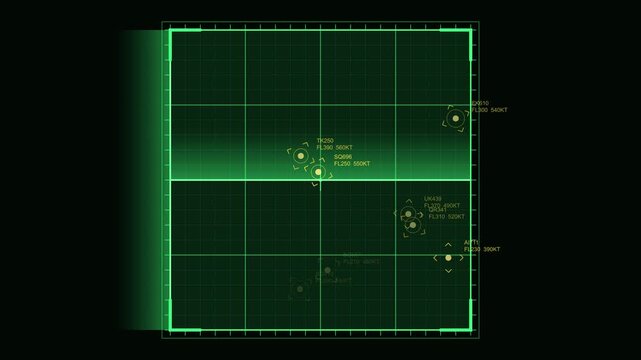
Green futuristic tactical radar interface displaying aircraft targets a digital screen rendered in showing aerial and tracking data within a grid system hud monitor aviation flight
00:10
HD
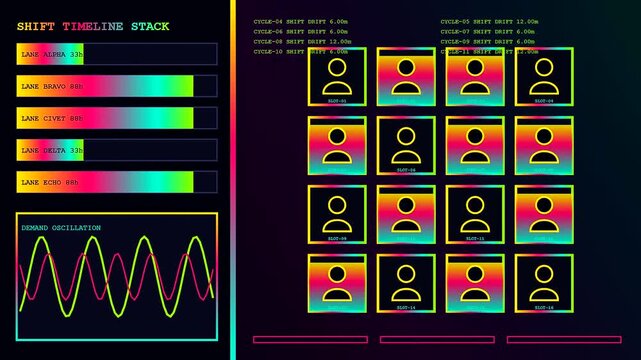
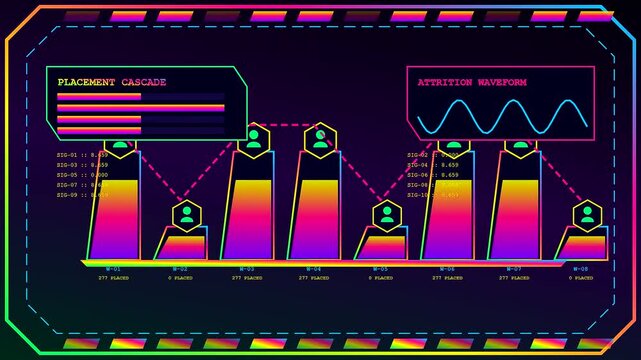
A digital staffing allocation system displays various user avatars and shift trends on a dark monitor screen featuring bright neon graphs for personnel tracking
00:06
HD
Digital servers telemetry monitoring displays featuring glowing nodes and moving network traffic lines shown within a dark futuristic interface animation for global data management system analysis
00:06
HD
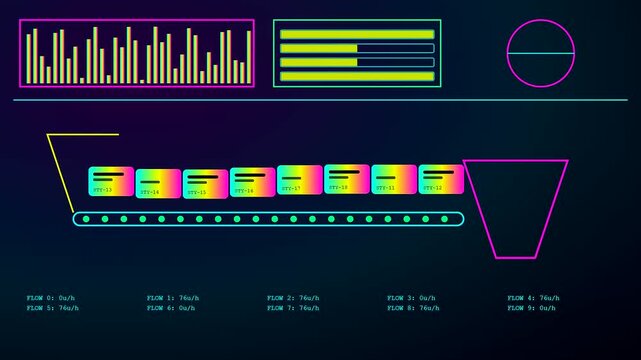
Monitoring an agile backlog through a digital tracking interface showing colorful task cards moving along a conveyor belt in a simulated automated factory production flow system
00:06
HD
A digital bioinformatics interface shows rhythmic glowing data lines and colorful bar charts fluctuating on a dark screen during a complex genomic laboratory research session
00:06
HD
Blue radar sonar interface scanning with rotating sweep line over dotted world map background
00:10
HD
glowing magenta circular radar display with polar grid coordinates and tracking points, radar interface graphics, surveillance technology visuals, navigation displays, tracking system concepts,
00:09
HD
Digital displays showing staffing allocation metrics with grid patterns and personnel icons in a complex interface for monitoring human labor capacity and dynamic workflow performance tracking
00:06
HD
Data for warehouse optimization appears on a digital screen displaying grid blocks with gradient bar charts and status updates for inventory tracking in a virtual interface
00:06
HD
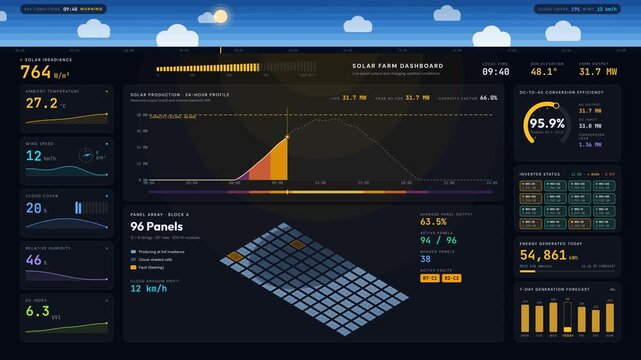
4K Solar farm dashboard visualization tracking panel output, weather conditions, and energy production data with dynamic charts and isometric view. for commercial creative technology and business use.
00:15
HD
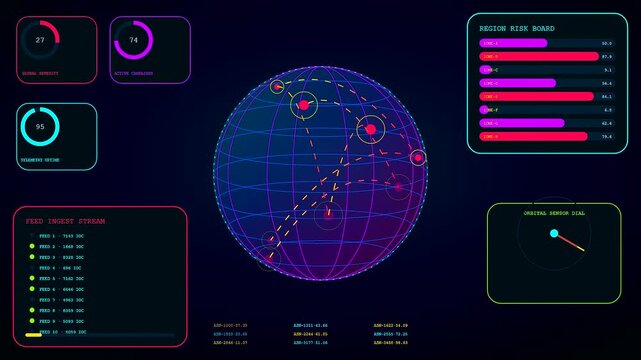
Threat intelligence interface displaying rotating global spheres with glowing data nodes and tracking lines across a dark digital panel showing various statistical charts and metrics
00:06
HD
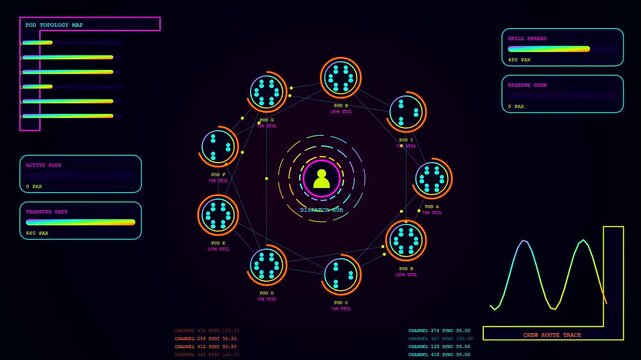
Complex staffing allocation dashboard visualizes network nodes with moving wave charts and circular interface elements displaying team logistics status across three distinct digital monitor panels
00:06
HD
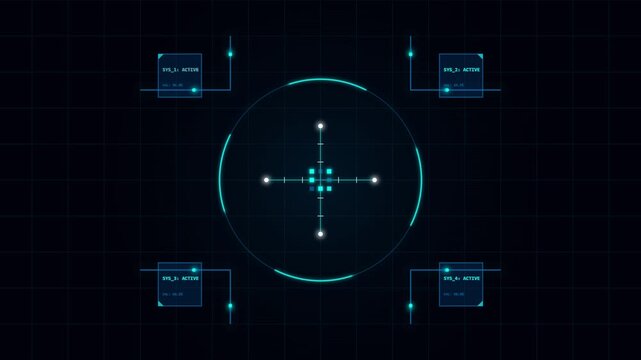
Futuristic cyan holographic HUD interface with a glowing circular radar, central targeting crosshair, system status panels, and dark digital grid background. Abstract high-tech
00:10
HD
Vulnerability scanning charts and glowing system metrics appear on a dark interface representing complex digital monitoring tools used in modern data security analytics and network traffic tracking
00:06
HD
Rectangle radar sweeping and detecting interface animation. Futuristic digital radar interface data detection technology.
00:14
HD
Dark warehouse robotics interface displaying automated storage unit metrics and dynamic shelf grid maps showing real time logistical system tracking data for industrial inventory management processes
00:06
HD
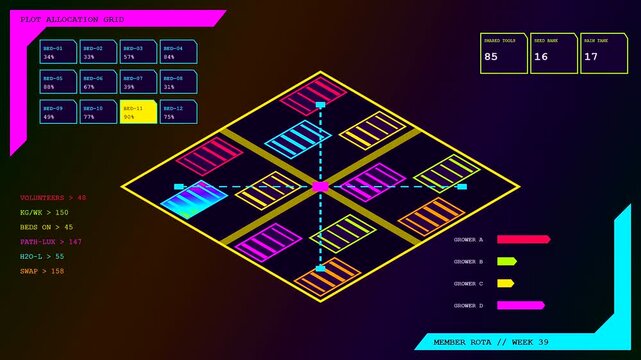
A digital community garden harvest display features animated isometric plots with glowing neon metrics across three sequential screens showing agricultural data updates in a dark environment
00:06
HD
Staffing allocation metrics rendered as animated bar charts on a digital interface showing fluctuating performance peaks and periodic wave patterns for workforce tracking and professional management
00:06
HD
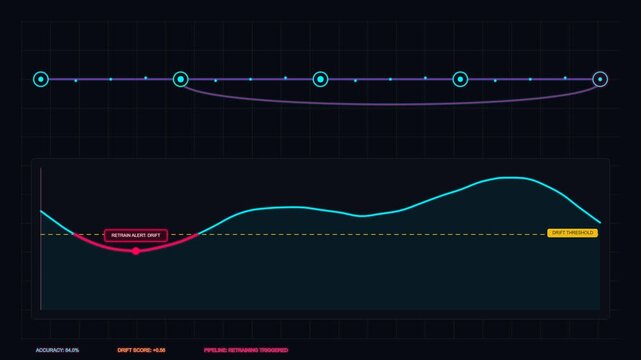
Data science analytical line chart with drift detection threshold for monitoring system performance a digital analytics interface displays a visualizing and metrics for software tracking
00:10
HD
Warehouse optimization digital interface displays colorful bar charts with grid alignment patterns glowing in dark blue tones showing systematic data tracking of logistics and supply chain systems
00:06
HD