Et link til indstilling af din adgangskode er sendt til: For at få adgang til dine køb i fremtiden har du brug for en adgangskode.
Få 3 videoer eller 25 billeder med en gratis prøveversion
Nye filtre tilføjet
Sortér efter

4.138 resultater for technical report i videoer

Viewing an official vehicle report on a smartphone. The screen displays VIN, region, production year, and body type. Perfect for automotive apps, car buying, and vehicle history visuals.
00:14
HD
Dynamic system status gauge animation featuring a moving needle indicating performance levels from green to red for data monitoring, technical interface dashboards, and analytical reporting
00:10
HD
Female engineer reviewing and explaining technical project documents with colleagues during a collaborative engineering meeting in a modern technology office.
00:13
HD
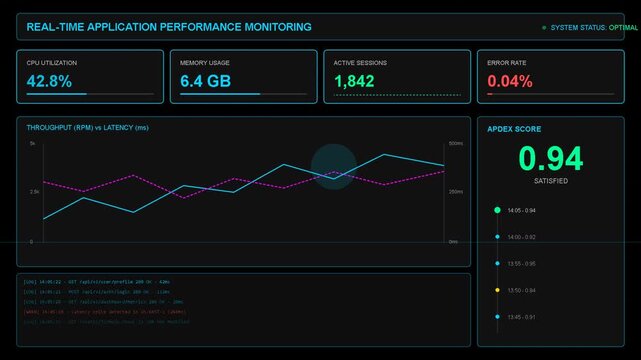
Digital dashboard showing data analytics, metrics, live line graphs, and system performance, ideal for technical interface or software display
00:09
HD
Man, electrician and writing at site with clipboard, inspection and circuit compliance for construction. Thinking, person and checklist at worksite for protocol, electrical report and building safety
00:12
HD
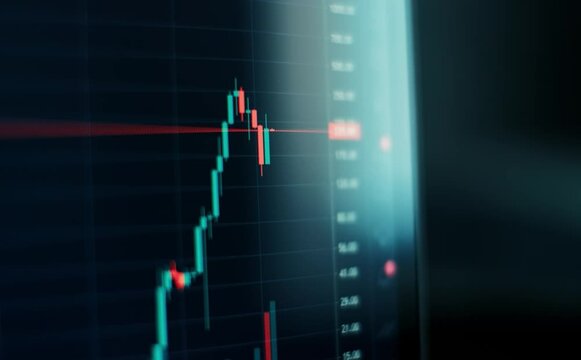
Financial market analysis and investment strategy planning, technical chart interpretation, and collaboration between traders to identify market trends and evaluate potential trading opportunities.
00:11
HD
Chest up shot of adult Caucasian female technical operator detecting cyber attack and reporting via headset while monitoring network system on computers in office
00:10
HD
Professional Male Software Engineer, Data scientist Looking at Monitor Reviewing Coding and AI Model while Analyzing, Developing New AI Module and Datum in Tech Office at Night.
00:07
HD
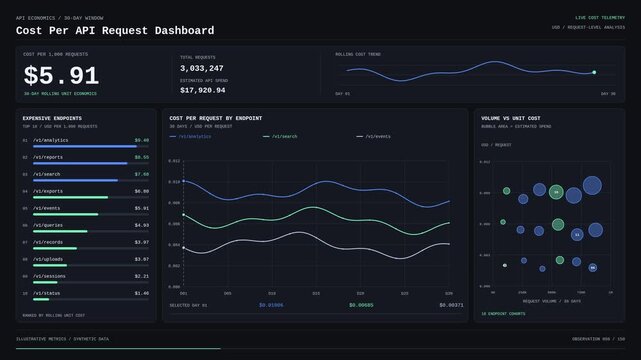
Cost per API request dashboard showing software analytics metrics on dark digital interface
00:15
HD
Golden candlestick bar floating with technical line chart, gold trading investment strategy, bullrish commodities market price trend graph, uptrend financial economic growth profit 3d rendering
00:18
HD
Driver explains accident details to insurance agent in garage closeup. Man inspector with clipboard interviews owner about vehicle crash at service station
00:10
HD
Digital audit report concept featuring glowing cyber network interface with integrated for financial analysis, cybersecurity, banking, artificial intelligence, and technical support systems in motion
00:10
HD
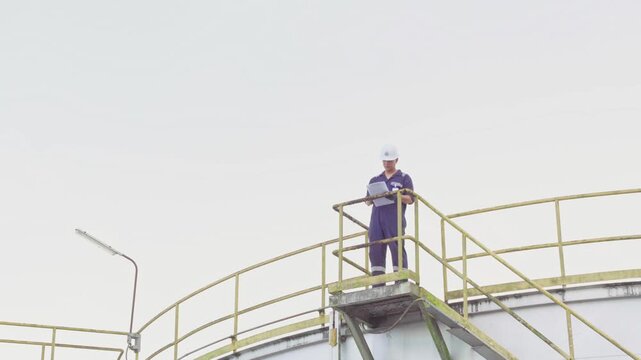
Engineers petrochemical checking report for technical inspections in oil refinery. Technicians working on checklist in the oil storage tank area. Factory and industry manufacturing. Crude Oil tank
00:14
HD
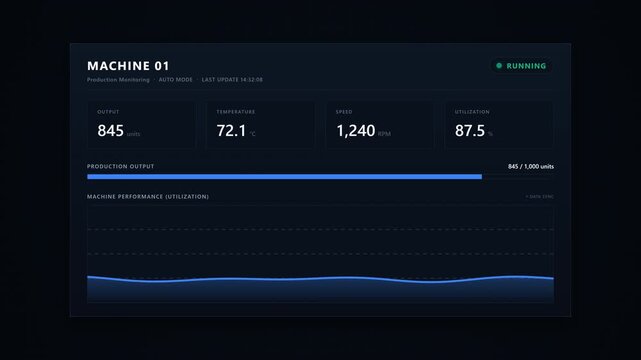
Industrial Performance Dashboard Interface Displaying Real-Time Operational Data Analytics for Manufacturing Systems
00:15
HD
Stock Market Chart, Beautiful 3d Animation of Japanese Candlestick Graph in Time Lapse. Seamless Looping Ultra HD 4K 3840x2160
00:30
HD
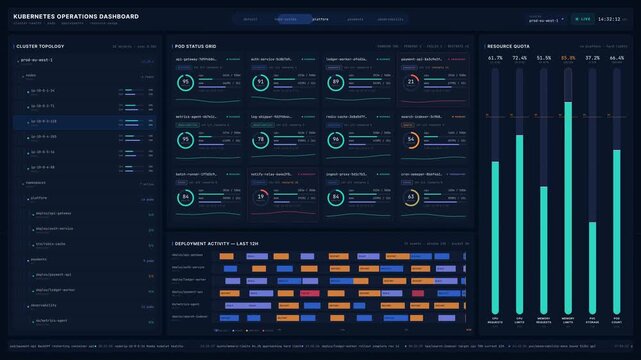
Explore a detailed Kubernetes operations dashboard showcasing cluster health, pods, deployments, and resource usage with a midnight color scheme and technical precision layout.
00:15
HD
Financial data stock market crash concept with red glowing charts and downward graph lines representing global economic recession and market crisis
00:10
HD
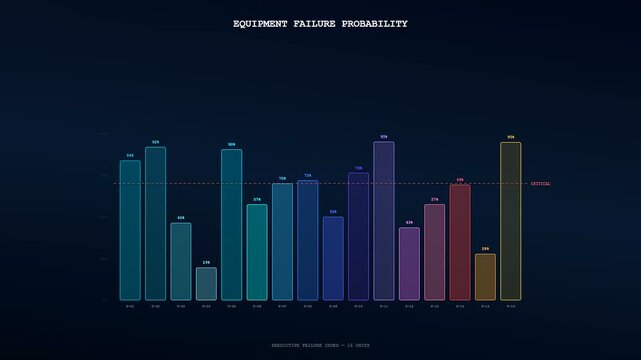
Predictive maintenance monitoring displays vibrant bar charts with shifting colorful data metrics rising across digital screens in a dark room environment showing complex analytical software output
00:06
HD
Close-up vertical footage of an inkjet printer printing charts on white paper, technology concept
00:06
HD
Engineering team reviewing inspection report at refinery plant, industrial maintenance, production operation, facility management, engineering communication, technical inspection.
00:18
HD
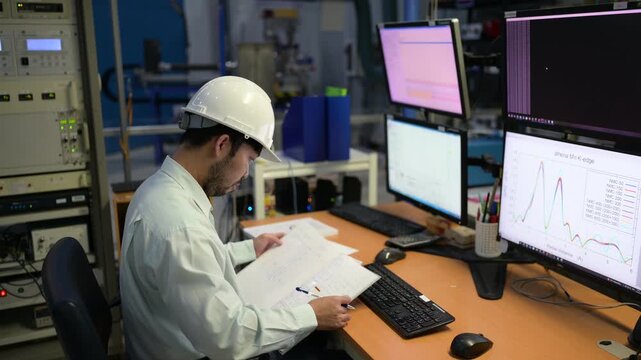
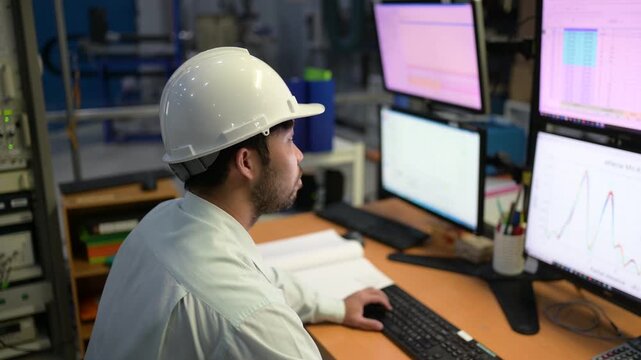
Plant operator documents equipment and process conditions at a multi screen workstation, representing industrial automation, technical analysis, system monitoring, and operations management.
00:14
HD
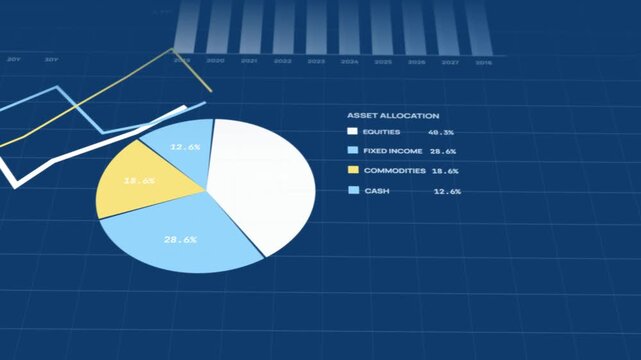
Blue technical drawing style interface displaying corporate asset allocation
00:15
HD
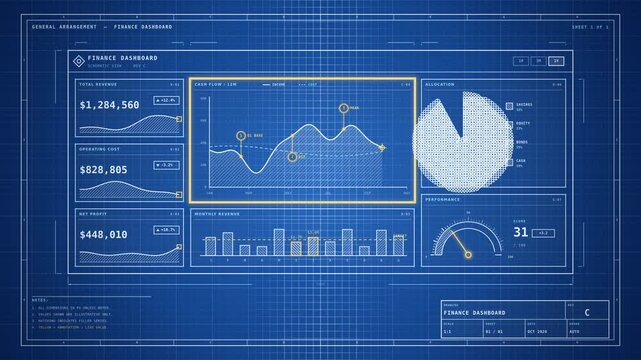
Blueprint style finance dashboard animation with technical drawing grid, cash flow chart, revenue bars, allocation pie and performance gauge
00:10
HD
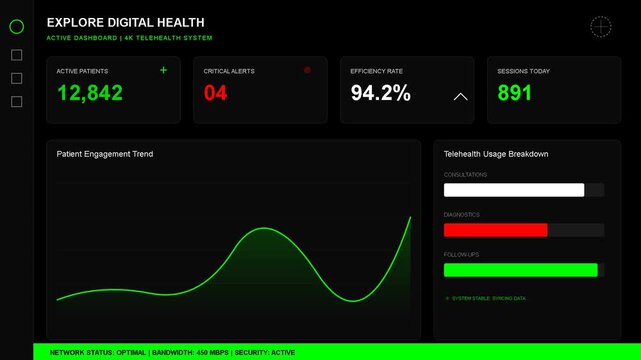
Digital health dashboard displaying live data metrics, wave graph, progress bars, and analytics interface for business performance monitoring and technical reporting
00:09
HD
Engineering Team Analyzing Technical Data and Pipeline Systems at Industrial Facility
00:15
HD
Financial market analysis and investment strategy planning, technical chart interpretation, and collaboration between traders to identify market trends and evaluate potential trading opportunities.
00:11
HD
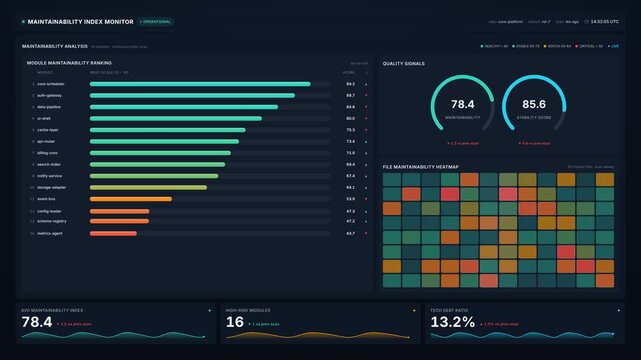
Software maintainability dashboard for module quality ranking bars, stability gauges, colored risk heatmap, for code health monitoring technical review
00:20
HD
Two Male Artificial Intelligence Developers Discussing and Sharing Technical Ideas with Colleague While Reviewing Computer Programming Information Displayed on Large Screen During Technology Meeting.
00:12
HD
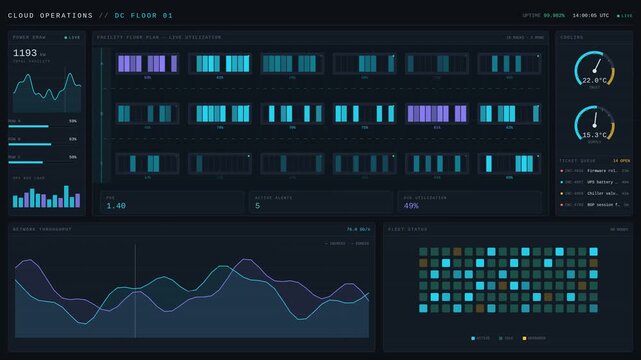
Digital data center cloud operations dashboard displaying real time analytics
00:15
HD
Portrait of Middle Eastern and African American construction managers in helmets discuss site plan. Supervisor speaks with engineer and gives instructions
00:16
HD
Attentive bald man matches digital meter display with documented data. Professional worker compares technical meter values with structured information in report sheet
00:08
HD
Cyber security incident report warning alert featuring glowing red neon hazard symbols over a digital global map background, representing data breach, threats and critical, information technology
00:10
HD
Engineers petrochemical checking report for technical inspections in oil refinery. Technicians working on checklist in the oil storage tank area. Factory and industry manufacturing. Crude Oil tank
00:12
HD
Pan shot of diverse group of middle aged specialists discussing reports during oil industry meeting. Ideal for corporate communication and energy sector marketing presentations
00:10
HD
Advanced data analytics and market research concept with statistical icons and technical gear structures.
00:15
HD
A professional office setup featuring a person using a laptop with floating graphs and statistics, symbolizing business analysis and strategic decision making. Xenic
00:10
HD
Neon document file icon animation. Text page symbol. File document sign. Paper, report, form, article and document management technical content and digital data storage concept animation.
00:10
HD
Three screen segments displaying digital biometric verification analysis of human hands with pulsing neon lines and changing data metrics over a dark atmospheric green interface display
00:06
HD
Scientific data analysis report and technical documentation for machine learning anomaly detection systems on minimalist paper interface
00:10
HD
Engineer communicates by handheld radio while reviewing inspection checklist beside industrial electrical equipment. Transformer maintenance coordination, technical report, facility safety monitoring.
00:16
HD
Plant operator documents equipment and process conditions at a multi screen workstation, representing industrial automation, technical analysis, system monitoring, and operations management.
00:13
HD
Online technical support platform concept. Person typing keyboard with repair and customer support icons, remote troubleshooting, technology support and digital service assistance.
00:15
HD
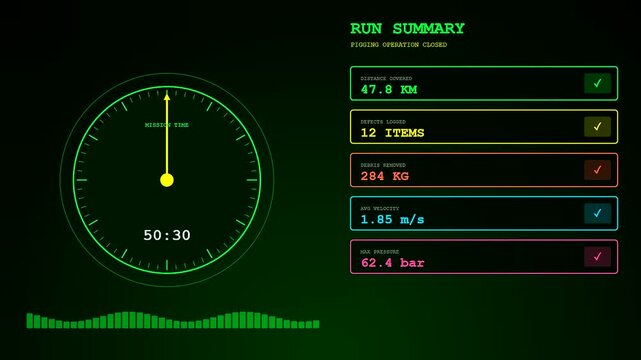
Pipeline pigging data displayed on a digital interface monitor showing circular progress gauges and green scrolling sound wave frequency bars during a complex monitoring system operation
00:06
HD
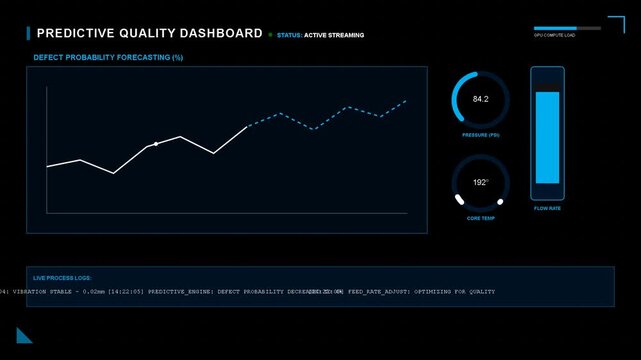
predictive quality dashboard analytics interface with live performance line graph, data monitoring, technical process oversight, system efficiency metrics
00:09
HD
Digital Infographic Dashboard with Network Connecting Icons 2D Animation
00:12
HD
Financial market analysis and investment strategy planning, technical chart interpretation, and collaboration between traders to identify market trends and evaluate potential trading opportunities.
00:12
HD
Engineering professionals collaborating during a project meeting while reviewing documents and discussing technical plans, business strategy, and research development.
00:12
HD
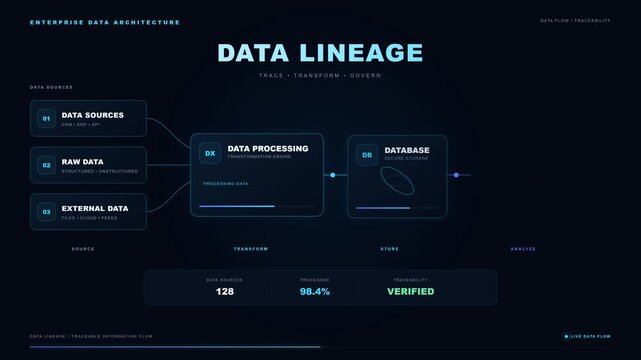
Modern digital infographic with glowing flow chart of data lineage process, concept for enterprise information architecture, business intelligence dashboard, software development report and corporate
00:10
HD
Futuristic blue world map built from luminous pixels combines floating statistics technical global connectivity, financial analytics, digital economy, information systems worldwide data exchange.
00:20
HD
Abstract circular interface element with data visualization on light. Technical abstract circular interface element for corporate report charts. Modern abstract circular interface element graphic.
00:06
HD
Organized bald engineer writes technical details into formal document as inspects various areas of building. Businessman records precise observations into report
00:17
HD
Dynamic digital gauge meter interface displaying fluctuating performance levels from low to with a glowing vital indicator needle for modern data analytics, business monitoring, and technical
00:10
HD
Engineers petrochemical checking report for technical inspections in oil refinery. Technicians working on checklist in the oil storage tank area. Factory and industry manufacturing. Crude Oil tank
00:09
HD
Tilt up close up shot of adult Caucasian cybersecurity operator wearing headset monitoring digital network interface and system data in control room and providing technical support
00:17
HD
Diagnostics concept with digital technology icons for testing, detection, condition analysis, data monitoring, and technical evaluation.
00:10
HD
Analytics strategy dashboard tracking corporate performance metrics and advanced technical data stream vectors
00:18
HD
digital dashboard displays a fluctuating yellow line graph indicating a 6.5% error rate set against a dark minimalist solid background representing technical system performance metrics
00:06
HD
Advanced data analytics and business intelligence concept with modern charts, research, and technical icons.
00:12
HD
Electrical safety inspector entering technical audit data into a tablet application and communicating real-time report status via portable walkie-talkie radio. Power engineer.
00:05
HD
Inference latency graph for performance metrics across different artificial intelligence model versions, for data visualization, system efficiency, speed optimization, technical analysis
00:20
HD
Plant operator documents equipment and process conditions at a multi screen workstation, representing industrial automation, technical analysis, system monitoring, and operations management.
00:13
HD
Focused corporate employee examines technical system architecture workflow document, cross-checking operational process charts beside desk tablet device.
00:16
HD
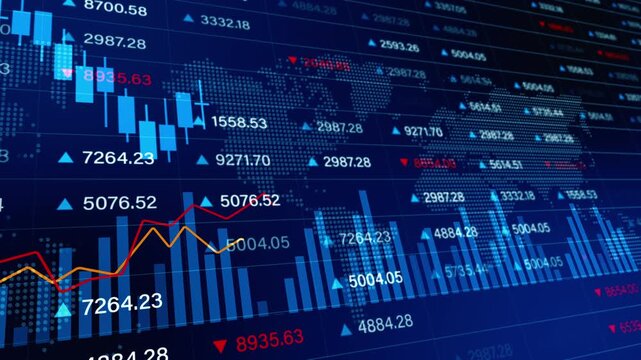
Global financial trading dashboard featuring candlestick charts, volume bars, and world map visualization representing international market trends and financial analytics. Investment background
00:20
HD
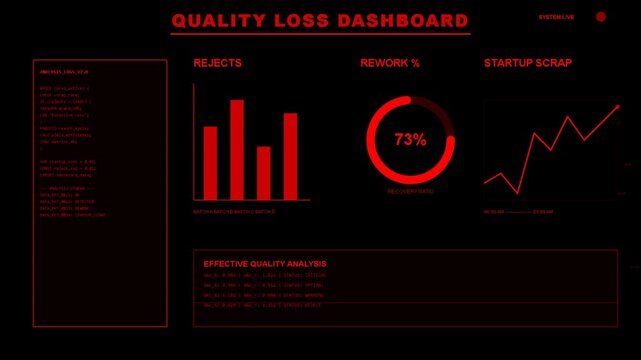
Digital quality loss dashboard with red charts, performance analytics, metric tracking, data visualization, interface monitoring, technical report
00:09
HD
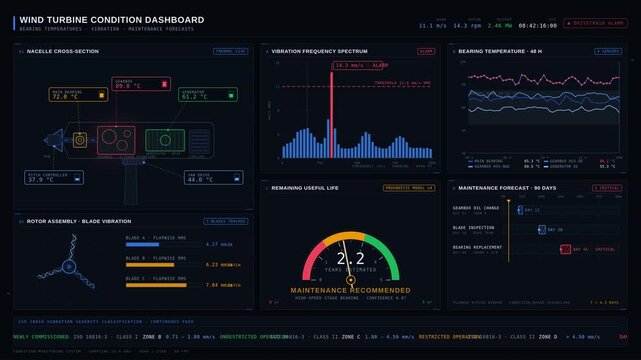
Industrial wind turbine condition dashboard showcasing bearing temperatures, vibration analysis, and maintenance forecasts with detailed technical schematics and monitoring panels.
00:15
HD
Financial market analysis and investment strategy planning, technical chart interpretation, and collaboration between traders to identify market trends and evaluate potential trading opportunities.
00:10
HD
Tirzepatide clinical trial data scan, dual action obesity medication dark mode research report text overlay
00:10
HD
College, students and laptop in class with stress, browser crash and late assignment with data loss. University, people and frustrated with tech for technical glitch, high plagiarism report and worry
00:09
HD
Motion graphic animation of technical seo analysis data charts and graphs, website optimization, coding development, online metrics
00:05
HD
Document management system and process automation concept. Quality business service. Animation of document sign with cogwheel gear icon isolated on transparent background.
00:15
HD
Professional Indian Software Engineer Presenting and Explaining Software Deployment Generative Artificial Intelligence Application Development to Colleagues During Professional Technical Meeting.
00:14
HD
Digital accuracy report concept with glowing cyber network interface featuring data analytics, cybersecurity, artificial intelligence, banking, and technical support for corporate business
00:10
HD
Engineers petrochemical checking report for technical inspections in oil refinery. Technicians working on checklist in the oil storage tank area. Factory and industry manufacturing. Crude Oil tank
00:16
HD
Engineer writing a report
00:27
HD
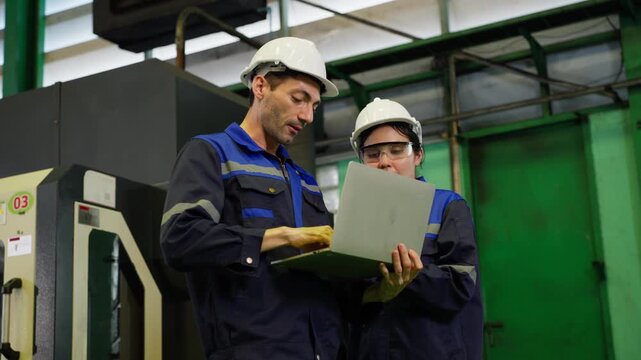
Focused technical worker with beard, wearing blue shirt and overalls, discussing details on smartphone while checking notes on clipboard in industrial facility.
00:14
HD
Tech Professional Facing System Error on Computer Screen in Dark Office Environment
00:05
HD
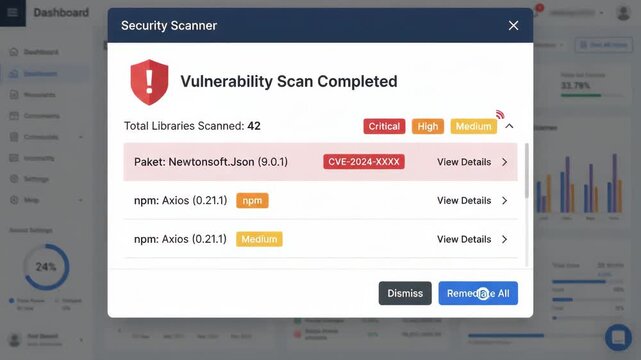
digital security scanner notification window displaying completed vulnerability scan with detected threats over blurred software dashboard interface background
00:06
HD
Product datasheets concept various digital documents like technical specifications, marketing materials, and statistical analysis for business information and detailed reports
00:17
HD
Business woman using tablet app showing progress report data walking through modern office to diverse people team meeting sharing group concepts steady motion
00:31
HD
Glowing digital checklist interface showing business project requirements
00:10
HD
Plant operator documents equipment and process conditions at a multi screen workstation, representing industrial automation, technical analysis, system monitoring, and operations management.
00:14
HD
Pre-purchase car inspection expert, vehicle appraisal specialist, man in suit with clipboard, used car check, auto valuation, dealership service, technical diagnostics, buyer consultation
00:10
HD
Critical Error Window on Computer Display. Digital System Warning Message for Cyber Security Concepts
00:10
HD
Digital dashboard showing performance statistics and data analysis, finance monitoring, network monitoring, technical metrics, system reporting
00:09
HD
Senior Chief Financial Officer Holding a Meeting with a Group of Fintech Investors. Diverse Team of Managers, Analysts and Board Members Having a Meeting in Front of Big Digital Screen with Reports
00:18
HD
Financial market analysis and investment strategy planning, technical chart interpretation, and collaboration between traders to identify market trends and evaluate potential trading opportunities.
00:11
HD
Showcasing green and red candlestick market patterns for finance data, technical trading, and investment symbols. Suitable for financial presentations.
00:10
HD
Man, engineer and reading with tablet at warehouse for research, machine update and technical guide. Mature person, digital and production manual, automation and diagnostics report for manufacturing

00:07
HD
Industrial engineer team collaborating on laptop to analyze production data and quality control metrics inside a modern manufacturing factory for operational efficiency and technical audit
00:12
HD
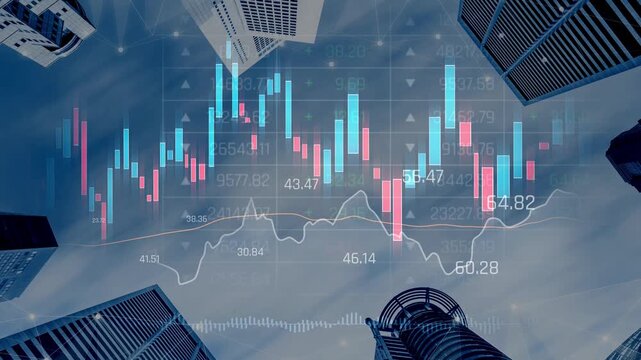
Candlestick chart visualizing financial market trends, investment patterns, price fluctuations, and trading strategy in capital and digital asset markets Marrow
00:10
HD
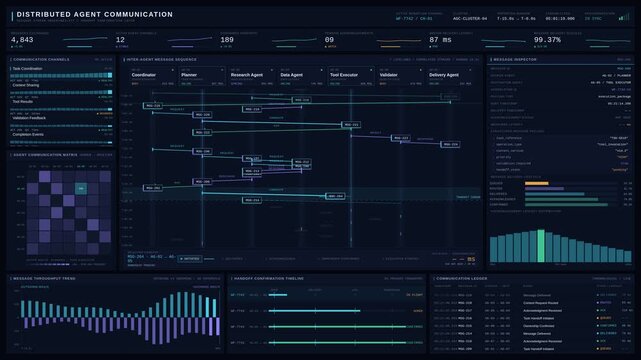
Explore a sophisticated multi-agent communication dashboard visualizing message streams, handoff confirmations, and operational analytics in a dark, technical workspace environment.
00:15
HD
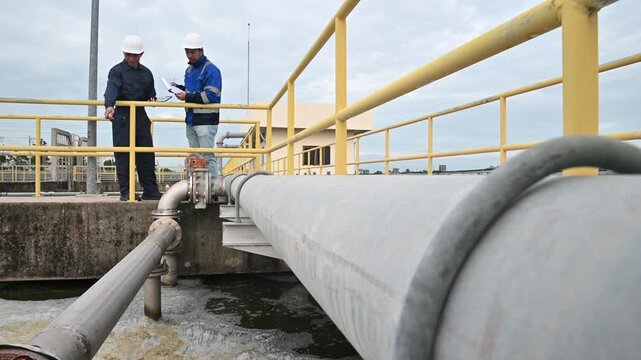
Engineers Checking Technical Plans and Pipeline Systems at an Industrial Treatment Plant
00:14
HD
Environment engineer using radio conversation with team and hand checking report waste water treatment pond in industrial plants Bio gas. Water pollution Sewage reduction for sustainable. Ecology ESG
00:14
HD
API driven server side event tracking infrastructure collects and process website interaction data, business intelligence and reporting.

00:11
HD
Diligent technician with beard and overalls writes on a clipboard, inspecting systems in a modern industrial data center. Focus on maintenance and technical documentation.
00:13
HD
Benchmarking as business compare tool. Performance, quality and cost comparison to competitor companies. Moving banner with entrepreneurs analyzing data. Cartoon flat animated graphics
00:10
HD
Digital dashboard displaying secure water leak detection system with pressure monitoring graphs and alert history logs set against dark background with additional analytical data charts
00:06
HD
Doctor in safety glasses reviews digital brain scans. Suitable for medical, scientific, technology, healthcare, and research concepts in graphics and design.
00:10
HD
Glowing red line chart showing market exchange crash, declining stock earnings report concept, downtrend profits and losses graph, business slowdown, neon technology style commodity prices animation
00:06
HD
Adult male technology professional wearing headset gestures beside multiple computer monitors, discussing software information during technical support communication and digital workflow in office.
00:07
HD