Et link til indstilling af din adgangskode er sendt til: For at få adgang til dine køb i fremtiden har du brug for en adgangskode.
Få 3 videoer eller 25 billeder med en gratis prøveversion
Nye filtre tilføjet
Sortér efter

19.768 resultater for increase and decrease i videoer

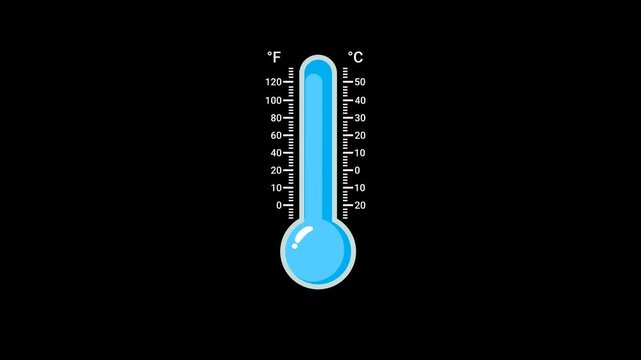
Thermometer Temperature Increase and Decrease Animation Clinic and Weather Alpha Channel 4K Resolution
00:06
HD
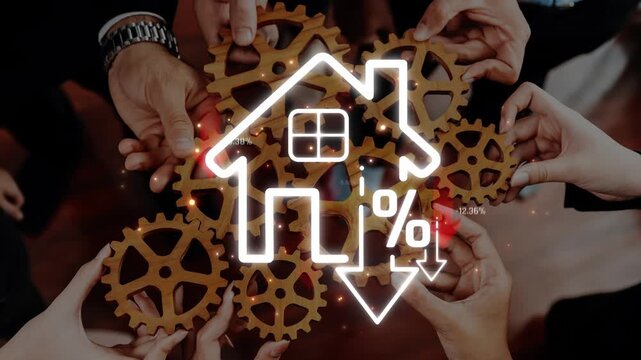
Hands Collaborating with Gears and a House Icon Representing Real Estate Market Dynamics and Economic Trends in Property Valuation and Investment Opportunities Sigmoid
00:15
HD
Screen Brightness Increase and Decrease Animation.
00:07
HD
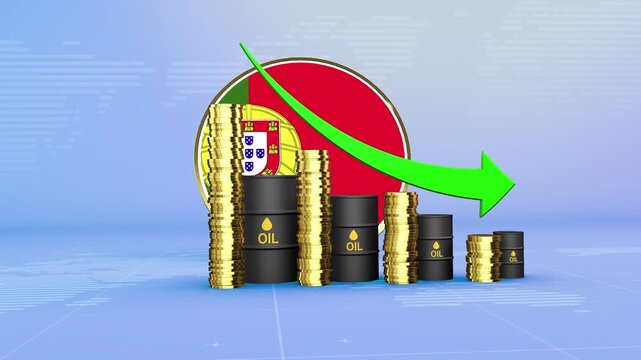
Portugal Oil Prices Decline with Oil Barrels, Gold Coins and Downward Green Arrow, 3D Economic and Financial Market Concept
00:11
HD
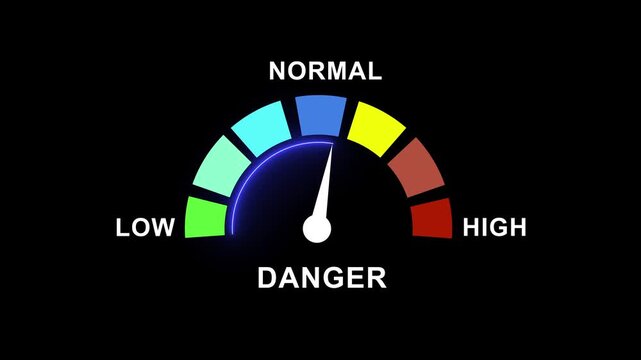
Dynamic danger gauge meter animation with moving needle indicating increasing risk levels from low to on a black background, for industrial safety, monitoring, risk assessment, and data visualization
00:10
HD
Wellness Word Cloud
00:11
HD
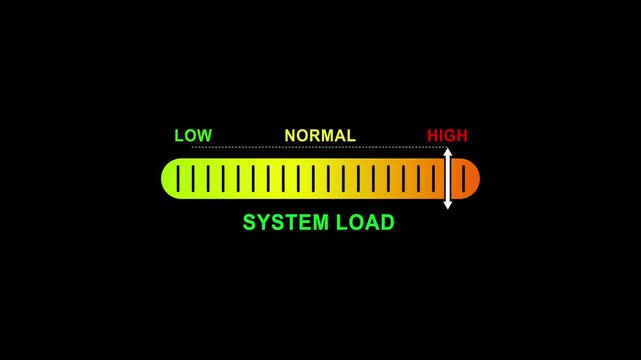
system load level indicator scale. Low normal high meter infographic animation on black background. Showing high pressure level color gauge indicator.4k animation video
00:10
HD
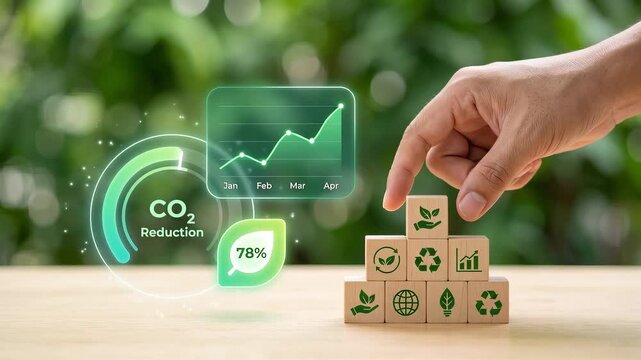
Hand Stacks Wooden Blocks with Green Icons on Desk to Promote Carbon Reduction, Track Environmental Goals, Support Recycling Efforts, Monitor Sustainability, and Protect Nature
00:05
HD
Business Loss Shown Through a Red Declining Graph, Highlighting Reduced Revenue, Falling Profitability, Financial Pressure, Market Challenges and Negative Growth
00:10
HD
Red Downward Arrow Icon Animation with Blue Gradient Background and Subtle Glow
00:05
HD
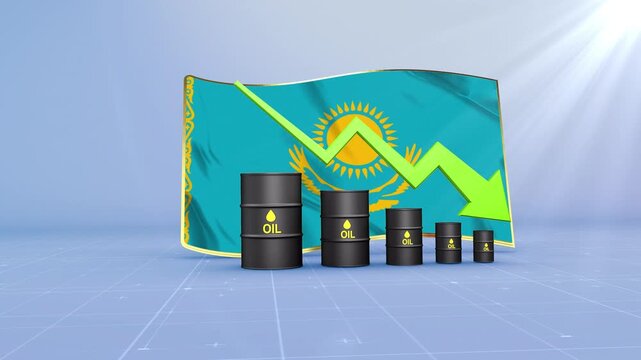
Kazakhstan Oil Price Falling with Oil Barrels Downward Green Arrow and 3D Financial Data Visualization Graphs for Economy and Business Concept
00:11
HD
Brightness slider level control animation isolated on black background, slider level adjust 0 to 100, simple brightness contrast icon animated.
00:06
HD
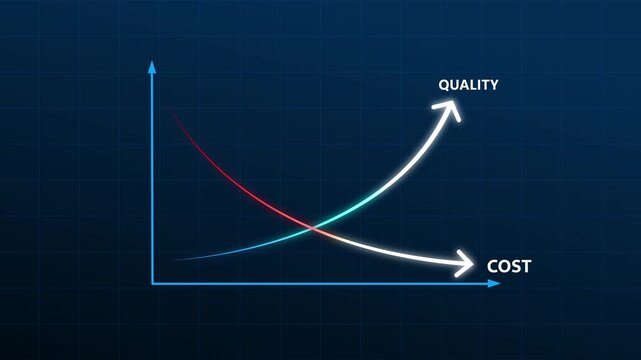
Inverse relationship chart animation scales on grids. Corporate inverse relationship chart animation tracks inverse links. Modern inverse relationship chart animation details paths.
00:08
HD
Zoom in and out animation the clipboard symbol. Large black symbol in the center and four small symbols around. Seamless looped 4k animation on white background
00:12
HD
Orange sticker with black outline displaying 10 percent text
00:08
HD
Green rising zigzag arrow on black background showing stock market recovery, with video animation.
00:10
HD
Red line graph against black background
00:05
HD
Red arrow, pointing down, with white outline, motion, graphic, on, Alpha channel, isolated, directional, indicator, downward, trend, decrease, negative, growth, download, icon.
00:07
HD
Glowing Neon Percentage Growth and Decline Icon Animation with Up and Down Arrows on Black Background, Financial Business Statistics, 4K Motion Graphics Loop..
00:10
HD
Bright white 3D number 2017 text animation floating against a deep black void offering a vibrant and modern visual for the year with a sense of digital energy.
00:10
HD
Minimalist bar chart animation showing declining business trends
00:10
HD
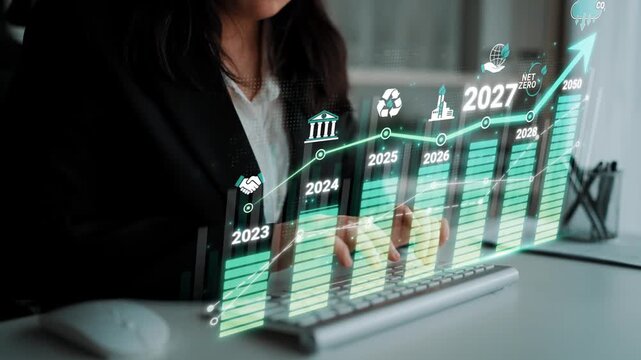
Business Professional Analyzing Growth Trends with Futuristic Graphs and Digital Interface for Sustainable Development Goals and Economic Projections Sigmoid
00:10
HD
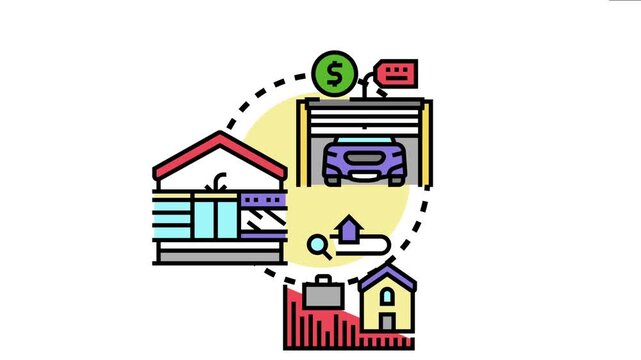
Property condition evaluation involves analyzing building structure. Asset value like a car in a garage with a price tag. And market trends represented by a chart and magnifying glass
00:17
HD
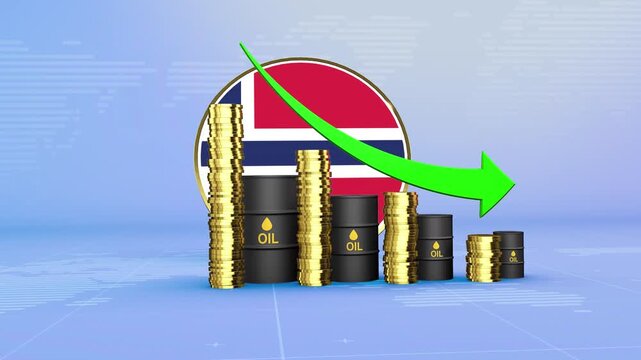
Norway Oil Prices Decline with Oil Barrels, Gold Coins and Downward Green Arrow, 3D Economic and Financial Market Concept
00:11
HD
Business executives collaborating on environmental sustainability strategy utilizing renewable energy solutions to achieve net zero targets in corporate meeting.
00:14
HD
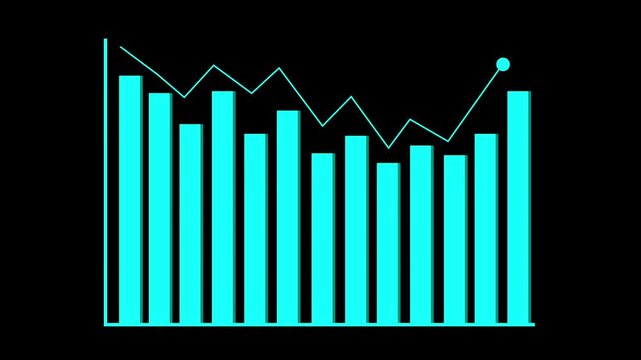
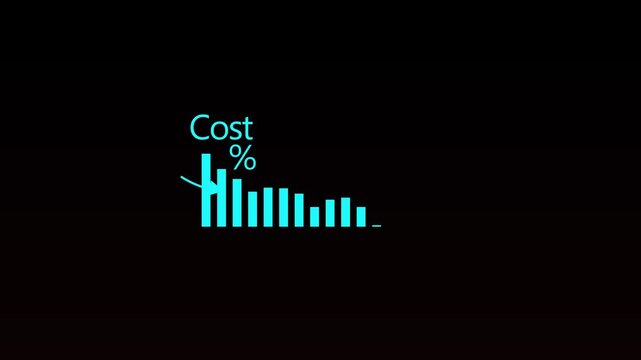
Cyan bar chart with downward trend line graph. Cyan bar chart for business loss or warning. Digital cyan bar chart animation for economic report.
00:12
HD
Currency fluctuation icon featuring money with upward and downward arrows. Visual representation of exchange rate movement and financial market changes.
00:10
HD
3D flat motion graphic animation of a colourful speedometer performance gauge meter increasing and decreasing percentage value isolated on green screen chroma key background for measurement technology
00:08
HD
Feed In Premium Word Cloud
00:09
HD
Stamina level indicator scale. Low Normal High meter infographic animation on black background. Animation showing high stamina level color gauge indicator for fitness and endurance monitoring.
00:10
HD
Liechtenstein Oil Price Falling with Oil Barrels Downward Green Arrow and 3D Financial Data Visualization Graphs for Economy and Business Concept
00:11
HD
Vibrant 3D graphic illustration of '11
00:08
HD
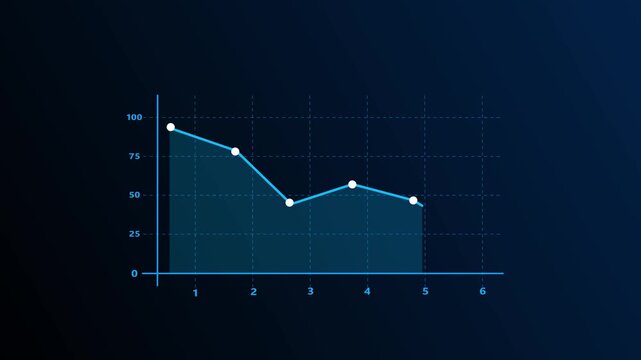
Modern line graph displays falling investment market trends. Technical line graph monitors negative corporate revenue data. Financial crisis concept with digital line graph.
00:10
HD
Zoom in and out animation the server symbol. Large black symbol in the center and four small symbols around. Seamless looped 4k animation on white background
00:12
HD
Minus and plus buttons press alternately inside a rounded ivory control on a sage background in a seamless eight second loop.
00:08
HD
Health Bar
00:06
HD
Seamless loop digital finance counter. Muted red and off-white colors with a forward zoom impact at $0 and $1000. Condensed typography on green screen.
00:12
HD
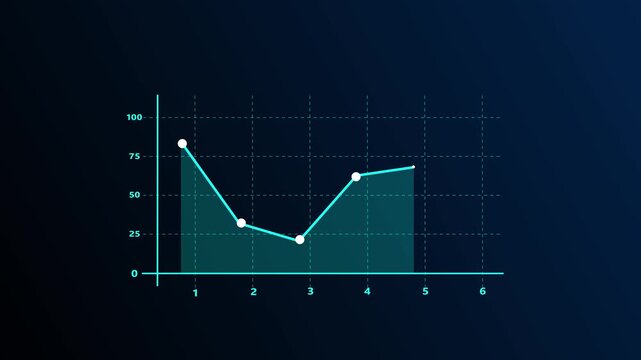
Graph displays AI traffic data with numbers for visitors and pageviews. The design has a blue background with a simple line showing trends.
00:10
HD
word LOSS dips letter by letter as a red downward graph line draws beneath it and ends in a descending arrow. Useful for financial loss with a transparent alpha channel for compositing
00:08
HD
Bright white 3D number 2031 text animation floating against a deep black void offering a vibrant and modern visual for the year with a sense of digital energy.
00:10
HD
Performance level indicator scale. Low normal & high meter infographic animation on bblackbackground. Showing high performance level color gauge indicator for business productivity efficiency and work
00:10
HD
Businessman Holding House Icon with Percentage Sign Indicating Decrease in Values, Financial Growth and Real Estate Decline Concept Sigmoid
00:10
HD
Financial consultant helping clients with personal debt reduction plans. Managing budgets. And calculating interest rates for loan payments and mortgage planning. Depicted as a comprehensive strategy
00:17
HD
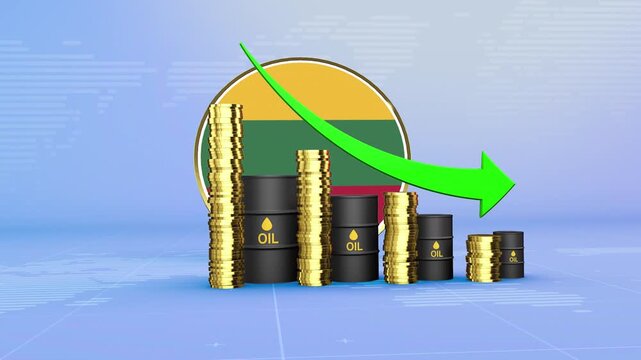
Lithuania Oil Prices Decline with Oil Barrels, Gold Coins and Downward Green Arrow, 3D Economic and Financial Market Concept
00:11
HD
Cost 2026business finance concept. Businessman cost reduction icon with down arrow for budget management and 4k Animation video
00:10
HD
Zigzag line with a downward arrow falling trend loss decline and negative business direction animation
00:06
HD
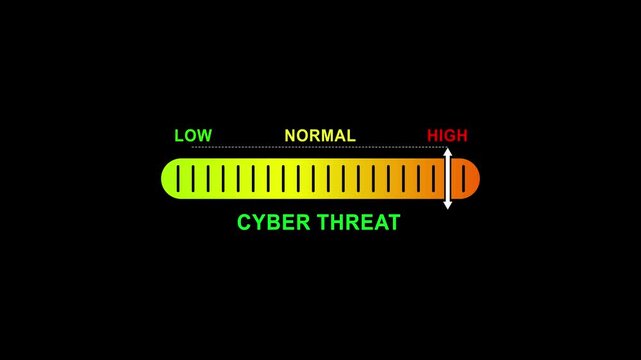
cyber threat level indicator scale. Low normal high meter infographic animation on black background. Showing high pressure level color gauge indicator.4k animation video
00:10
HD
graph chart up down business statistics
00:07
HD
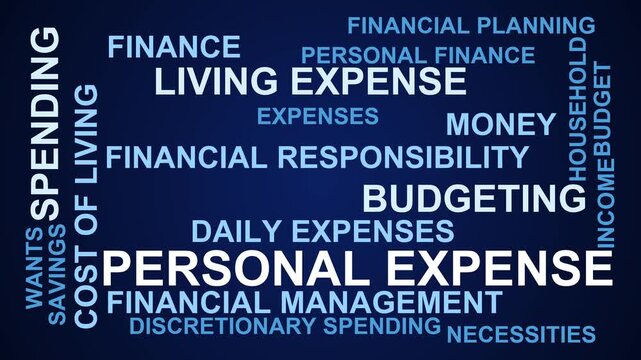
Personal Expense Word Cloud
00:11
HD
neon simple $ icon animation video
00:10
HD
Italy Oil Price Falling with Oil Barrels Downward Green Arrow and 3D Financial Data Visualization Graphs for Economy and Business Concept
00:11
HD
Red chart background glows with financial data. White and orange candlesticks show market movements. Green and yellow lines track rising and falling trends
00:10
HD
Modern line graph displays falling investment market trends. Technical line graph monitors negative corporate revenue data. Financial crisis concept with digital line graph.
00:10
HD
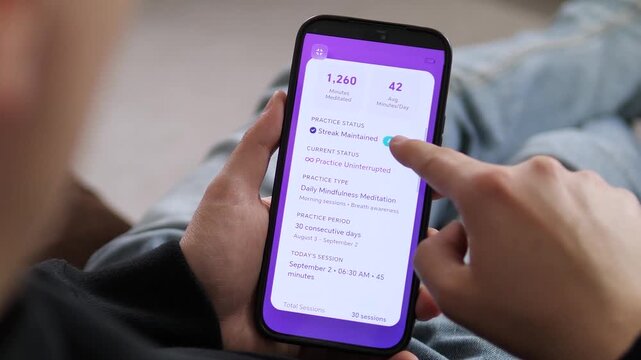
a user reviewing their mindfulness progress on a mobile device. The screen displays a 30 day streak, 1,260 minutes meditated, and a Streak Maintained status. Ideal for illustrating personal growth
00:12
HD
Illicit trade of Opioids tramadol and oxycodone or oxy is significant public health danger. Supplies contaminated with potent synthetic fentanyl. Counterfeit pills increases risk of fatal overdose.
00:20
HD
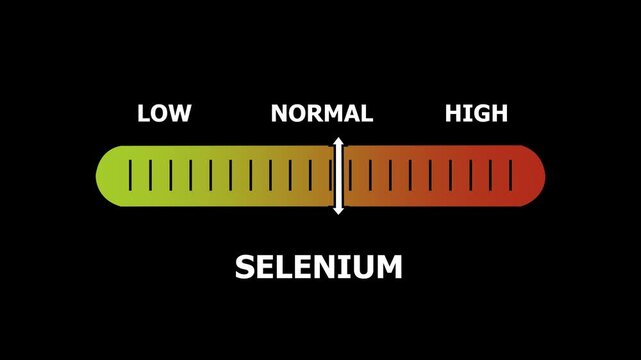
Selenium level indicator scale. Low normal & high meter infographic animation. Showing high selenium level color gauge indicator. on a black background 4k animation video
00:10
HD
Red arrow pointing down animation. Continuous Bouncing Motion Graphic for Directions and Download.
00:10
HD
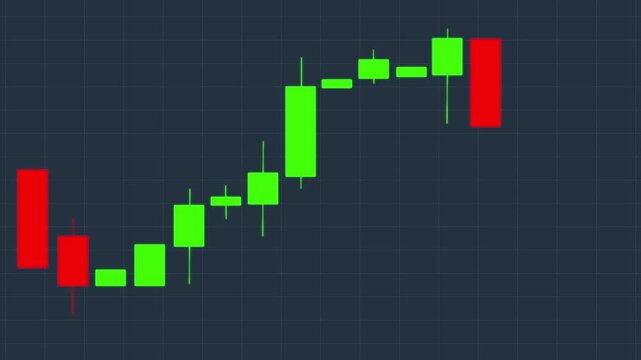
Stock Market Candlestick Chart Animation Showing Bullish Trend Rise Followed by Bearish Trend Fall, Financial Trading, Forex, Crypto Investment Analysis Graph on Dark Grid Background Loop
00:09
HD
Global business line animation. Abstract glowing neon line business graph growth arrow to down arrow.  loss, and negative trends on a dark, abstract background
00:10
HD
Bright white 3D number 2030 text animation floating against a deep black void offering a vibrant and modern visual for the year with a sense of digital energy.
00:10
HD
Mold level indicator scale. Low Normal High meter infographic animation on black background. Animation showing high mold level color gauge indicator for air quality and health safety monitoring.
00:10
HD
Businessman Holding Digital Chart with Growth Statistics Showing Future Projections Towards Carbon Neutrality by 2050 Sigmoid
00:10
HD
Hand holding money and another hand presenting financial services with a low interest tag. Connecting to a house icon and a rising bar chart. Symbolizing reduced loan expenses and better credit terms
00:17
HD
Barbados Oil Prices Decline with Oil Barrels, Gold Coins and Downward Green Arrow, 3D Economic and Financial Market Concept
00:11
HD
Glowing neon line graph downwards against black background animation. Stock market losses and descending trading graph and downward arrows recession
00:10
HD
White arrows rise upward, flanked by percentage symbols
00:10
HD
calcium level indicator scale. Low normal & high meter infographic animation. Showing high calcium level color gauge indicator. on a white background 4k animation video
00:10
HD
accuracy rate level indicator scale.Low normal high meter infographic animation on black background. Showing high pressure level color gauge indicator for health monitoring and safety analysis.4k
00:10
HD
Neon percentage icon animation with glowing blue up and down arrows for financial market, interest rate and business analytics.
00:10
HD
Blue neon Up and down arrow icon representing bidirectional movement, data transfer, upload and download, exchange, navigation, switching, workflow, financial transactions, and directional change.
00:10
HD
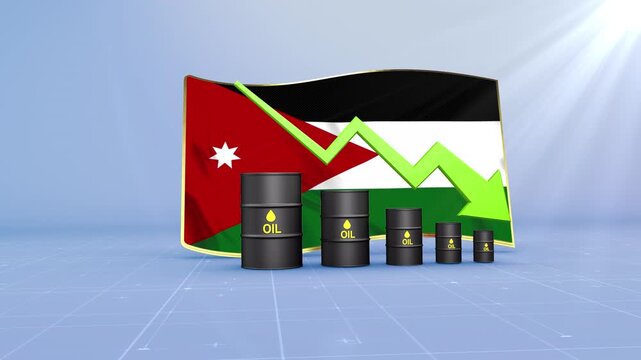
Jordan Oil Price Falling with Oil Barrels Downward Green Arrow and 3D Financial Data Visualization Graphs for Economy and Business Concept
00:11
HD
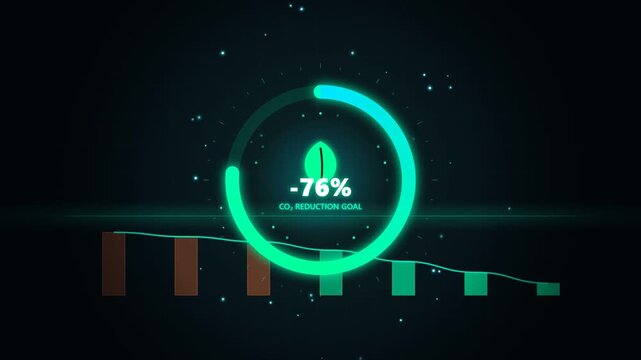
Futuristic CO2 Reduction Goal Tracker with Leaf Icon
00:12
HD
Young woman do yoga sitting green lawn, man meditating sunset, relaxing outdoors, girl relaxing sunset, yoga meditation, positive mental health, emotional balance practice, introspective quiet moment
00:10
HD
Financial Market Decline and Economic Downturn Falling Dollar Value, Decreasing Wealth, Shrinking Investment Returns, Lower Asset Prices, and Increasing Financial Risk
00:10
HD
Money crisis icon, Financial crisis vector icon, Dollar rate decrease vector line icon, Money symbol with down arrow, falling arrow infographic glyph icon. animation with black background
00:10
HD
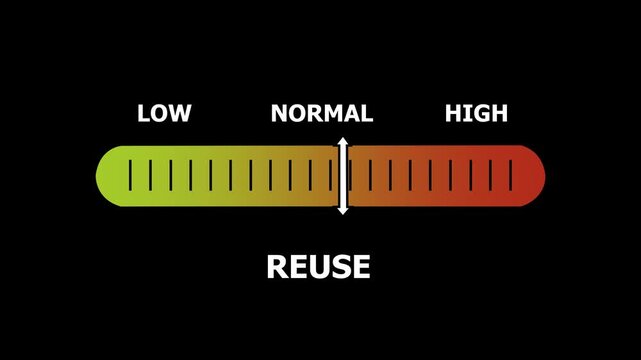
reuse level indicator scale. Low normal & high meter infographic animation. Showing high reuse level color gauge indicator. on a black background 4k animation video
00:10
HD
Innovative Finance Solution for Climate Action Promoting Sustainability through Renewable Energy Technology and Wind Power Strategy
00:05
HD
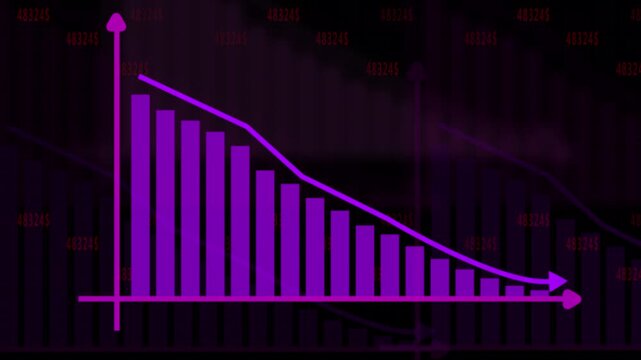
Purple bar chart showing downward trend with arrow graph. Financial loss chart for corporate performance failure metrics. Digital bar chart animation for network alert.
00:12
HD
Animated business infographic chart showing decrease in profits and financial decline. 4k financial diagram with appearing animated descending arrow, bar stats, lines and digital effects. Business
00:05
HD
Bright white 3D number 2040 text animation floating against a deep black void offering a vibrant and modern visual for the year with a sense of digital energy.
00:10
HD
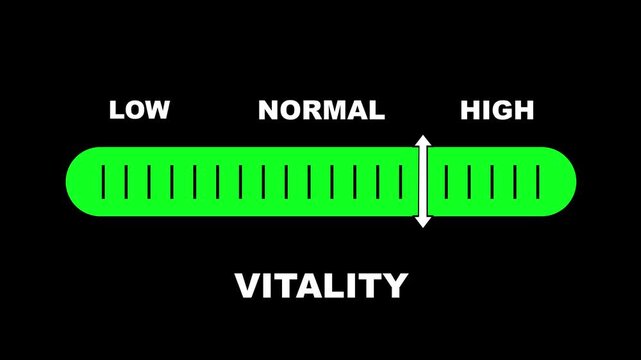
Vitality level indicator scale. Low normal & high meter infographic animation on black background. Showing high vitality level color gauge indicator for energy, health, and wellness monitoring
00:10
HD
Net zero goals and CO2 reduction strategy driving sustainability, green energy integration, net zero emissions policies, and climate-friendly sustainability solutions for business and society. Muxer
00:16
HD
System implementing performance calibration adjustment, analyzing feedback, making improvements, and optimizing settings for enhanced efficiency and quality outcomes in various operational contexts
00:17
HD
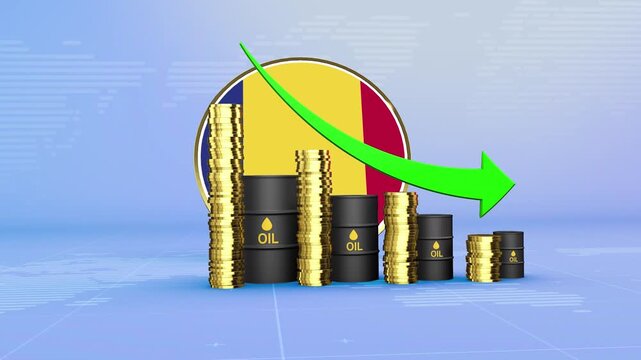
Romania Oil Prices Decline with Oil Barrels, Gold Coins and Downward Green Arrow, 3D Economic and Financial Market Concept
00:11
HD
Data corridor overlay appearing and monitoring eco power gauge filling then dropping beside racks
00:10
HD
Digital Graph Animation Abstract Motion Data Visualization
00:10
HD
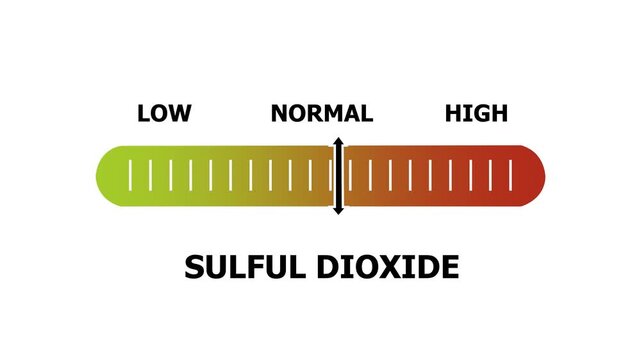
sulful dioxide level indicator scale. Low normal & high meter infographic animation. Showing high sulful dioxide level color gauge indicator. on a white background 4k animation video
00:10
HD
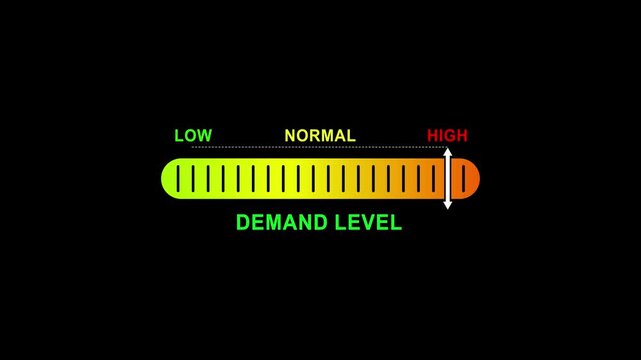
demand level indicator scale. Low normal high meter infographic animation on black background. Showing high pressure level color gauge indicator.4k animation video
00:10
HD
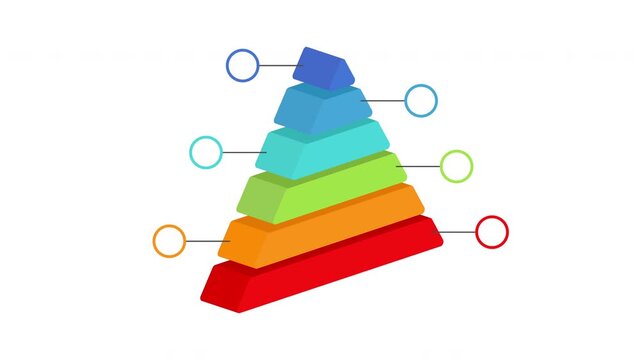
Commercial infographic animated 3D pyramid consisting of 6 blocks
00:07
HD
Business executives collaborating on environmental sustainability strategy utilizing renewable energy solutions to achieve net zero targets in corporate meeting.
00:12
HD
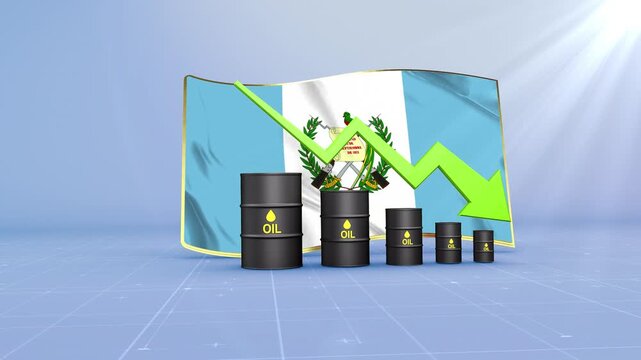
Guatemala Oil Price Falling with Oil Barrels Downward Green Arrow and 3D Financial Data Visualization Graphs for Economy and Business Concept
00:11
HD
Arrow animation pointing downward on black.
00:09
HD
budget planning icon and Business structure of network, financial forecasting tools, expense optimization strategies, cost reduction methods, investment management solutions
00:11
HD
Cyan Neon Arrows Moving Right in Graduated Sizes on Dark Background glowing 4k video .
00:10
HD
A vibrant display of green LED lights forming the word 'SALE' in a financial setting, highlighting significant price reductions and enticing customers within the trading environment.
00:05
HD
Neon style graph illustration with glowing outline and black background for business and data visualization
00:08
HD
Cost reduce and high quality control concept. Businessman holding cost with down arrow and quality with up arrow for business with keywords isolated on white board background.
00:10
HD
Increasing counting number 0 to 100k for price like views figures or amount concepts .4k motion graphics video animation
00:10
HD
Zoom in and out animation the mountains symbol. Large black symbol in the center and four small symbols around. Seamless looped 4k animation on white background
00:12
HD
Bright white 3D number 2050 text animation floating against a deep black void offering a vibrant and modern visual for the year with a sense of digital energy.
00:10
HD