Et link til indstilling af din adgangskode er sendt til: For at få adgang til dine køb i fremtiden har du brug for en adgangskode.
Få 3 videoer eller 25 billeder med en gratis prøveversion
Nye filtre tilføjet
Sortér efter

19.768 resultater for increase and decrease i videoer

Cost reduction business finance concept. Costs cut, and costs optimization business. cost reduction icon for budget management and cost management.
00:10
HD
Stack of polished silver bars representing trading, wealth, and economic stability, glowing reflections, modern financial concept, studio lighting, cinematic composition,
00:06
HD
A scenic trail meanders through a dense forest, highlighting efforts in carbon sequestration and promoting preservation and rewilding of natural habitats. Sustainable carbon reduction
00:10
HD
Abstract 3D number 1942 text animation floating against a deep black void offering a vibrant and modern visual for the year with a sense of digital energy. 4k motion video.
00:10
HD
Green recycling symbol rising dynamically through verdant plants, representing environmental sustainability, waste reduction, and ecological conservation efforts in natural ecosystem context
00:11
HD
Lithuania Country Flag and Bar Chart Graph Showing Decreasing Values a Red Arrow Economic Crisis Concept
00:11
HD
Three-word text animation featuring Edit More Creatively with sequential word reveal, spacing reduction effect, and zoom transition in 3840x2160 format.
00:12
HD
Green energy concept help reduce global warming.Carbon dioxide emission in industry zero carbon concept. 4K loop
00:08
HD
camera fly through an endless round tunnel with glowing neon rings. loop animation 3d render
00:12
HD
Night landscape of the waning moon in Rome
00:11
HD
Rising stock exchange chart or business graph. Close-up white screen with graph. Line moves up during the year. Business, investment, earnings, tax and revenue concept. 3D animation
00:14
HD
Cost reduction and cost saving through digital transformation, business cost optimization, operational cost reduction, financial savings, and resource efficiency strategies for business success. Spire
00:20
HD
Stock market tickers going up, with digital green animation of the board of the evolution of stock market prices. Financial chart of stock exchange data - 4K animation
00:15
HD
Neon rising arrow animation, success concept. Profit growing icon animation.  Profit growing icon animation. Growing graph symbol animation.
Neon arrow rising transparent channel arrow animation.
00:10
HD
In the lower corner of the image, the corner of the thick line increases and decreases. In the upper corner, dots of different sizes change and move.
00:07
HD
Stack Coins with Financial Charts Growth Numbers Business Money Market Analysis Display
00:10
HD
Closeup stock market display showing fluctuating numbers and lines representing market trends
00:08
HD
Maximum Production concept with node turning full, 4k animation. Industrial concept, business, growth
00:07
HD
Glowing green line graph displays fluctuating data on a dark digital screen.
00:08
HD
Dynamic Growth and Decline Bar Graph Animation
00:22
HD
Carbon offset credit price control report Future growth Net zero waste ESG clean energy office protect climate change social issue project Group asia people advice Eco friendly go green SDGs risk plan
00:12
HD
Zoom in and out animation the approximately equal symbol. Large black symbol in the center and four small symbols around. Seamless looped 4k animation on white background
00:12
HD
Burning financial data visualization
00:05
HD
abstract Business growth and success arrow, growing business chart animation. 4k motion graphics animation.
00:10
HD
The big heart of red squares increases and decreases, looped
00:06
HD
Ladonia Country Flag and Bar Chart Graph Showing Decreasing Values a Red Arrow Economic Crisis Concept
00:11
HD
Neon Down Dollar Sign in hand. motion graphic
00:14
HD
Negative revenue rate. Declining Graph Analysis Downward Trend in Data Metrics and Performance Statistics Illustrating Loss and Reduction
00:05
HD
flying the camera through many different cubes of delicate color. 3d render. looped animated background
00:10
HD
Slice of watermelon looped rotation. Watermelon with seeds motion animation. Increase and decrease tween animation. Horizontal composition, 4k video quality
00:10
HD
A vibrant graphic representation of a financial trend showcasing colorful upward and downward lines against a dark backdrop. Ideal for finance and business themes.
00:05
HD
A robotic hand highlights the contrast between rising quality and falling costs in a sleek office environment, symbolizing the transformative power of technology in business. Auvana
00:12
HD
arrow rising transparent channel, right business growth arrow and graph chart. Abstract arrow growth chart of economy icon animation.
00:10
HD
Loopable: Computer display with stock market, forex or cryptocurrency exchange dynamically evolving asset prices.
00:20
HD
A before and after image of a greenhouse with manual shading versus one with automated shading showcasing the increased crop yield and reduced labor costs with the automated system.
00:07
HD
Blue Neon Plus and Minus Arrow Icons, Market Growth and Decline, Finance and Investment Concept on black background.
00:10
HD
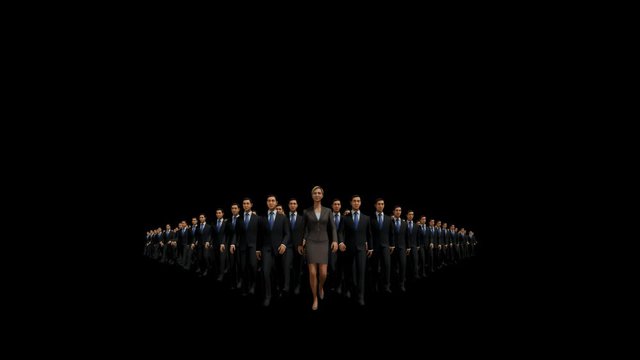
Businessmen lead by a businesswoman, 4K, against black
00:30
HD
Air quality monitor placed on concrete steps, displaying changing levels of pollution, possibly indicating increasing or decreasing air quality over time
00:06
HD
A hand gently cradles a small, vibrant green sapling emerging from rich, dark soil, symbolizing growth and environmental sustainability
00:10
HD
Sustainability: Choosing Recycling and Environmental Responsibility - ISO 14001, Renewable Energy, and Circular Economy Concepts
00:08
HD
Horizontal Row of Purple Chevron Arrows Pointing Leftward on Black Background direction
00:10
HD
Net zero  2050. Carbon neutral concept. Net zero greenhouse gas emissions target. Climate neutral long term strategy.Growth chart with net zero icons. No toxic gase. 4k video
00:10
HD
Financial Growth Concept with Dollar Sign and Up Down Arrows Graphic Animated Motion Graphic
00:05
HD
Abstract 3D number 1939 text animation floating against a deep black void offering a vibrant and modern visual for the year with a sense of digital energy. 4k motion video.
00:10
HD
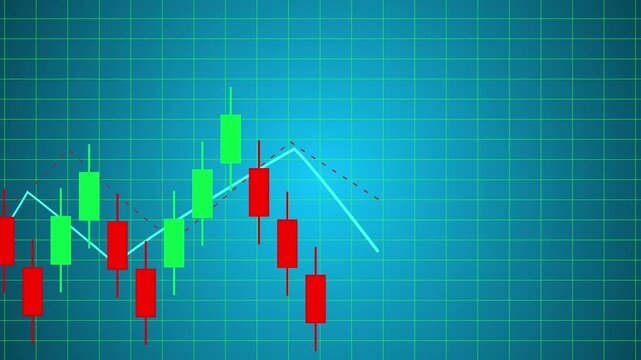
Financial Market Stock Chart Candlestick Pattern Data Analysis Trading Investment Risk Decrease
00:10
HD
a glowing neon trends icon animation video on black background
00:10
HD
Financial business Loss down graph chart. business loss concept.
00:08
HD
Zoom in and out animation the two-handed saw symbol. Large black symbol in the center and four small symbols around. Seamless looped 4k animation on white background
00:12
HD
camera fly through an endless round tunnel with glowing neon rings. loop animation 3d render
00:12
HD
interest rates and inflation texts and graphs showing rates going up and consumer spending going down in front of stacks of coins
00:11
HD
Money loss. Cash with down arrow stocks graph, concept of financial crisis, market fall. Money, profit, investment, growth business market fall. neon down arrow stocks graph with black background.
00:10
HD
Cost reduction and cost saving through digital transformation, business cost optimization, operational cost reduction, financial savings, and resource efficiency strategies for business success. Elide
00:14
HD
arrow rising transparent channel, Business line arrow, Business Growth And Success Arrow Infographics, Following business Arrow animation.
00:08
HD
Stock market and exchange, chart and data. Business, trading, market research, investment. 3D animation
00:16
HD
Business carbon credit. CO2 symbol green leaf above stack of gold coins representing environmental finance and sustainable investment concept with carbon emission reduction
00:05
HD
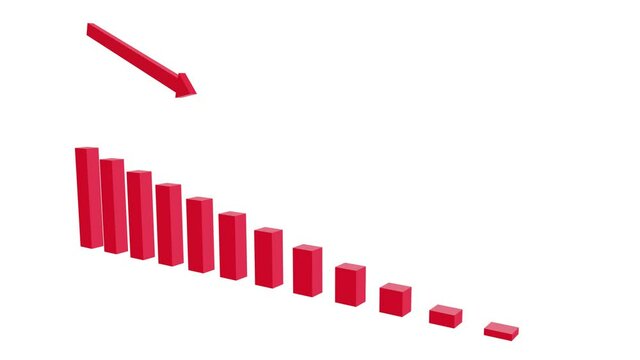
Falling bar graph in red with arrow. 3d animation in 4K.
00:10
HD
An animated market trend icon with rising and falling line graph, smooth line drawing animation, subtle easing, gentle vertical tilt camera movement, flat style, loop.
00:08
HD
Starting helix rotation causing currency values sliding and updating to visualize market shifts
00:10
HD
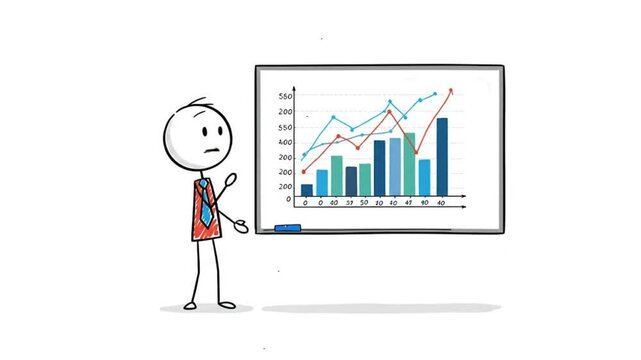
Stick figure businessman presenting bar graph
00:08
HD
Speaker volume with sound wave icon animation on transparent background, alpha channel, 4K resolution
00:05
HD
Man listening to music on headphones
00:11
HD
Businessmen with a businesswoman in front forming arrow shape pointing down, 4K against black
00:29
HD
Earth Green Energy Infographics Full Orb Night Green Icons Place Your Own Text
00:12
HD
Animated education Sector Performance Meter – Increasing and Decreasing Gauge from Good to Best Levels, Comparison Indicator for  Data Visualization,  perfomance, and Motion Graphic Reports
00:10
HD
Jersey Country Flag and Bar Chart Graph Showing Decreasing Values a Red Arrow Economic Crisis Concept
00:11
HD
Argentina money banknote fallen from sky then fire burn out for money loss concept
00:11
HD
Rising arrow transparent channel. arrow rising transparent channel, business growth arrow and graph chart, Business line arrow.
00:10
HD
Zoom in and out animation the leaflet symbol. Large black symbol in the center and four small symbols around. Seamless looped 4k animation on white background
00:12
HD
Trade Stock market business and exchange financial growth graph Chart arrow . Business chart data graph diagram, business trading graph investment growth global trend arrow up and down icon animation
00:12
HD
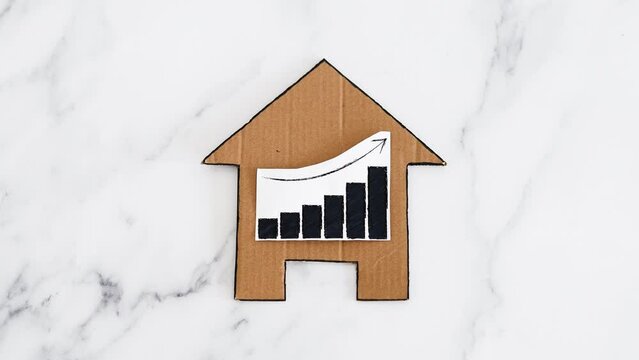
mortgages rentals and property prices increasing, house icon made of cardboard with graph showing stats going up
00:07
HD
Animation of up and down business graph icon. Animated bar graph fluctuating in suitable for showing business stable up down, black background .
00:10
HD
A striking image illustrating the dynamic relationship between quality and cost in a business context, featuring light arrows, a laptop, and a professional setting. Qubit
00:15
HD
flyby of the camera through the red-blue rings with glowing lines on a black background. looped abstract animated screensaver background. endless tunnel. 3d render
00:10
HD
Set of Animated Hand Drawn Doodle Arrows. Arrow sketch handmade doodle swipe up symbusiness growth arrow and graph chart, Business line arrow.bol sign isolated on green screen background,
00:08
HD
Financial stock market numbers. Business success and growth concept. Monochrome. Abstract economy data on screen display. Loop animation.
00:15
HD
Declining bar graph with a downward-sloping arrow, representing a decrease or recession in business or financial metrics. Falling Chart with Arrow Animation, Animated Financial Crisis Chart
00:10
HD
4K Stop of motion stack overload document report paper with paperclip place increase, business and education concept footage paperless used.
00:14
HD
Evolution of carbon dioxide concentration in the atmosphere. Glowing neon arrow point to increasing arrow with carbon reduction for for decrease CO2 , carbon footprint climate change.
00:10
HD
Stock market data on tablet
00:29
HD
White Financial growth decrease icon isolated on green background. Increasing revenue. 4K Video motion graphic animation
00:10
HD
money stack on table, Wealth Increasing and Decreasing - Global Financing
00:05
HD
Man drinking protein shake in the kitchen from a shaker. Concept: sports supplements, nutrition, bodybuilding, fitness
00:18
HD
Abstract 3D number 1935 text animation floating against a deep black void offering a vibrant and modern visual for the year with a sense of digital energy. 4k motion video.
00:10
HD
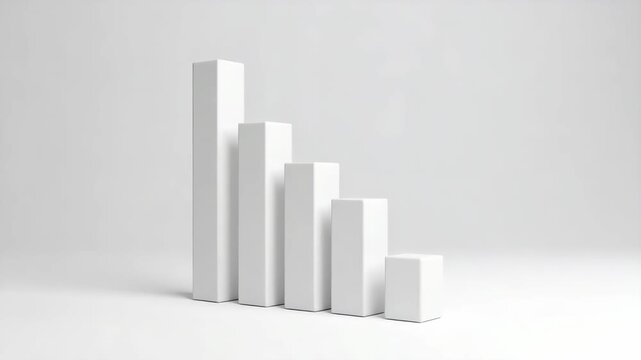
Five white rectangular bars arranged in a descending order against a light gray background.
00:10
HD
Money reduction icon. Dollar currency price drop concept. circle with down arrow moving animation.4k video
00:06
HD
Neon Business graph chart Down concept. Arrow down on graph sale symbols.Business arrow moving down sign.Bar chart for declining business performance by month. The red statistical curve shows.
00:10
HD
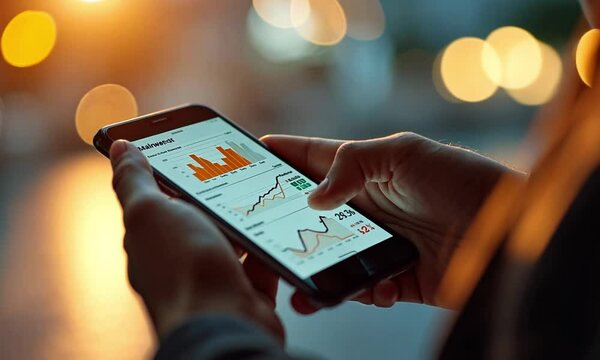
Person reviewing financial data on smartphone at night.
00:10
HD
A businessman hand reaches out towards glowing icons and graphs representing cost reduction and financial efficiency. The dark background enhances the digital theme. Qubit
00:15
HD
A businessman analyzing cost reduction strategies on a smartphone, showcasing digital charts and graphs for informed financial decision making in a modern office setting. Qubit
00:14
HD
Cost reduction and cost saving through digital transformation, business cost optimization, operational cost reduction, financial savings, and resource efficiency strategies for business success. Muxer
00:15
HD
A robotic hand points towards a digital representation of a cost percentage and a data graph, illustrating the intersection of technology and financial analysis in a corporate environment. Synapse
00:12
HD
A businessman showcases digital icons representing cost reduction and financial analysis, emphasizing technology role in enhancing business strategy and growth. Qubit
00:14
HD
Cost reduction and cost saving through digital transformation, business cost optimization, operational cost reduction, financial savings, and resource efficiency strategies for business success. Muxer
00:18
HD
A dynamic business meeting showcasing professionals analyzing global financial trends and cost reduction strategies using charts and data insights at a conference table. Raster
00:20
HD
Cost reduction and cost saving through digital transformation, business cost optimization, operational cost reduction, financial savings, and resource efficiency strategies for business success. Muxer
00:16
HD
Visual representation of quality and cost metrics in a business context, featuring a robotic hand engaging with digital indicators in a modern office setting. Auvana
00:12
HD
Cost reduction and cost saving through digital transformation, business cost optimization, operational cost reduction, financial savings, and resource efficiency strategies for business success. Elide
00:14
HD
Trade Stock market business and exchange financial growth graph Chart arrow . Business chart data graph diagram, business trading graph investment growth global trend arrow up and down icon animation
00:12
HD
Trade Stock market business and exchange financial growth graph Chart arrow . Business chart data graph diagram, business trading graph investment growth global trend arrow up and down icon animation
00:12
HD
Conceptual illustrating the inverse relationship between and cost with upward green neon arrows representing increasing and downward green neon arrows representing decreasing cost reflected below a
00:10
HD