Et link til indstilling af din adgangskode er sendt til: For at få adgang til dine køb i fremtiden har du brug for en adgangskode.
Få 3 videoer eller 25 billeder med en gratis prøveversion
Nye filtre tilføjet
Sortér efter

19.767 resultater for increase and decrease i videoer

Quality control and company cost reduction. Cost and quality control concept. Successful organization strategy and management.
00:10
HD
Glowing red bar chart and downward arrow illustrating business decline, financial loss and economic downturn. Concept of recession, falling profits, market crash and negative growth performance
00:12
HD
Dynamic Workload Level Indicator Gauge Animation showing Light, Moderate, Heavy Progression
00:07
HD
Trends in data analysis with graphs showing fluctuations over time in a dark environment.
00:10
HD
Monetary devaluation causes economic challenges, featuring a person climbing obstacles, a dollar decreasing in value, and an increasing percentage representing inflation or rising interest rates
00:17
HD
Interest rate investment concept with hand holding percentage symbol, stock market bull bear, money, finance on wooden table
00:08
HD
Abstract 3D number 1940 text animation floating against a deep black void offering a vibrant and modern visual for the year with a sense of digital energy. 4k motion video.
00:10
HD
Financial Report Presentation Animation with Business Growth Visualization
00:10
HD
sound volume icon level up down sound control
00:15
HD
Economies Of Scale Word Cloud
00:11
HD
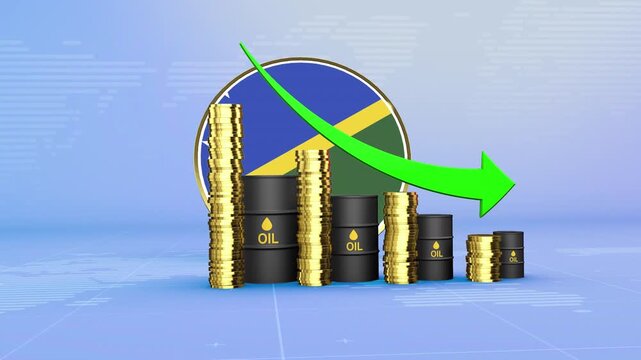
Solomon Islands Oil Prices Decline with Oil Barrels, Gold Coins and Downward Green Arrow, 3D Economic and Financial Market Concept
00:11
HD
A dynamic business meeting showcasing teamwork and analysis focused on sustainable practices and carbon neutrality in a modern office setting. Raster
00:12
HD
Man listening to music on headphones
00:11
HD
Concept of carbon credit for lowering carbon emissions goals for investment in sustainable businesses.
00:10
HD
Bar Chart: A dynamic and eye-catching bar chart with a gradient of vibrant neon colors illustrates data growth and progress on a reflective surface,
00:10
HD
Business grow-ting arrow. Rising bar follow the arrow. Abstract neon arrow growth , success concept. Profit growing icon animation.
00:10
HD
Asian business team discussion reusable product in office,start up eco-friendly business,environmental protection,sustainable business model,ESG strategy,team meeting,people work at home concept
00:13
HD
Balance amount decreasing from 10000 to 0 dollars on black background.Decreasing Amount Animation.4k video animated.
00:10
HD
Neon line Percentage icon Quality control growth graph and cost reduction animation. Percentage quality with up arrow, cost with down arrow.
00:10
HD
Arrow continuous line 4K animation video showing downward direction on a minimal background
00:10
HD
A bar chart representing daily stock price movements for a specific company over the past week, each bar changing color on whether stock price went up or down, 4K High-Quality Animation Video
00:16
HD
Mesmerizing animated market trends with dynamic charts and bars showcasing cryptocurrency and finance, highlighting profits and losses, increases and decreases.
00:15
HD
A diverse group discusses data on a screen, with energy impact stats and remote participant feeds
00:08
HD
Horizontal Row of Blue Chevron Arrows Pointing Leftward on Black Background direction
00:10
HD
Stock market data visualization with candle chart and bar graph analytics
00:07
HD
Bitcoin and Coin Bar Chart Analysis, Bitcoin and dollar analyst data trending, Simple and minimalist flat 2d Animation
00:10
HD
Bright white 3D number 2007 text animation floating against a deep black void offering a vibrant and modern visual for the year with a sense of digital energy.
00:10
HD
Abstract digital visualization of data points and audio waveforms, displayed in vibrant pink and red hues
00:10
HD
The Inflation Sign in Sky
00:10
HD
Community Impact Word Cloud
00:11
HD
Serbia Oil Prices Decline with Oil Barrels, Gold Coins and Downward Green Arrow, 3D Economic and Financial Market Concept
00:11
HD
A business professional engages with a laptop, exploring innovative green energy solutions and illustrated CO2 emissions concepts in a modern, digital setting. Cipher
00:10
HD
Rapid change of stock market with Exchange and bid, offer, volume on screen display
00:13
HD
Dynamic sale bubbles with percentage discounts float across a vibrant green background, signaling exciting price reductions and shopping opportunities.
00:05
HD
Showcasing innovative technology that promotes sustainability, this display features sleek designs alongside a globe adorned with greenery, highlighting eco-conscious practices and solutions
00:04
HD
Yellow Bar Chart Illustrating a Decreasing Trend on a Grid Background graph data. Abstract digital graph with neon yellow bars decreasing across grid forming dynamic data visualization.
00:09
HD
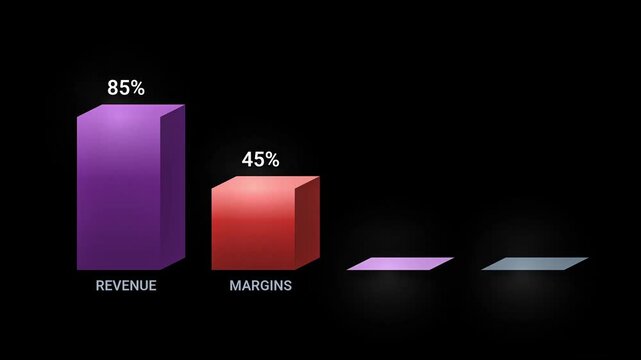
animated bar chart showing changes in revenue, margins, equity and assets
00:15
HD
animated video a graphic of increasing, decreasing, and stable
00:04
HD
Business Growth Graph Going down. Alpha Channel Transparent Background.
00:05
HD
ircular economy concept for future business growth and environmental sustainability and reduce pollution for future business and environmental growth .4k corporate video.
00:15
HD
Arrow continuous line 4K animation video showing downward direction on a minimal background
00:10
HD
Gas stovetop burner flames ignite, grow, and diminish in a dark teal kitchen, showcasing combustion, energy, and the cooking process
00:07
HD
Red and blue financial stock market chart with downward trend, trading data, bokeh lights, investment and economic analysis, finance concept.
00:05
HD
Financial Market Data Analysis Showing Declining Trends and Statistics on a Digital Screen with Red Chart Lines Indicating Downward Movement in Economy
00:08
HD
Logistics cost management drives business efficiency by reducing expenses and optimizing operations for maximum cost reduction
00:05
HD
Animated bar chart with falling trend line and downward arrow on clean background, representing financial loss, market decline, negative growth, and business downturn.
00:10
HD
Neon glowing medical thermometer icon animation. That's indicates weather temperature 80 degree increase or decline. Thermometer equipment showing hot or cold weather.

00:10
HD
Declining Graph Trends Data Analysis
00:10
HD
Animated Productivity Performance Meter – Increasing and Decreasing Gauge from Good to Best Levels, Comparison Indicator for  Data Visualization,  perfomance, and Motion Graphic Reports
00:10
HD
Pressure Regulator Word Cloud
00:11
HD
Increasing counting number 0 to 50k for price like views figures or amount concepts
00:12
HD
A robotic hand points towards a digital representation of a cost percentage and a data graph, illustrating the intersection of technology and financial analysis in a corporate environment. Synapse
00:13
HD
Rapid change of stock market with Exchange and bid, offer, volume on screen display
00:12
HD
Blue and Green Arrows Moving Up and Down Over Grid - Animation Loop. Logistics and Transportation Technology Abstract Background. Animated concept depicting growth and crash mechanics in stock market.
00:08
HD
Graph showing data trends over time with fluctuations and growth
00:08
HD
Business line arrow improvement business strategy arrow rising up business growth arrow and graph chart, abstract business graph chart business decline trend icon animation black ... See More
00:10
HD
Zoom in and out animation the four arrows symbol. Large black symbol in the center and four small symbols around. Seamless looped 4k animation on white background
00:12
HD
Financial overlay appearing triggers percentage values climbing over turbines showing market growth
00:10
HD
Financial Stock Market Data Display - This video displays financial stock market data with fluctuating figures and trends.
00:08
HD
Quality control and company cost reduction. Cost and quality control concept. Successful organization strategy and management.
00:10
HD
Upward Trending Stock Market Graph with Green Growth Arrow and $5,000 Profit Gain, Financial Investment Success and Business Revenue Growth Concept 2D Illustration
00:06
HD
Business graph crash down with red arrow. Motion graphics of down business arrow with transparent background .
00:10
HD
Stock market analysis charts and graphs showing trends in financial data representation visuals
00:05
HD
Stack Coins with Financial Charts Growth Numbers Business Money Market Analysis Display
00:10
HD
Gold bar price fluctuations on digital graph
00:05
HD
Business crisis line chart animation with downward arrow loop on black background...
00:13
HD
Bright white 3D number 2010 text animation floating against a deep black void offering a vibrant and modern visual for the year with a sense of digital energy.
00:10
HD
Alertness Level Gauge Increasing and Decreasing Indicating Focus and Awareness 2D Motion Graphic
00:19
HD
25% Pie Chart Animation on black screen. percentage pie chart animated.  25% business infographic pie chart icon. infographic donut chart, Infographic Video, loading bar, progress bar, 25% pie char.
00:10
HD
Cost reduction and cost saving through digital transformation, business cost and 2026 optimization, operational cost reduction, financial saving, and resource efficiency 4k video animation.
00:06
HD
Pakistan Oil Prices Decline with Oil Barrels, Gold Coins and Downward Green Arrow, 3D Economic and Financial Market Concept
00:11
HD
Cost reduction and cost saving through digital transformation, business cost optimization, operational cost reduction, financial savings, and resource efficiency strategies for business success. Elide
00:14
HD
Financial management concept cost reduction strategies, budgeting, and optimizing financial processes for improved profit and resource allocation
00:17
HD
downward trend chart with tall vertical arrows symbolizing economic loss, financial crisis, market downturn, poor performance, decreasing growth, business decline, unstable conditions.
00:10
HD
Business leaders discuss implement environmental sustainability strategies net zero carbon goals corporate responsibility using ESG reports data at meeting
00:13
HD
Kosovo Country Flag and Bar Chart Graph Showing Decreasing Values a Red Arrow Economic Crisis Concept
00:11
HD
Zoom in and out animation the lotus symbol. Large black symbol in the center and four small symbols around. Seamless looped 4k animation on white background
00:12
HD
Digital Volume Control Slider Animation - System Volume Adjusting
00:10
HD
Exploring percentage symbols in various arrangements and movements
00:08
HD
Data Optimization Workflow: Transforming Business Losses to Financial Growth and Profit
00:07
HD
A microfinance office word sign displayed on a commercial building under a clear blue sky, symbolizing financial inclusion, small loans, and economic empowerment
00:20
HD
Economic Decline Reversal with Upward Arrow
00:05
HD
Red colorful downward trend arrow graph on black background symbolizing representing financial and market loss, market decline, business decrease, economic crisis, and negative growth concept.
00:06
HD
Three word kinetic typography sequence displaying Engage Followers Now with sequential letter spacing reduction and sharp zoom transition
00:12
HD
Close-up of a digital screen displaying a blue linear financial stock market graph with a blurred dark background
00:16
HD
Chart overlay appearing over croissants, bars sliding and value dropping and climbing showing trend
00:11
HD
Abstract 3D number 1934 text animation floating against a deep black void offering a vibrant and modern visual for the year with a sense of digital energy. 4k motion video.
00:10
HD
Arrow continuous line 4K animation video showing downward direction on a minimal background
00:10
HD
Global Stock Market Crash Visualization: Animated World Globe with Real-Time Stock Data, Economic Downturn Analysis
00:08
HD
Declining bar graph with a downward-sloping arrow, representing a decrease or recession in business or financial metrics. Falling Chart with Arrow Animation, Animated Financial Crisis Chart
00:10
HD
Financial display featuring charts, currency, and coins against a dark backdrop
00:08
HD
A futuristic robot arm presents a digital concept of cost reduction with graphs and icons, symbolizing innovation and efficiency in modern business environments. Auvana
00:12
HD
A hand holding a stylus interacts with a tablet displaying a line graph with green and red lines on a dark background
00:07
HD
Business Growth Chart with Icons Representing Services and Communication graph line
00:10
HD
Human hand with Increasing percentage icon. Profit high growth arrow and percent icon, profit increase arrow up symbol, stocks, financial, ranking, mortgage rates, Interest rate and dividend concept.
00:12
HD
Colorful 3D Bar Chart with Rounded Bars on a Purple Base Against Black Background graph statistic
00:05
HD
Zoom in and out animation the pie chart symbol. Large black symbol in the center and four small symbols around. Seamless looped 4k animation on white background
00:12
HD
1 to 100% Percentage Loading Video in White Screen
00:13
HD
Animation of up and down business graph icon. Animated bar graph fluctuating in suitable for showing business stable up down, black background .
00:10
HD
Bitcoin price extreme growth, chart showing fluctuation, value rise and fall. Web interface showing Bitcoin gaining and losing value on market
00:30
HD