Et link til indstilling af din adgangskode er sendt til: For at få adgang til dine køb i fremtiden har du brug for en adgangskode.
Få 3 videoer eller 25 billeder med en gratis prøveversion
Nye filtre tilføjet
Sortér efter

19.625 resultater for increase and decrease i videoer

Bottom view of the city with skyscrapers and green trees,generative ai
00:08
HD
graph chart up down business statistics report
00:12
HD
Bar chart graphic showing downward trend with arrow indicating decline during data analysis on dark background
00:05
HD
Palms hold orange raspberry, decreasing gradually. It represents offering, generosity, decrease, nutrition, harvest, abundance, natural product, and summer fruit
00:07
HD
Animation of Fuel level on a circular gauge moving from low to high and back. Can be used to show increase or decrease. Perfect for energy, transport, or industrial content.
00:26
HD
A dynamic business meeting showcasing a team analyzing quality and cost metrics through engaging visual graphics in a contemporary office setting. Raster
00:20
HD
Two curved arrows pointing in opposite directions minimal animation
00:06
HD
Animation down business graph icon. .business or finance loss concept icon diagrams showing a steady increase in profits, growing charts. Business digital
00:10
HD
Abstract Area Chart with Data Points Representing Business Growth and Financial Trends.
00:11
HD
Percentage Symbol with Rising Arrow Icon Animation – Dynamic 4K Stock Video
00:07
HD
Financial Report Presentation Animation with Business Growth Visualization
00:10
HD
marching across the mountains while camping,
00:05
HD
Budget Deficit green graph going down 4k animation with glowing line and typography on the top
00:10
HD
Business graph chart with growing business concept. cyan colors Abstract decreasing business graph chart animation business chart, icon, decreasing graph, motion graphic animation..
00:10
HD
Red colorful downward trend arrow graph on black background symbolizing representing financial and market loss, market decline, business decrease, economic crisis, and negative growth concept.
00:06
HD
Monochrome global financial chart with magnifying glass animation, Financial chart with bar graphs, line trend magnifying glass overlay
00:10
HD
Animation of up and down business graph icon. business or finance loss concept icon diagrams showing a steady increase in profits. future target suitable for business development direction
00:06
HD
Business data presentation graphs
00:10
HD
Money loss. Cash with down arrow stocks graph, concept of financial crisis, market fall. animated of cost symbol dollar increase dollar sign with arrow down
00:10
HD
Down business graph icon .business or finance concept icon. Abstract decreasing business graph chart animation background.
00:10
HD
Ultraviolet Level Text or Word Low and Medium to High Meter Concept Animation on Black Background and Blue Screen
00:58
HD
Vibrant blue digital charts reveal dynamic market trends and crypto trades
00:16
HD
Expansive forest under a sea of clouds highlights nature's ability to capture and store carbon, emphasizing environmental balance. Carbon reduction
00:06
HD
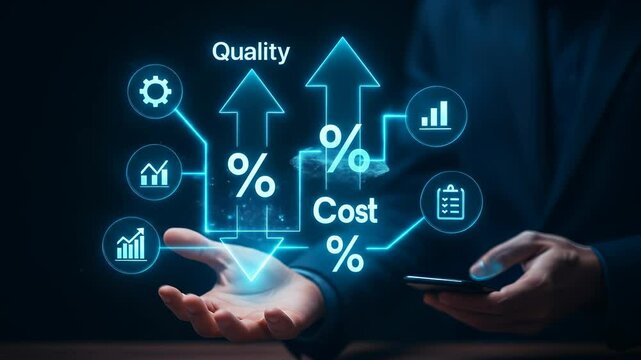
Quality cost percentage business growth and finance technology with digital data analysis concept showing improvement efficiency and financial growth using glowing blue icons and arrows for modern
00:08
HD
Wooden pie chart segments changing, increasing and decreasing in height, illustrating growth and decay, placed on a wooden surface with visible shadows
00:08
HD
Cost reduction and cost saving through digital transformation, business cost optimization, operational cost reduction, financial savings, and resource efficiency strategies for business success. Muxer
00:12
HD
Wooden blocks arranged in a descending order on a table against a teal background, symbolizing decline
00:10
HD
Bitcoin rotates in slow motion against the background of a stock chart suggesting the strategy, increases and decreases in the cryptocurrency priceand. Copy space for text.
00:17
HD
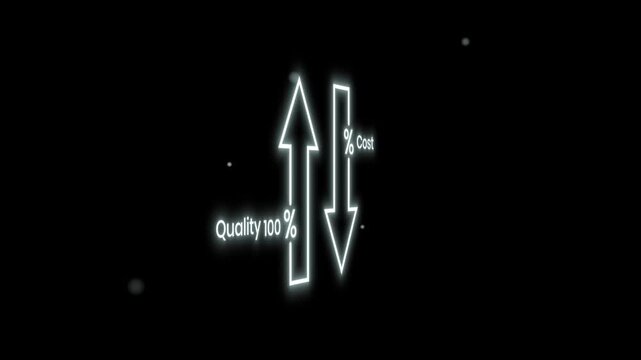
Neon 3d Arrow Animation Displaying Quality One Hundred Percent Increase And Cost Decrease With Floating Particles Transparent Alpha Channel For Business Infographics Loop Motion Graphics
00:12
HD
Zoom in and out animation the enchantress symbol. Large black symbol in the center and four small symbols around. Seamless looped 4k animation on white background
00:12
HD
arrow down business graph icon animation. business chart concept. A neon down business graph icon displays a glowing, downward-sloping line or bar chart, symbolizing decline, loss
00:10
HD
Abstract glowing neon swipe arrow. 4k animation. Down to up neon line arrow direction animation. Neon line raising business arrow on black background.Abstract arrow business graph icon animation.
00:05
HD
growing up.business graph chart icon animation background.
00:10
HD
A dynamic pink chart fluctuates against a vibrant teal backdrop, symbolizing market volatility.
00:10
HD
Financial data and bar chart analysis animation over grid background
00:12
HD
graph chart up down business statistics
00:10
HD
Daily, marketing graph showing marketing sales profit increasing and decreasing  to future target business concept.
00:15
HD
A business graph up to a down blue arrow with an animated red bar. Animation of a blue bar chart graph on a white background with a grid. Video footage
00:08
HD
Orange financial graph with arrow showing initial minor and then continuous significant fall. Declining trend line concept. Data visualization of decrease.
00:08
HD
Down business graph icon .business or finance concept icon. Abstract decreasing business graph chart animation background.
00:10
HD
Curved red arrows pointing downward.
00:09
HD
Animation down business graph icon. .business or finance loss concept icon diagrams showing a steady increase in profits, growing charts. Business digital
00:10
HD
Green and Blue Bar Chart Showing Statistical Analysis and Growth Trends in Various Percentages. Concept of Data Visualization, Business Analytics, and Financial Performance Metrics.
00:10
HD
A prominent dollar sign symbol representing currency exchange rates is overlaid on a detailed financial chart illustrating stock market trends global economic growth and investment analysis.
00:05
HD
Windy day blowing currency notes off a money tree
00:04
HD
Digital illustration showcasing the balance between quality and cost in artificial intelligence with a futuristic representation of data analysis metrics Sigmoid
00:10
HD
Abstract glowing neon swipe arrow. 4k animation. Down to up neon line arrow direction animation. Neon line raising business arrow on black background for growth visuals
00:10
HD
Abstract decreasing business graph chart animation background. Bad Economy Recession Graph Chart Chalkboard Style.
00:08
HD
Bar Graph Growth Chart Line Art Vector Icon Featuring Cross Cancel Mark Badge for Financial Business Analytics Failure Data Decline Market Drop Corporate Loss Report and Economic Trend Concept
00:05
HD
Zoom in and out animation the zodiac ophiuchus symbol. Large black symbol in the center and four small symbols around. Seamless looped 4k animation on white background
00:12
HD
Neon style rotating bar graph animation on black background representing data analysis and market trends
00:08
HD
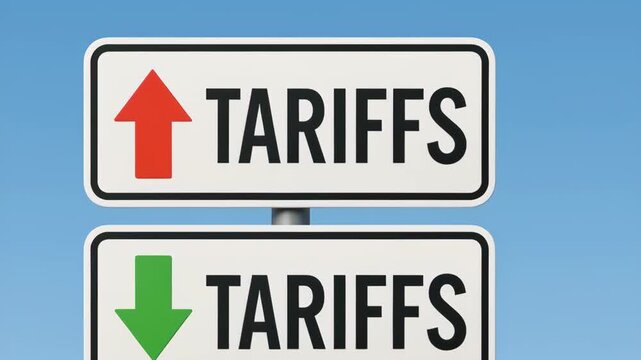
Tax impact trade. Tariff signs with red upward arrow and green downward arrow white road signs against clear blue sky showing economic increase

00:05
HD
Business financial charts animated graphs stock market growth data technology motion graphics. Animated financial data graphs business analytics stock market investment technology loop.
00:12
HD
Business grow-ting arrow. Rising bar follow the arrow. Abstract neon arrow growth , success concept. Profit growing icon animation.
00:10
HD
Animated down graph icon designed in flat icon style, business or finance concept icon.Business loss concept on black background.
00:10
HD
Bar Chart and Line Graph Showing Financial Data Trends on transparent Background
00:22
HD
Daily, marketing graph showing marketing sales profit increasing and decreasing  to future target business concept.
00:15
HD
Glowing blue business bar chart with downward arrow and declining line curve. Symbolizing revenue drop, financial loss, negative growth, market downturn 4K
00:07
HD
White Percentage Symbol on Red Gradient Background
00:08
HD
Bottom view of the city with skyscrapers and green trees,generative ai
00:06
HD
Businessman and growing graph investment. Finance save. Success, growth wealth stock market. Business in the digital age. Trading chart in financial concepts. Prosperity. Cryptocurrency. Technology
00:05
HD
Reuse level indicator scale. Low Normal High meter infographic animation on white background. Showing high reuse level color gauge indicator for sustainability and eco-friendly practices.
00:10
HD
Glowing digital stock market chart with candlestick data, lines, and a dark, blurred background
00:04
HD
Quality control and company cost reduction. Cost and quality control concept. Successful organization strategy and management. Percentage icon of quality with up arrow and cost with down arrow.
00:15
HD
a grayscale pattern consisting of symmetrical pixels that increase in size as they approach the viewer and decrease in size as they move away from the viewer.
00:22
HD
Futuristic Artificial Intelligence Concept Depicting Quality and Cost Metrics with Global City Lights Background and Data Visualization Elements Sigmoid
00:10
HD
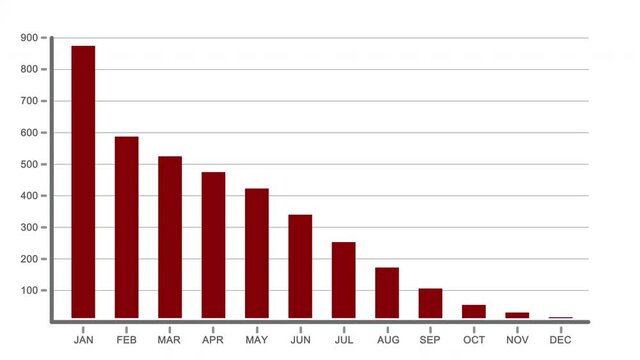
A red graph with a downward trend. The graph is a visual representation of a decrease in a particular value or measurement. The red color of the graph adds emphasis to the downward trend
00:07
HD
A corporate report highlighting ESG (Environmental, Social, Governance) metrics within the green energy sector, showcasing sustainable business practices in the renewable energy industry
00:15
HD
Teal candlestick bars sliding in, trend line tracing, gauges filling, visualizing market data
00:15
HD
Zoom in and out animation the moon symbol. Large black symbol in the center and four small symbols around. Seamless looped 4k animation on white background
00:12
HD
Declining financial trend with green background and arrows
00:11
HD
Business Performance Comparison Animation - Rising and Falling Bar Charts with Trend Lines
00:06
HD
Financial Chart: An abstract depiction of financial market trends, symbolized by stylized green and red candlesticks against a solid blue backdrop.
00:10
HD
Business Growth and Decline Concepts with People Silhouettes and Graphical Representation
00:05
HD
Animated line drawing of a pie chart with a percentage sign
00:06
HD
Stock index chart moves up and down, market data, trading, financial figures. Business, investment, risk, chance, graph, making money.
00:12
HD
an abstract looped animated background of increasing and decreasing 3D tiles. 3d render
00:09
HD
business graph neon icon. 4k video
00:10
HD
Neon glowing medical thermometer icon animation. That's indicates weather temperature 100 degree increase or decline. Thermometer equipment showing hot or cold weather.
00:10
HD
marching across the mountains while camping,
00:05
HD
Decrease sugar intake to increase your health, low sugar diet benefits 4k animation, arrow indicators
00:07
HD
Focus level indicator scale. Low normal high meter infographic animation on white background. Showing high focus level color gauge indicator for mental performance and productivity monitoring.
00:10
HD
Businessmen with a businesswoman in front forming arrow shape pointing right, hd Alpha Channel
00:30
HD
Quality control and company cost reduction. Cost and quality control concept. Successful organization strategy and management.
00:10
HD
Green Arrow Moves Downward Next to Sprout in Soil Field
00:08
HD
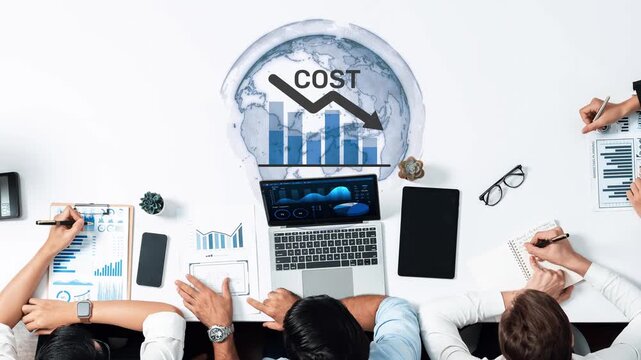
A business team collaborates on global economic analysis, focusing on cost reduction strategies. Laptops, notebooks, and graphs illustrate their data-driven approach. Raster
00:12
HD
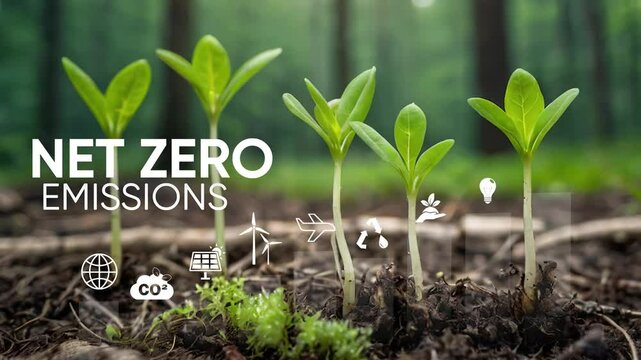
Circular economy concept for future business growth and environmental sustainability and reduce pollution.Net zero and carbon neutral concept.Concept day earth Save the world save environment.
00:12
HD
A corporate report highlighting ESG (Environmental, Social, Governance) metrics within the green energy sector, showcasing sustainable business practices in the renewable energy industry
00:15
HD
Smart home systems. Turning the lights on and off.
It turns on the lights of the house, increases or decreases the brightness with the intelligent system control from the Adam Controller.
00:11
HD
Financial data on a screen, showing fluctuating graphs
00:10
HD
Profit high growth percent icon, stocks, financial, Interest rate and dividend concept, Futuristic raise arrow chart digital transformation abstract technology background
00:10
HD
Animation footage of Graph showing fluctuated downward trend, downward bar graph and arrow chart
00:10
HD
Cost optimization concept, Decline in product service, quality and efficiency, Businessman touching virtual downward arrow, business video
00:05
HD
Racing Aero Transparent Channel. Arrow Racing Clear Channel, Business Growth Arrows And Graph Charts, Business Line Arrow Sales Profit Increasing To Futures. on black background
00:10
HD
Financial Analysis: A dynamic graph displaying economic trends and performance metrics, highlighting key data points with vibrant color and a modern aesthetic.
00:08
HD
Neon Percentage Sign Glowing Brightly.
00:07
HD
Zoom button. Arrows, zoom in, make full screen, hide, close, exit full screen, decrease. Window work concept. One line drawing animation. Motion design. Animated technology logo. Video 4K
00:10
HD
Glow zigzag simple line Stock market growth and loss, graph chart with arrows moving down, falling diagram, motion graphic on a red classic abstract Grid background
00:08
HD
decrease currency price graph and chart digital background animation. world downtrend currency price animation with red color
00:10
HD
Animated financial market analysis with fluctuating crypto trade values, showcasing rising and falling graphs, dynamic bar diagrams, and a vibrant red ticker line.
00:14
HD