Et link til indstilling af din adgangskode er sendt til: For at få adgang til dine køb i fremtiden har du brug for en adgangskode.
Få 3 videoer eller 25 billeder med en gratis prøveversion
Nye filtre tilføjet
Sortér efter

19.470 resultater for increase and decrease i videoer

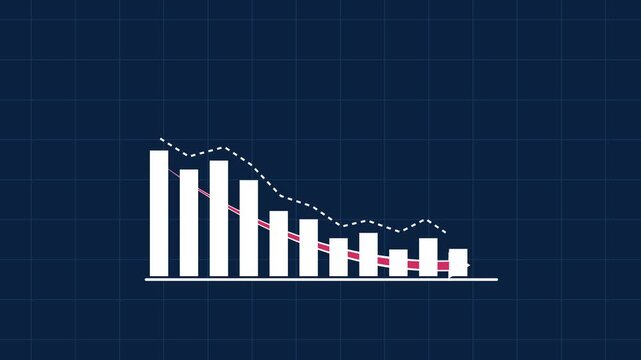
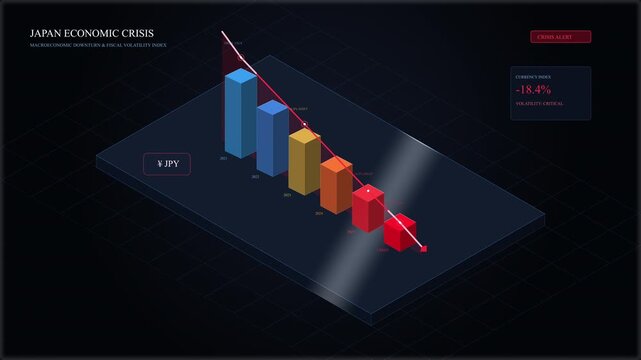
Animated financial bar chart showing a sharp economic downturn with a declining red trend arrow on a dark blue grid background, representing market recession, business loss, and negative growth
00:10
HD
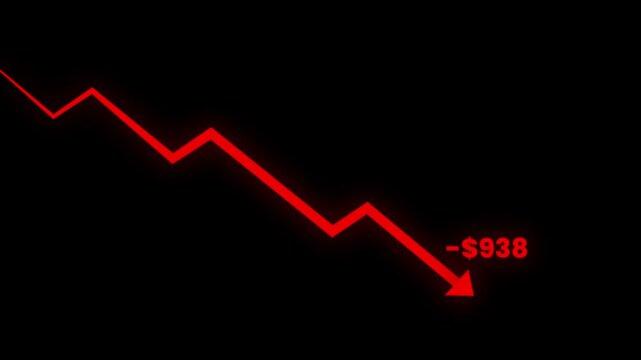
Red Downward Stock Market Chart with -$1,000 Loss on Black Background, Falling Financial Graph and Negative Business Trend Concept for Investment, Finance and Trading
00:06
HD
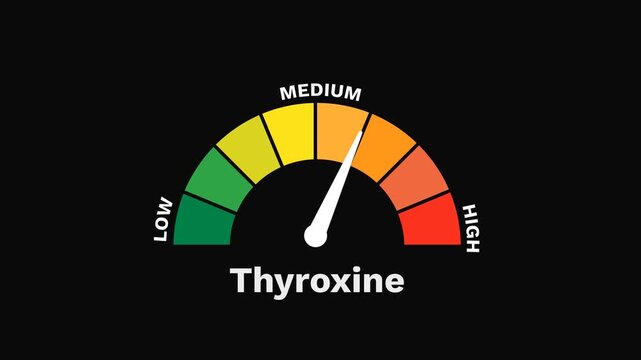
Thyroxine Level Gauge Increasing and Decreasing Indicating Metabolic Activity Animation
00:19
HD
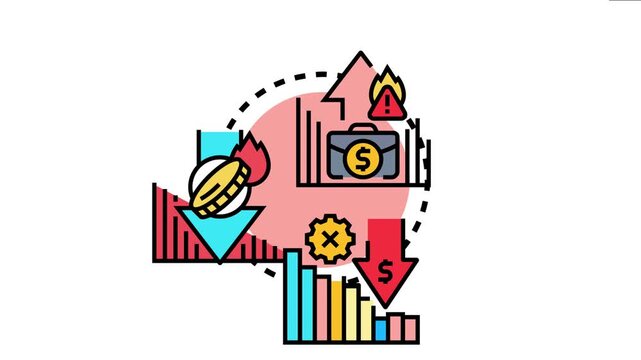
Business process having financial risks, showing an operational challenge impacting profit, and the potential for a monetary decrease due to internal or external factors
00:17
HD
Blue financial line graph animation representing business data fluctuation on white background
00:05
HD
Red declining bar chart animation showing financial loss or market downturn decline graph business
00:05
HD
Front view of moving digital Business Growth Financial Trading Chart and Stock Market Data Animation looping Seamless Background. Business data concept
00:27
HD
Hands join together with gears symbolizing a united approach toward achieving carbon neutrality from 2026 to 2050, highlighting the urgency for collaboration in sustainability. Raster
00:15
HD
Business growth concept in graph chart showing marketing sales profit increasing to future target . growing business concept.
00:10
HD
Bar chart glowing in blue neon light indicates a downward trend icon signifying a reduction in growth or revenue metrics for analytical corporate data visualization on a dark professional interface.

00:10
HD
Business growth concept in graph chart showing marketing sales profit increasing to future target . growing business concept. Clean Hi-tech style technology chart
00:10
HD
Business graph chart arrow line down red color animation on white background. growth concept red moving.
00:15
HD
Advanced digital infographic display featuring cost reduction strategy with animated business financial growth charts, security locks, and efficiency gears in a modern corporate technology interface
00:17
HD
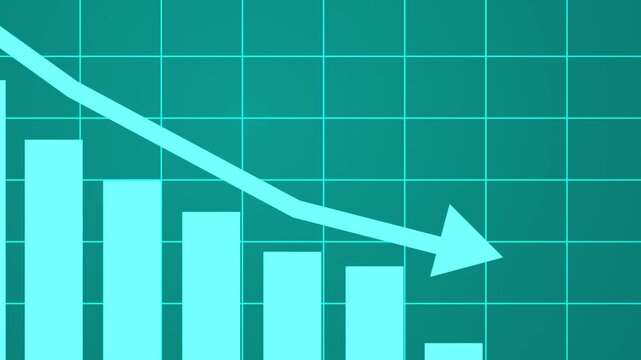
Business graph crash down with cyan arrow. Motion graphics of down business arrow with transparent background .
00:10
HD
White dollar sign graph showing a downward trend. money financial loss and economic downturn shown.
00:10
HD
Abstract decrease icon on black background. Dollar rate down looped icon. Reduce costs sign and symbol. Motion graphics of concept. animation
00:06
HD
Up and down arrow icon set, glowing neon upload download symbol on black background
00:10
HD
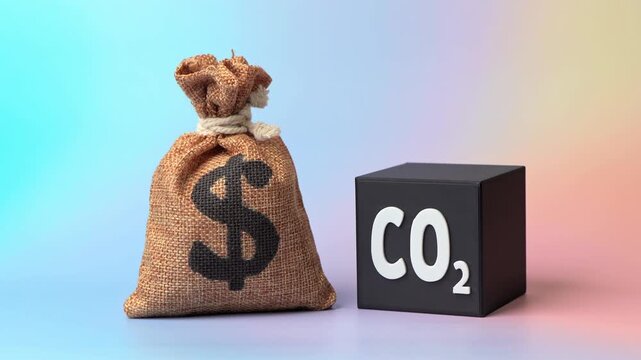
A CO2 cube and a dollar money bag. Recycling grants. Reducing environmental impact while generating income. Increase in the cost of emission quotas for enterprises. Waste recycling
00:14
HD
Minimalist Flat Vector Animation of Real Estate Market House Values Fluctuation and Growth Metrics
00:10
HD
graph chart up down business statistics report
00:10
HD
Multiple white arrows pointing downwards on a green background.
00:05
HD
Financial Report Presentation Animation with Business Growth Visualization
00:10
HD
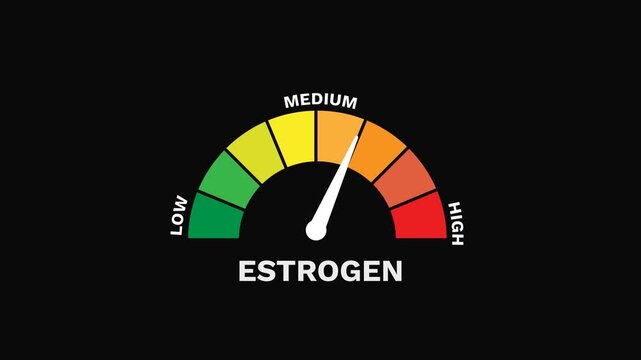
Estrogen Level Gauge Increasing and Decreasing Indicating Hormonal Balance Animation
00:19
HD
Monetary policy impacting financial markets and savings, with interest rate changes influencing investment opportunities, inflation, and economic growth
00:17
HD
Business Bar Chart Growth Report Data Visualization On White Background
00:10
HD
Sales funnel infographic showing lead conversion and cost reduction
00:06
HD
Digital Business Stock Market Data and Growth Financial Trading Chart  Animation looping Seamless Motion Background. Business stock data concept
00:19
HD
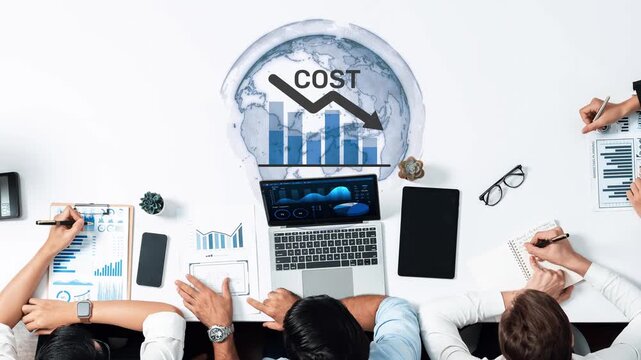
A business team collaborates on global economic analysis, focusing on cost reduction strategies. Laptops, notebooks, and graphs illustrate their data-driven approach. Raster
00:12
HD
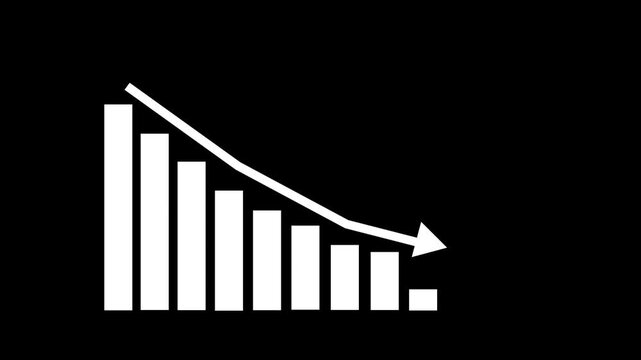
Bar chart graphic showing downward trend with arrow indicating decline during data analysis on dark background
00:05
HD
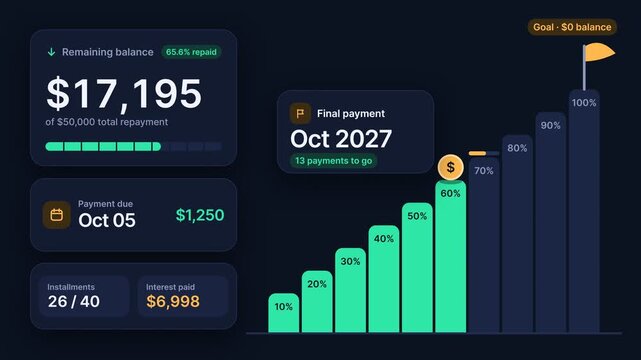
Animated Financial Dashboard Tracking Loan Repayment Progress and Debt Reduction on Dark Background
00:10
HD
Close-up of a hand stacking wooden blocks to show Cost text with a decreasing red arrow and Quality text with a rising blue arrow, representing business budget optimization and value improvement.
00:05
HD
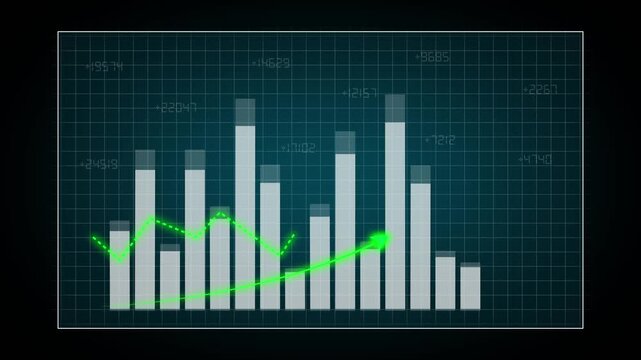
Animated Financial Bar Chart Displaying Data Growth
00:10
HD
Glowing neon green animated line graph illustrating a downward market trend on black background. 4K Video motion graphic animation
00:10
HD
Pixelated bar chart shows downward trend, illustrating financial loss, recession, data analytics, market crash
00:06
HD
White Changing Money Values Animation on Black Background
00:05
HD
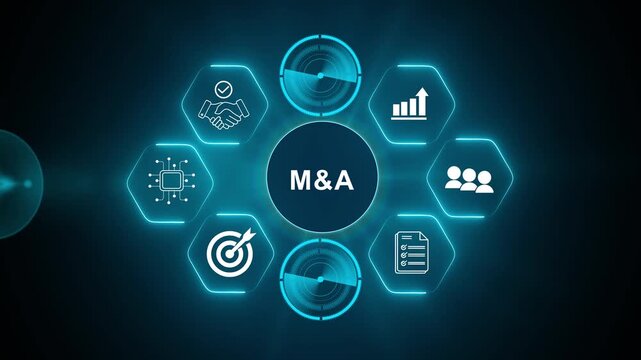
Business mergers and acquisitions concept. Share acquisition, asset business acquisition, amalgamation. Business review and development model. The abbreviation M and A on smart background, copy space.
00:10
HD
Taking weight measurement on a scale at home
00:16
HD
Neon Pink 3D Line Graph with Data Points and Numbers on a Dark Grid animation Background chart statistics. Modern dark grid background showing neon pink 3D line graph with illuminated data points.
00:12
HD
Energy discount icon animated with flash and percentage symbol motion graphic.
00:05
HD
Green Bar Chart Animation Stock Market Data Growth Visualization
00:05
HD
Animated fire icon with percentage progress bar on dark background.
00:07
HD
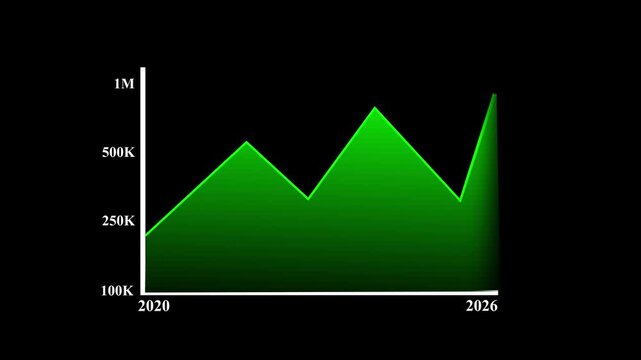
Green chart rises and falls over a four year period
00:08
HD
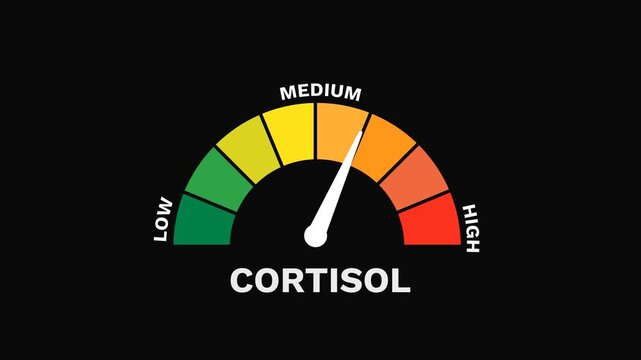
Cortisol Level Gauge Increasing and Decreasing Indicating Stress Response Animation
00:19
HD
Graph displaying white bar chart with downward arrow on green background. Suitable for finance, business, stock market concepts. Bright and impactful.
00:07
HD
Money reduction icon animation. circle with down arrow moving animation. 4k video
00:08
HD
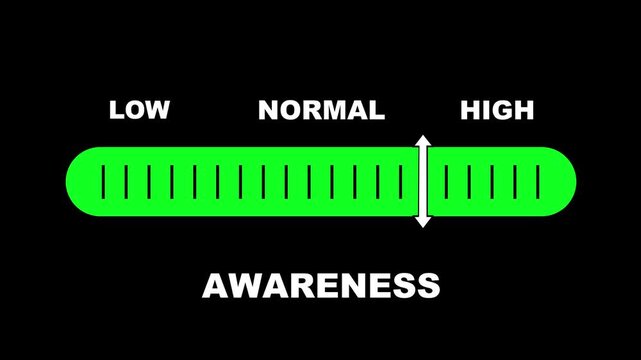
Awareness level indicator scale. Low normal & high meter infographic animation on black background. Showing high awareness level color gauge indicator for knowledge, safety, and health monitoring.
00:10
HD
Bar chart and line graph icon showing financial data trend analysis and business performance animation
00:10
HD
A diverse group of hands joining together over a graph symbolizing cost reduction, representing teamwork in financial planning and strategic business analysis for growth. Raster
00:15
HD
Download free with trialBusiness efficiency concept on black background. how much a company or organization can produce as it relates to time, cost and quality.
00:15
HD
Animated intensity meter gauge with fluctuating levels and color zones showing performance metrics dashboard
00:16
HD
Dollar Sign For Financial Loss And Falling Revenue Wiggle Doodle Animation With Alpha Channel. Currency Symbol And Market Decline, Transparent Background. 4K Loop Hand Drawn Icon.
00:06
HD
Gray business graph chart growth up down or signal on transparent background with alpha channel. Business up and down signal concept animation in 4k.
00:10
HD
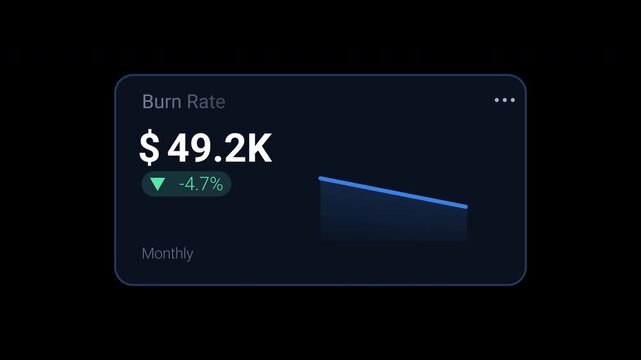
burn rate KPI dashboard card displaying monthly spending, decrease percentage and downward trend graph. Animated motion graphics component for startup finance, cash flow management, budgeting
00:10
HD
Abstract decrease icon on White background. Dollar rate down looped icon. Reduce costs sign and symbol. Motion graphic 4k animation video.
00:06
HD
Business growth graph showing exponential progress and profit growth. Growth of statistical bars and columns, upward arrow. Finance, upward bar graph, profit concept, positive growth chart animation.
00:10
HD
Green arrow pointing down over a dollar sign icon on a black background
00:10
HD
Abstract geometric progression of circles in shades of gray.
00:05
HD
White arrow pointing down on black background indicates direction choice movement downward trend or decrease motion
00:10
HD
Cost reduction strategy concept with digital hud interface and global business network business strategy
00:10
HD
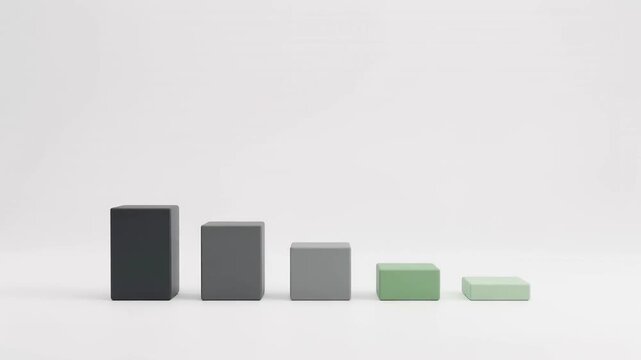
A 3D bar chart showing carbon footprint reduction transitioning from dark high emission bars to green eco friendly levels, illustrating corporate sustainability goals and environmental progress.
00:08
HD
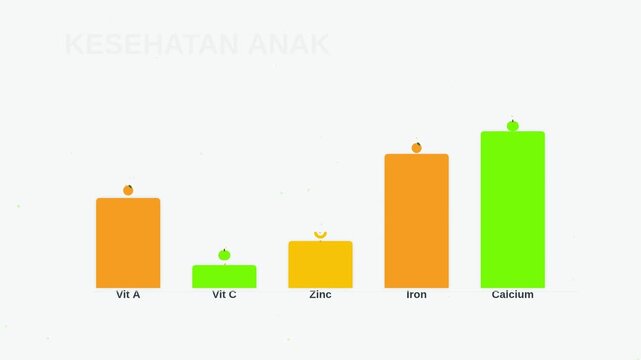
Child Health Data Bar Chart Animation Growth Trends and Statistics
00:10
HD
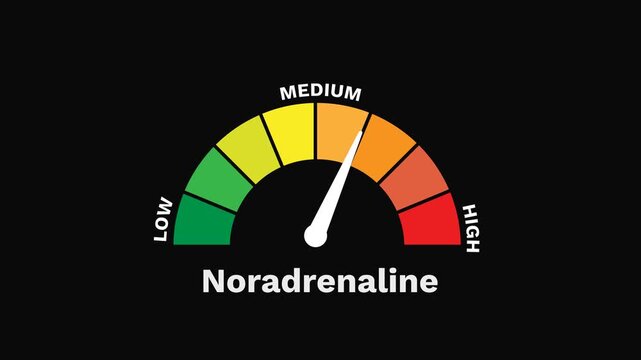
Noradrenaline Level Gauge Increasing and Decreasing, Alertness and Stress Response Animation
00:19
HD
Business graph  growing  concept. Abstract decreasing business graph chart animation. down business graph icon. animation arrow on black background.
00:10
HD
Digital bar chart lines compare market volatility trends using dual arrows. Financial analysis software modules look crisp across this grid monitor bar chart framework. Data charts update.
00:10
HD
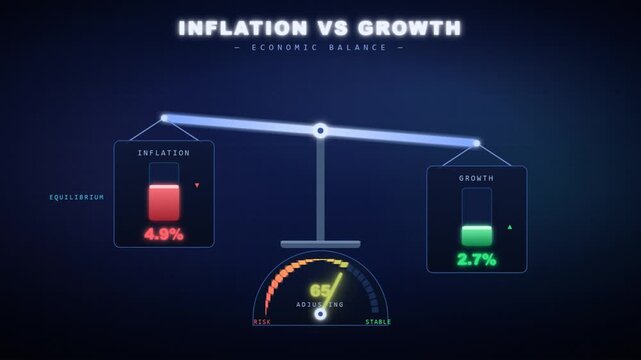
Economic balance scale animation weighing high inflation risk against low GDP growth
00:12
HD
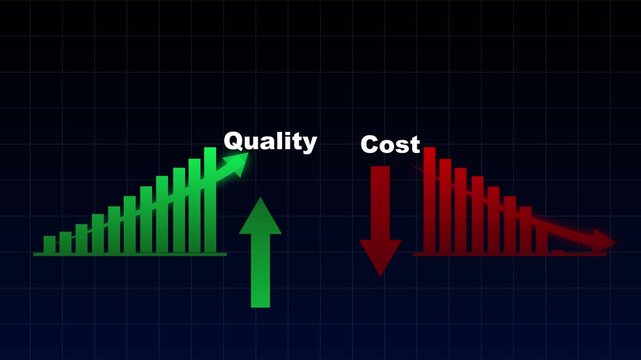
Business Performance Graph Showing Increasing Quality and Decreasing Costs, Representing Process Improvement, Operational Efficiency, Cost Optimization, Productivity, and Strategic Growth
00:10
HD
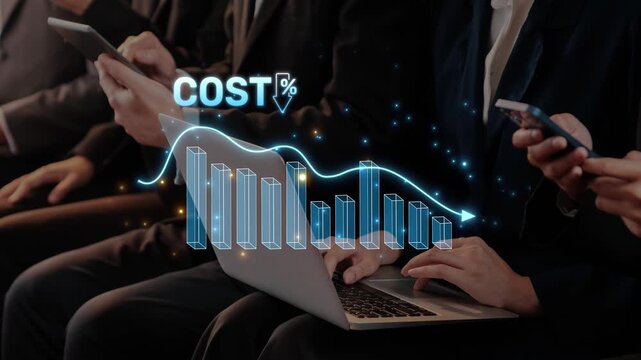
Business professionals engaged with devices showcase a digital cost trend, highlighting essential financial insights in a modern workplace atmosphere. Raster
00:15
HD
Financial Report Presentation Animation with Business Growth Visualization
00:10
HD
Simple arrow icon representing direction, navigation, movement, and progress.
00:10
HD
Animated Speaker Icon Showing Volume Levels Increasing and Decreasing.
00:05
HD
Currency exchange icon with two dollar coins and red green arrows in purple outline for money transfer forex finance trading and banking concepts
00:10
HD
Zoom in and out animation the cloud sync symbol. Large black symbol in the center and four small symbols around. Seamless looped 4k animation on white background
00:12
HD
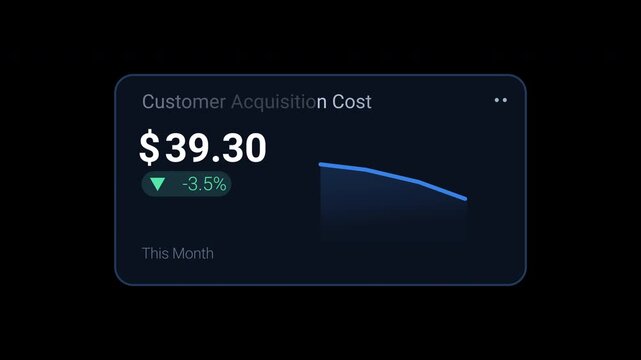
Blue fintech customer acquisition cost KPI dashboard card with currency value, decrease percentage and trend graph. Animated motion graphics component for marketing reports, startup analytics,
00:10
HD
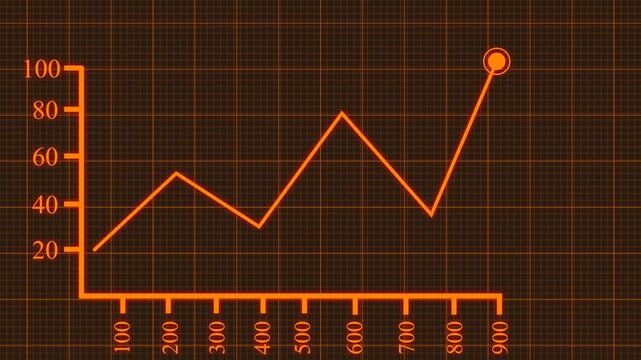
Animated of down business graph icon .business or finance concept icon ,Animated illustration of a downward statistical curve with a loss sign business graph...
00:10
HD
Business graph chart arrow line down blue color animation on white background. growth concept blue moving.
00:15
HD
People interacting with a global ecosystem, decreasing resource depletion while increasing recycling efforts for protecting animals and nature
00:17
HD
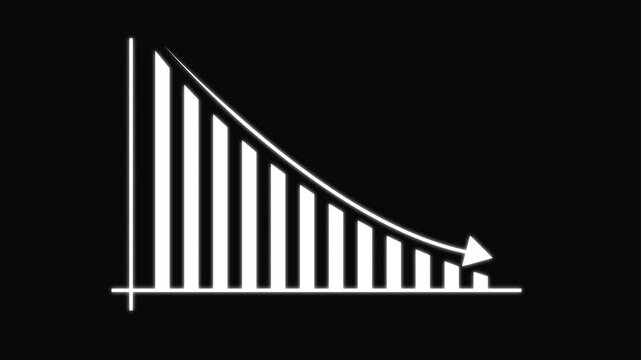
Bar Chart Decline Animation
00:06
HD
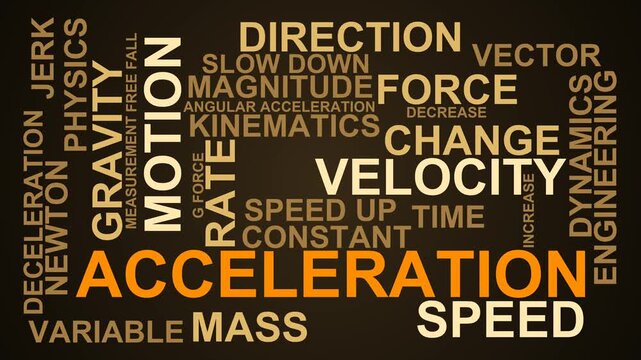
Acceleration Word Cloud
00:11
HD
Downward Arrow Animation Loop for Business Decline, Financial Loss, Decreasing Profits, Negative Growth, Falling Trend, Market Drop and Corporate Motion Graphic..
00:10
HD
Carbon Footprint Reduction and Net Zero Emissions Target Infographic Animation
00:15
HD
Financial growth and decline animation with green up arrow red down arrow and spinning gold dollar coin on green background
00:15
HD
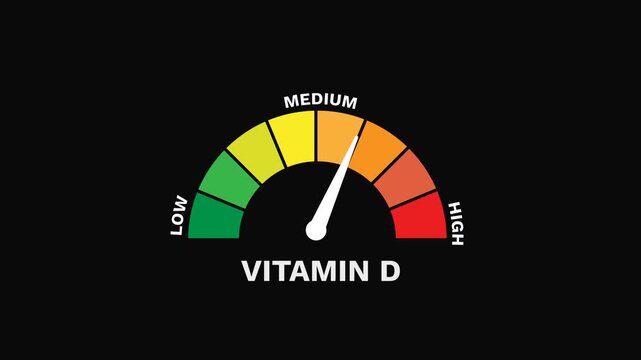
Vitamin D Level Gauge Increasing and Decreasing Indicating Nutritional Health Animation
00:19
HD
Brightness slider with sun icon rising from 0 to 100 percent and back on black, screen brightness control UI animation
00:16
HD
Minimalist Animated Graph Showing Business Growth and Decline
00:08
HD
Harnessing carbon pricing to drive emission cuts and invest in low carbon technologies
00:05
HD
4 electricity costs themed animations. Lightbulb appearing. Increasing and decreasing electricity costs in dollar. White background and blue green background.
00:19
HD
A business professional analyzes cost and quality metrics illustrated with glowing arrows, representing dynamic strategies for enhancing business growth and improving decision-making. Qubit
00:12
HD
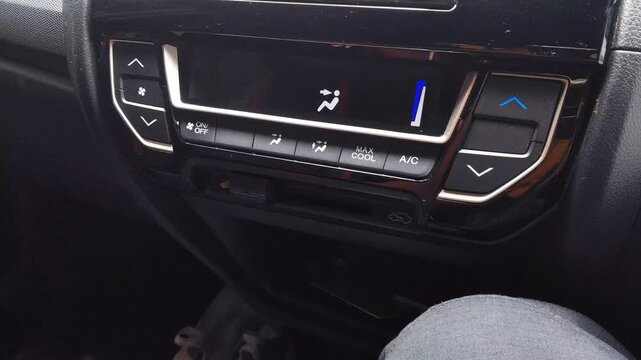
Asian man hand turns car AC off to on, increases fan speed, decreases temperature, then increases temperature for driving comfort in tropical weather
00:23
HD
Dynamic rises and falls in cryptocurrency market — animated charts and motion diagrams depicting trading trends, finance, bank profit and loss fluctuations. 4K,,...,
00:10
HD
Abstract 3D Bar Graph with Glowing Blue and Teal Bars on a Dark Grid Floor chart data
00:05
HD
Business efficiency concept, how much a company or organization can produce as it relates to time, cost and quality. Glowing neon line of profit maximization icon isolated on transparent background.
00:15
HD
Zoom in and out animation the four arrows symbol. Large black symbol in the center and four small symbols around. Seamless looped 4k animation on white background
00:12
HD
Office chalkboard displaying handwritten cost reduction strategy, growth charts, sticky notes in handheld shot. Footage suits corporate finance, business analytics, startup management presentations
00:11
HD
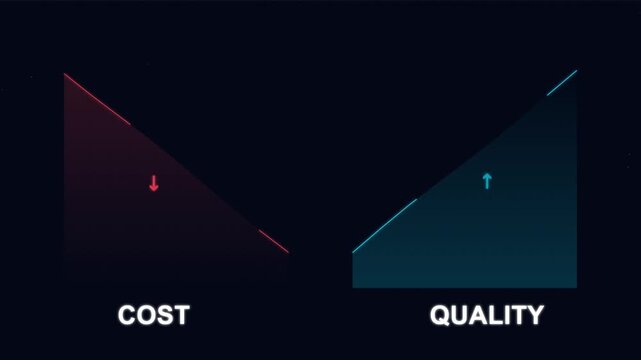
Business Concept Graph Showing Decreasing Cost and Increasing Quality
00:10
HD
Graph rising up of blue stock candle. Business financial grow.
00:06
HD
Oil wave text on liquid price increase 3D text, beautiful bright word 3D animation
00:05
HD

A grand stock market chart background with blue and red glowing candlestick graph lines for a financial business concept,
00:10
HD
Concept visualizing low resource usage, decreasing consumption, increasing efficiency, balancing environmental impact, and avoiding waste for sustainable development
00:17
HD
Downward Arrow Animation Loop for Business Decline, Financial Loss, Decreasing Profits, Negative Growth, Falling Trend, Market Drop and Corporate Motion Graphic..
00:10
HD