Et link til indstilling af din adgangskode er sendt til: For at få adgang til dine køb i fremtiden har du brug for en adgangskode.
Få 3 videoer eller 25 billeder med en gratis prøveversion
Nye filtre tilføjet
Sortér efter

19.536 resultater for increase and decrease i videoer

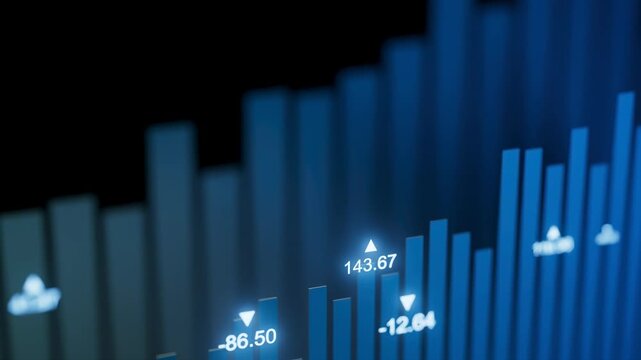
Analysis of Financial Data Display Showcasing Market Fluctuations Represented by Digitally Rendered Numbers on a Screen with Distorted Visual Elements
00:30
HD
Stock Market Chart Animation Showing Buy The Dip Opportunity
00:10
HD
Libido Level Gauge Increasing and Decreasing Indicating Desire and Hormonal Response Animation
00:19
HD
Vibrant neon glowing arrow animation transition effect dynamic digital motion futuristic u i symbol
00:10
HD
Cost reduction and cost saving through digital transformation, business cost optimization, operational cost reduction, financial savings, and resource efficiency strategy for business success. Funnel
00:11
HD
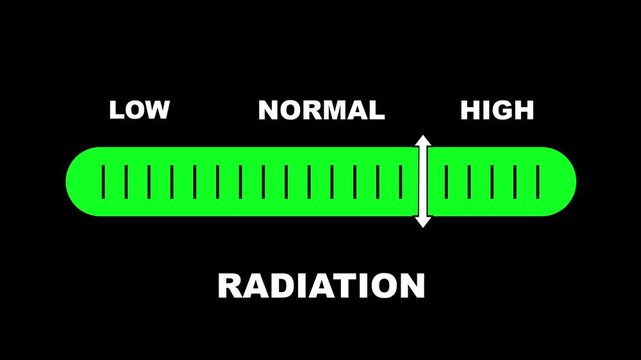
Radiation level indicator scale. Low normal & high meter infographic animation on black background. Showing high radiation level color gauge indicator for environmental and safety monitoring.
00:10
HD
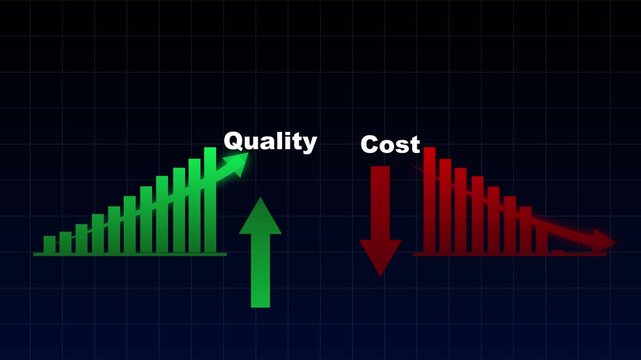
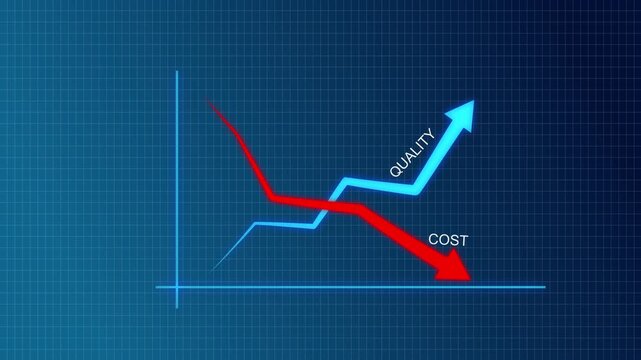
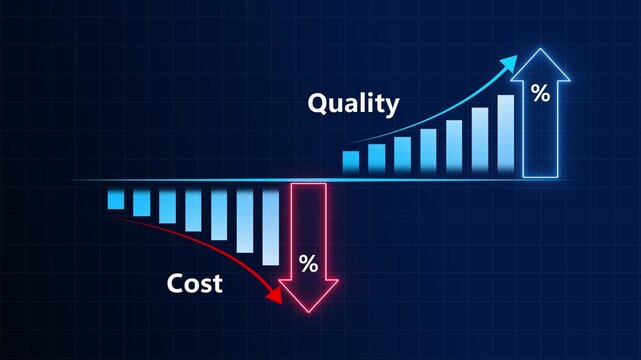
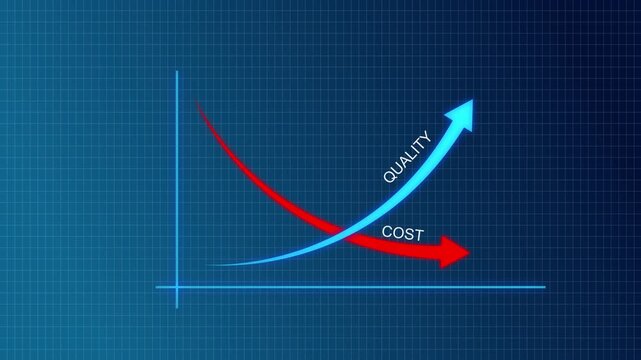
Business Performance Graph Showing Increasing Quality and Decreasing Costs, Representing Process Improvement, Operational Efficiency, Cost Optimization, Productivity, and Strategic Growth
00:10
HD
Business growth concept in graph chart showing marketing sales profit increasing to future target . growing business concept. Clean Hi-tech style technology
00:10
HD
Bad Economy concept. Abstract decreasing business graph chart animation background. Global business line animation. Abstract glowing neon line business graph growth arrow to down arrow.
00:09
HD
A Insurance concept button on a futuristic .Business, Technology and network concept. successful business concept on black background with alpha channel. 4k video animation
00:12
HD
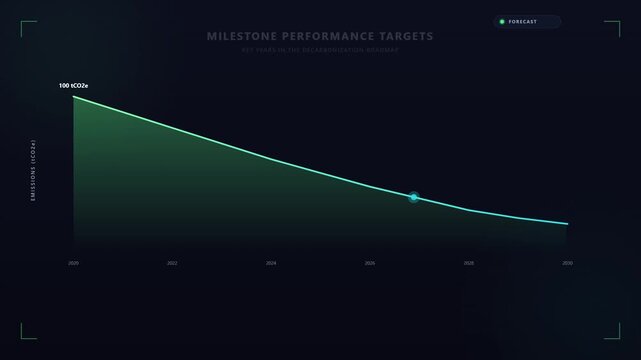
Futuristic Data Analytics Milestone Performance Target Graph
00:15
HD
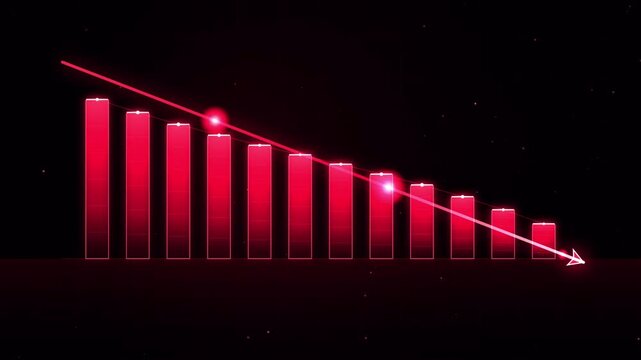
Red bar chart showing a downward trend with a glowing arrow on a dark background
00:12
HD
Corporate Sustainability and ESG Performance Dashboard Metrics
00:10
HD
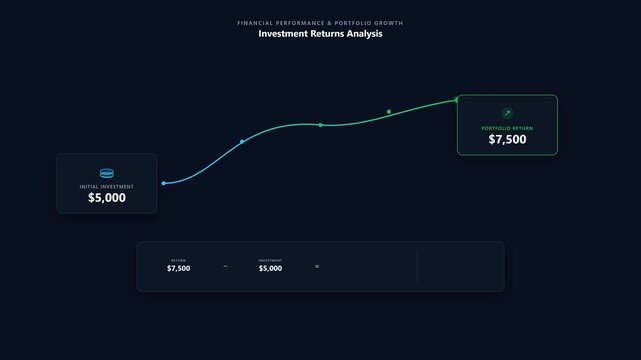
Financial Performance Analysis of Investment Returns with Growth Visualization
00:10
HD
Animation footage of a graph showing a downward trend, a downward bar graph, and an arrow chart
00:11
HD
Business growth concept in graph chart showing marketing sales profit increasing to future target . growing business concept. Clean Hi-tech style technology chart, 4k up graph animation video, quality
00:10
HD
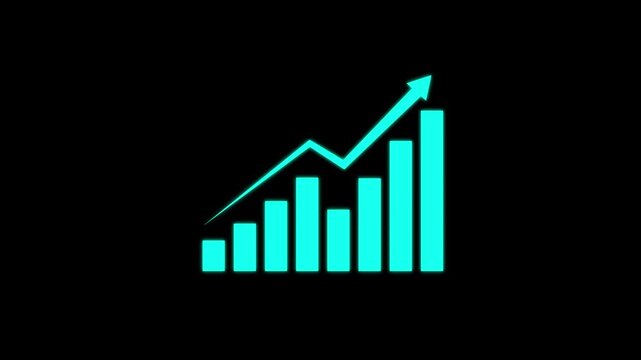
Business growth concept in graph chart animation on black background. Statistics bars columns growth, positive increase chart. Increase graph icon suitable for business and finance concepts
00:08
HD
Minimalist business chart animation with downward trending  arrow and percentages 4k animation showing financial loss over with background dynamic...
00:10
HD
Neon Percentage Symbol with Glowing Blue and Pink Light on Black Background for Finance, Discount, Business and Digital Marketing Concept.
00:10
HD
Business growth concept in graph chart showing marketing sales profit increasing to future target . growing business concept. Clean Hi-tech style technology chart
00:10
HD
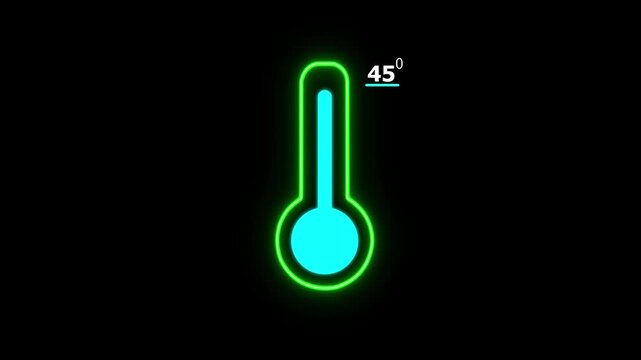
Neon Celsius thermometer displayed temperature 45 degree. Digital Temperature Meter Display 45°C. That's indicates weather temperature 45 degree increase or decline.4k video.
00:10
HD
glowing green neon arrow pointing down, indicating decrease or negative trend on a dark background, perfect for business and finance data visualization and modern tech presentations.
00:07
HD
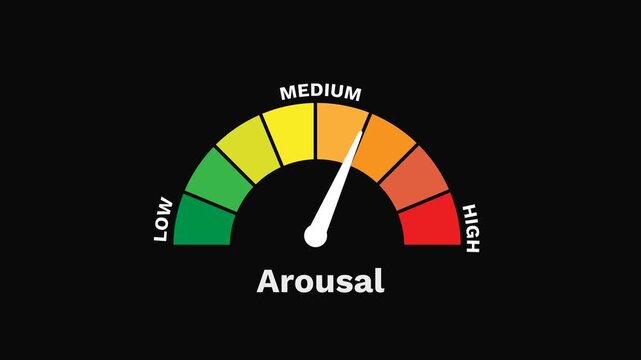
Arousal Level Gauge Increasing and Decreasing Indicating Excitement and Activation Animation
00:19
HD
Glowing business chart illustrating rising quality and falling cost with a blue upward arrow and red downward arrow. quality increase, cost control and optimization. Successful business strategy,
00:10
HD
Cost reduction and cost saving through digital transformation, business cost optimization, operational cost reduction, financial savings, and resource efficiency strategies for business success. Muxer
00:12
HD
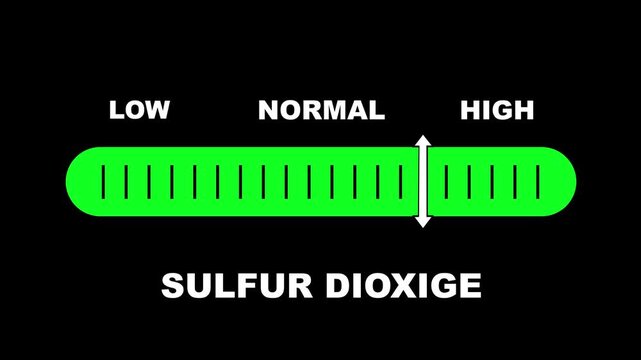
Sulfur dioxide level indicator scale. Low normal & high meter infographic animation on black background. Showing high sulfur dioxide level color gauge indicator for Air quality environmental pollution
00:10
HD
Line art success graph icon animation. Finance and business, Financial report. Financial analysis icon. Animated line growth and decrease diagram.
00:05
HD
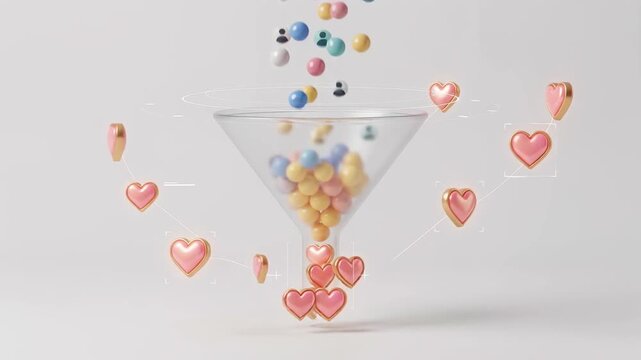
Colorful user spheres pouring into a glass funnel and transforming into floating hearts, symbolizing SaaS customer retention, user loyalty optimization, churn reduction analytics, and engagement.
00:06
HD
Bar chart for declining business performance by month. the curve shows a downward move .chart graph animation, 4k arrow is making downfall on a grid ...
00:10
HD
simple green random shape graph rising up down value sliced shape background blue background screen animation stock video footage
00:20
HD
Neon car trading value conceptual illustration of finance and investment opportunities on black background
00:08
HD
Bar chart animation displays a declining trend line on dark. Negative financial revenue performance marks this bar chart. Business economic downturn reflects on the chart.
00:07
HD
Artificial Intelligence Reducing Cost and Increasing Quality Concept, AI Chip Process Automation, Cost Down Quality Up Neon Glowing Digital Diagram Motion Graphics Animation Video
00:08
HD
Business graph chart with growing business concept. Abstract decreasing business graph chart animation  background.
00:10
HD
White line chart with moving trends on black background grid. Financial success graph for corporate business performance analysis. Animated bar graph report.
00:13
HD
Animated down graph icon designed in flat icon style. Finance, Business Info graphic animation, Bar down graph Animated down graph icon, business or finance, down graph bar,4k video
00:10
HD
Stock Market Crash and Financial Loss Line Graph Animation with Red Arrow and Negative Dollar Values
00:10
HD
Declining Graph Line Illustration Showing Downward Trend.
00:10
HD
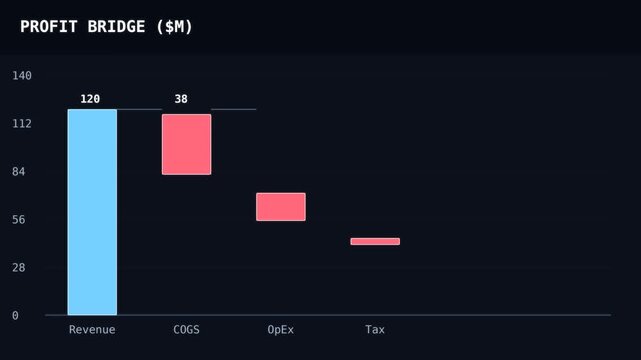
Profit bridge waterfall chart moving from revenue through costs to net profit with connectors. Illustrative financial graphic for business reports.
00:10
HD
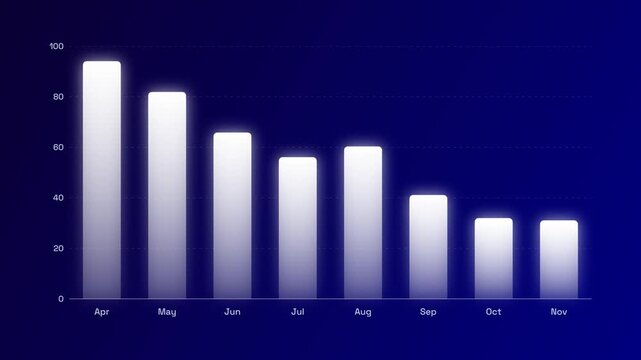
Glowing white bar chart showing downward trend from April to November
00:07
HD
Graph shows changing data values over time indicating trends in a digital format with varying heights of bars.
00:10
HD
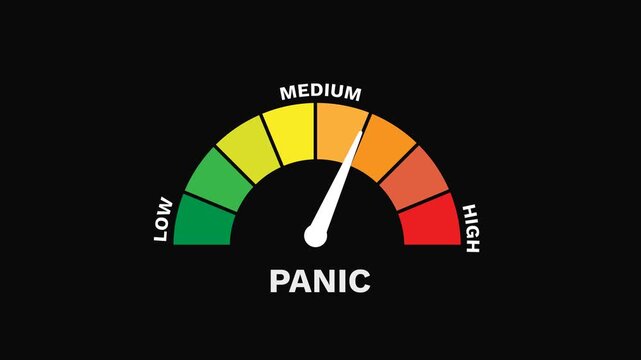
Panic Level Gauge Increasing and Decreasing Indicating Fear and Anxiety 2D Motion Graphic
00:19
HD
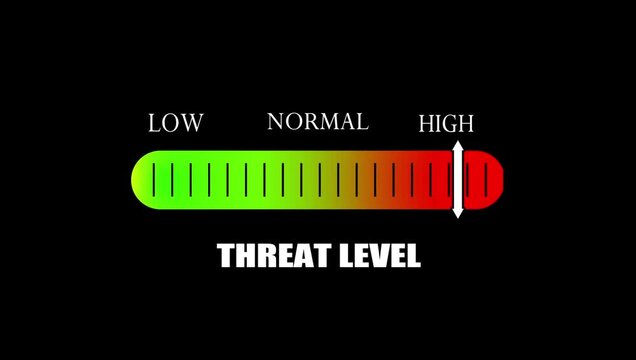
Threat Level Indicator Gauge Animation with Low, Normal and High Risk Scale for Safety and Security Monitoring
00:06
HD
Professionals collaborate in a modern office to focus on environmental issues, utilizing digital tools to strategize solutions for CO2 reduction and sustainability efforts. Raster
00:12
HD
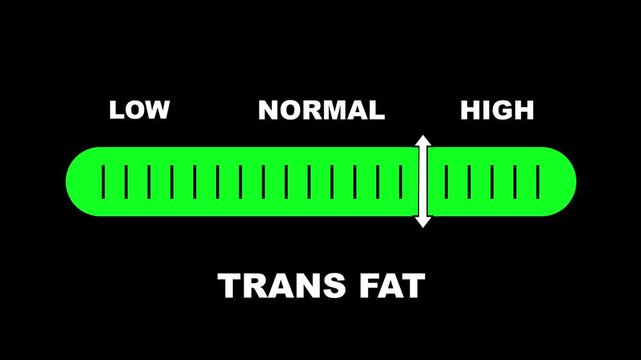
Trans fat level indicator scale. Low normal & high meter infographic animation on black background. Showing high trans fat level color gauge indicator for nutrition and heart health monitoring.
00:10
HD
Digital transformation in business concept. Leveraging modern technologies; automation, data analytics, cloud computing and AI to increase efficiency, reduce costs and gain competitive advantage.
00:12
HD
Blue bar chart with a downward trend arrow
00:10
HD
Bar chart for declining business performance by month. the curve shows a downward move .chart graph animation, 4k arrow is making downfall on a grid ...
00:10
HD
Digital Volume Control Animation Increasing and Decreasing, Isolated on Green Screen
00:10
HD
Abstract increase icon on black background. Dollar rate up looped icon. Reduce costs sign and symbol. motion video 4k quality..
00:06
HD
Red Bar Graph with Downward Trend and White Arrow Showing a Rise chart
00:07
HD
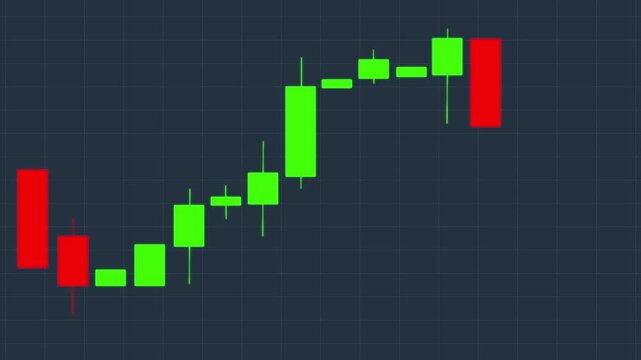
Stock Market Candlestick Chart Animation Showing Bullish Trend Rise Followed by Bearish Trend Fall, Financial Trading, Forex, Crypto Investment Analysis Graph on Dark Grid Background Loop
00:09
HD
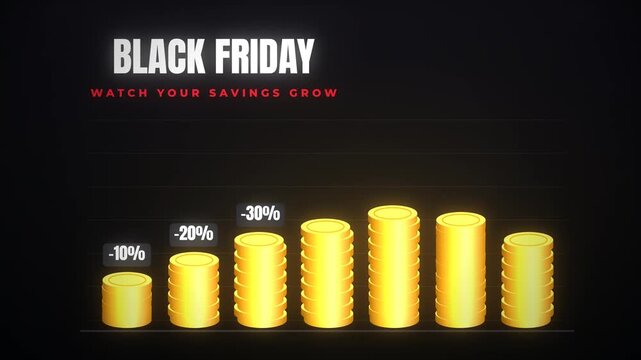
Black Friday savings growth represented by rising stacks of gold coins with discount percentages
00:10
HD
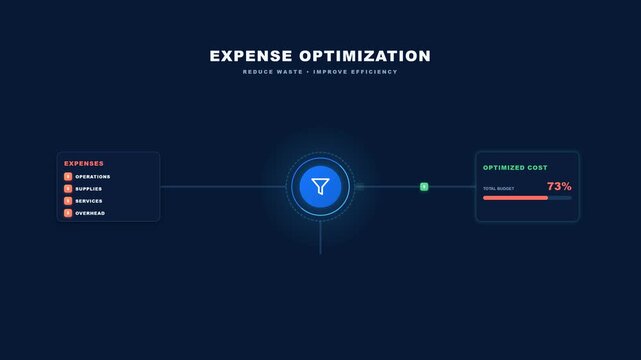
Expense Optimization abstract concept with filter and progress bar.
00:08
HD
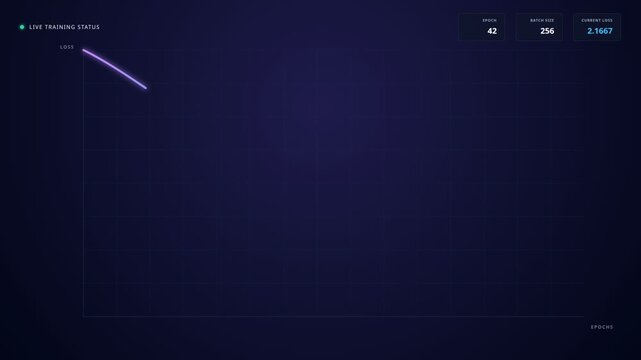
Data visualization for machine learning loss function decreasing during deep learning model training, for optimization, algorithm convergence, neural network development, code efficiency
00:20
HD
Neon red downward arrow graph symbolizes financial decline, economic crisis, or decreasing market trends. Futuristic style with bokeh background highlights loss and negative growth.
00:10
HD
Cost Reduction Business Growth Motion Graphics Line Chart Arrow Down Concept, Financial Loss Analysis, Budget Cut Optimization, Downward Arrow Graphic with Text Animation on Black Background.
00:10
HD
Download free with trialBusiness efficiency concept on black background. how much a company or organization can produce as it relates to time, cost and quality.
00:15
HD
graph chart up down business statistics
00:06
HD
Percentage Graphics Showing Progress and Completion.
00:06
HD
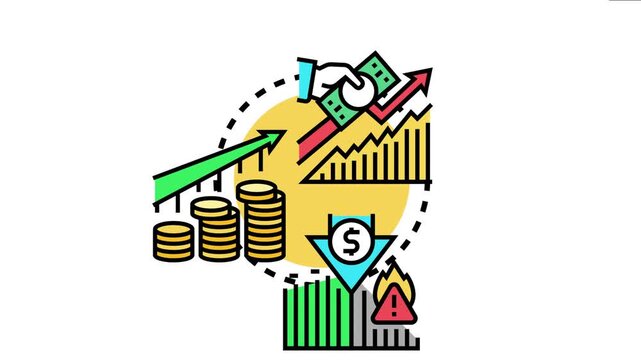
Graphic displaying financial market trends with an upward revenue arrow, currency investing hand, rising coins, and a downturn risk with a dollar sign decrease and warning flame
00:17
HD
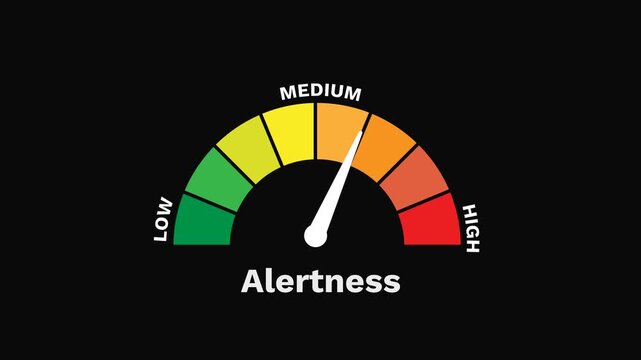
Alertness Level Gauge Increasing and Decreasing Indicating Focus and Awareness 2D Motion Graphic
00:19
HD
Chart Time Graph Icon Animation with Glowing Lines on Black Background
00:08
HD
Cost reduction and cost saving through digital transformation, business cost optimization, operational cost reduction, financial savings, and resource efficiency strategies for business success. Spire
00:20
HD
Financial Growth Graph Animation Featuring Increasing Business Performance Bars
00:07
HD
Digital transformation in business concept. Leveraging modern technologies; automation, data analytics, cloud computing and AI to increase efficiency, reduce costs and gain competitive advantage.4k
00:10
HD
Neon Celsius thermometer displayed temperature 40 degree. Digital Temperature Meter Display 40°C. That's indicates weather temperature 40 degree increase or decline.4k video.
00:10
HD
Downward Arrow Animation Loop for Business Decline, Financial Loss, Decreasing Profits, Negative Growth, Falling Trend, Market Drop and Corporate Motion Graphic..
00:10
HD

Bar chart animation showing changing data values, representing business analytics, statistics, performance comparison, financial reporting, growth and market trends.
00:06
HD
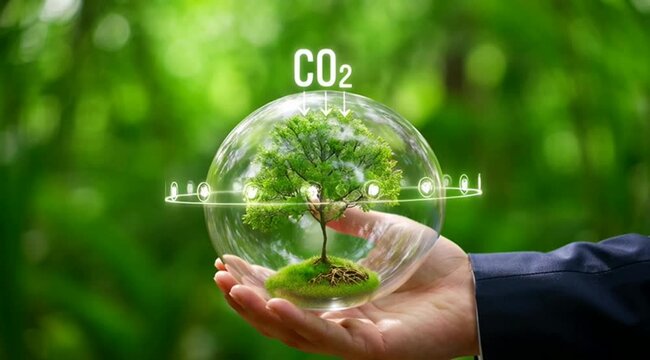
Business holding a glass sphere containing a growing tree with digital c o2 emission reduction representing environmental
00:06
HD
Brightness slider level control animation isolated on black background, slider level adjust 0 to 100, simple brightness contrast icon animated.
00:06
HD
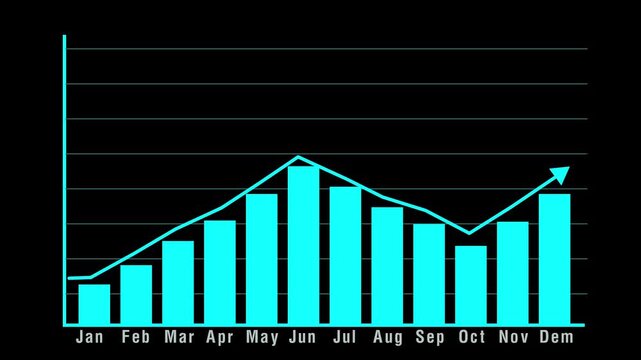
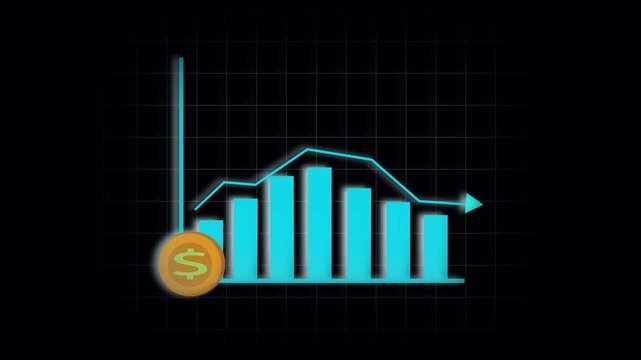
Cyan bar chart animation displays fluctuating market trend lines. Trading volatility analytics track on this cyan bar chart. Corporate economic investment revenue drives the bar chart.
00:10
HD
Three large digital numbers counting down on dark background with dark reflective surface close
00:05
HD
Bar chart animation with growth and decline. Bar chart financial market data analysis. Bar chart business statistics graphic on black background for performance.
00:09
HD
Dynamic danger gauge meter animation with moving needle indicating increasing risk levels from low to on a black background, for industrial safety, monitoring, risk assessment, and data visualization
00:10
HD
Hands Holding A Glass Sphere With Sustainable Environment Icons Representing Renewable Energy And Global Eco Friendly Solutions For A Greener Future
00:09
HD
Abstract glowing business graph chart animation. graph chart showing marketing sales profit target growth in future. Growing business ideas. Growing business graph icon.4k, video, black, background,
00:10
HD
Neon glowing medical thermometer icon animation. That's indicates weather temperature 78 degree increase or decline. Thermometer equipment showing hot or cold weather.
00:10
HD
Zoom in and out animation the octagon symbol. Large black symbol in the center and four small symbols around. Seamless looped 4k animation on white background
00:12
HD
Quality improvement and cost reduction concept with blue quality line rising and red cost line falling. Quality improvement and cost reduction concept.
00:10
HD
Global poverty reduction efforts addressing pressing issues like hunger, social inequality, and lack of resources, aiming for sustainable development and a better future for humanity
00:17
HD
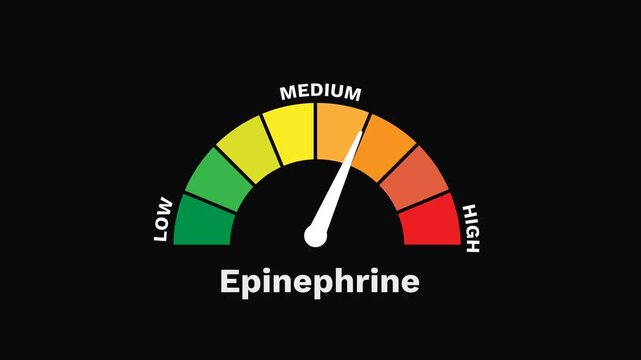
Epinephrine Hormone Level Gauge Increasing and Decreasing, Alertness and Panic Response 2D Motion Graphic
00:19
HD
Stop motion. Animation. Heartbeat line morphs into falling red arrow on dark grid, showing sudden economic flatline. Concept of downturn, crisis mode, emergency slowdown, collapse, instability.
00:06
HD
Cost reduction and cost saving through digital transformation, business cost optimization, operational cost reduction, financial savings, and resource efficiency strategies for business success. Spire
00:20
HD
Abstract background with rising and falling arrows showing growth decline data flow and business trend concepts animation
00:18
HD
Minimal zigzag line falling downward trend or decline animation, Line and upward arrow growth rise and progress
00:06
HD
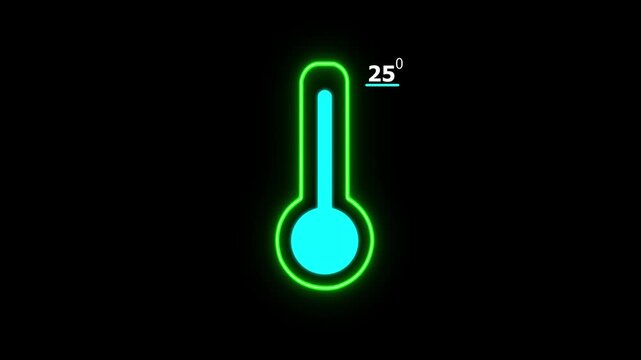
Neon Celsius thermometer displayed temperature 25 degree. Digital Temperature Meter Display 25°C. That's indicates weather temperature 25 degree increase or decline.4k video.
00:10
HD
colorful bar chart
00:12
HD
Animated business investment decline financial chart stock market economy abstract background loop. Stock market graph animation financial chart business economy dollar coin money decrease trend.
00:06
HD
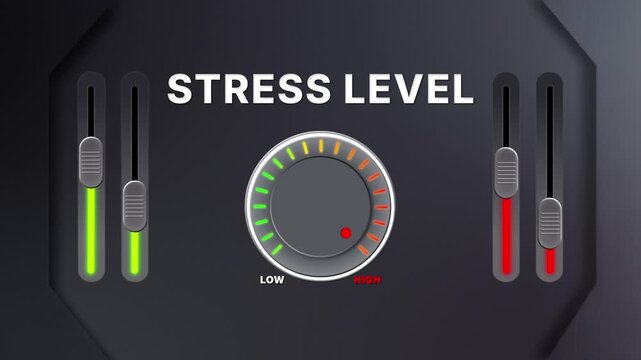
Animation of Stress level on a circular gauge moving from low to high and back. Can be used to show increase or decrease. Perfect for health, fitness, or data content.
00:26
HD
Abstract business graph icon animation background.Business graph chart with growing business concept. Abstract decreasing business graph chart animation background. 4k video.
00:10
HD
Cost Reduction Business Growth Motion Graphics Line Chart Arrow Down Concept, Financial Loss Analysis, Budget Cut Optimization, Downward Arrow Graphic with Text Animation on Black Background.
00:10
HD
Power gauge meter animation with moving needle indicating low to levels on black background indicator
00:10
HD
Dollar currency value decrease on financial graph. Red line showing falling market trend. Business finance data footage.
00:05
HD
Glowing line graph rising steadily to show market growth. Animated chart for finance, trading, and business presentations.
00:09
HD
The text "GDP" and a chart showing increase or decrease. Gross domestic product concept. An index indicating inflation and economic growth.
00:09
HD
A red arrow pointing down on a black surface. Concept of decline or decrease
00:05
HD
Professional business growth graph chart with rising monthly revenue, glowing arrow animation, and increasing sales performance on black background illustrating financial goals
00:17
HD
Zoom in and out animation the verified badge symbol. Large black symbol in the center and four small symbols around. Seamless looped 4k animation on white background
00:12
HD