Et link til indstilling af din adgangskode er sendt til: For at få adgang til dine køb i fremtiden har du brug for en adgangskode.
Få 3 videoer eller 25 billeder med en gratis prøveversion
Nye filtre tilføjet
Sortér efter

5.504 resultater for histogram i videoer

Neon-style histogram chart on black background with glowing edges, rising bars peaking mid-left then descending animation
00:05
HD
Animated histogram columns infographic in a modern flat vector style, seven columns growing in a smooth 4K loop. Blank text placeholders and orange and amber accents sit on a bright light background s
00:07
HD
Handheld shot of a woman from behind photographing the skyline, Dubai, United Arab Emirates at night: frosted glass panels overlay with creator camera interface, night mode timer, live histogram
00:10
HD
Sales result comparison vertical histogram infographic element animation. Products analyzing. Animated chart graph. Dynamic data visualization on white background. HD video, motion graphics
00:09
HD
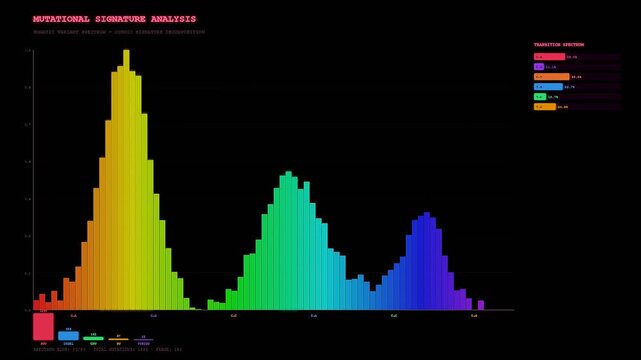
A complex motion graphic showcasing bioinformatics genome analysis illustrates mutational signatures using animated histogram bars that shift and grow across the screen in vibrant colors.
00:06
HD
Symmetrical histogram bar chart graph bar animation
00:07
HD
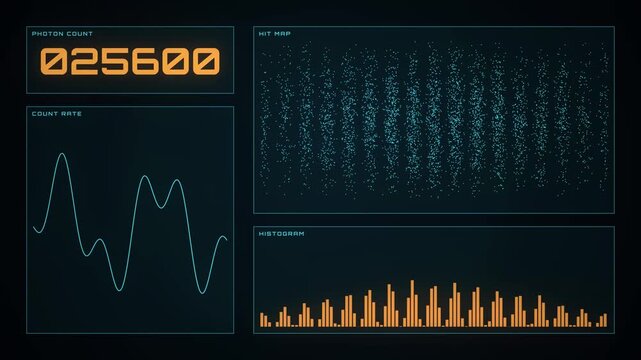
Scientific experiment data visualization showing photon counts, hit maps, count rates, and histograms over time
00:10
HD
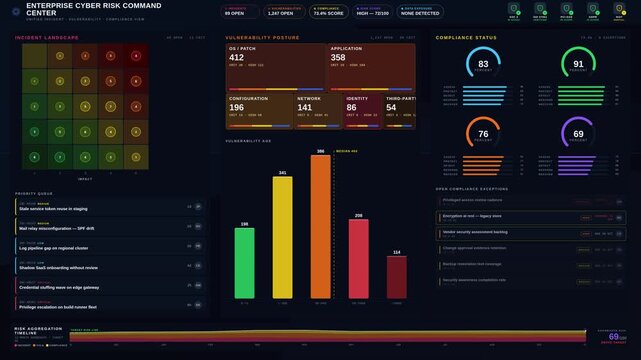
Enterprise cyber risk command center dashboard animation. Dark mode interface displaying incidents, vulnerabilities, and compliance metrics. Premium 4K loop for security operations and executive.
00:15
HD
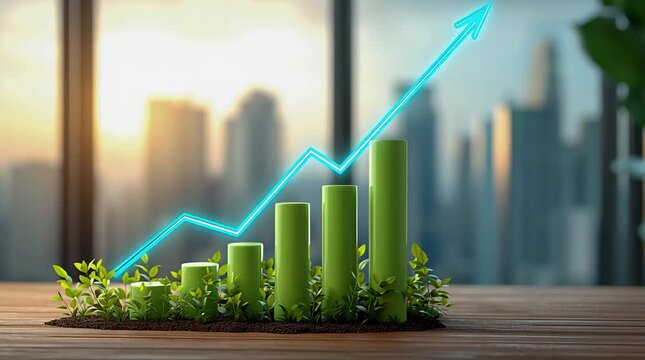
A green histogram of wooden bars growing out of leaves, with a glowing arrow pointing upwards against the backdrop of a blurred city.
00:06
HD
On data pulse, magenta histogram expanding and cyan line tracing markers to show trends
00:10
HD
Soft neon histogram for volume analysis
00:13
HD
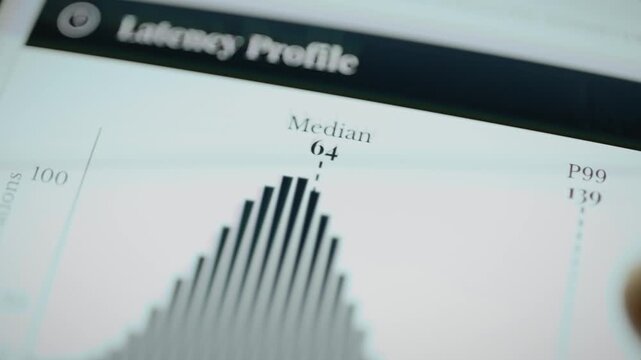
Latency profile histogram shifts beneath trading fill metric
00:10
HD
Nostalgic 1990s retro operating system file copy dialog with animated flying paper documents, cascading window shadows, dual progress bars, and throughput histograms in phosphor green and amber.
00:12
HD
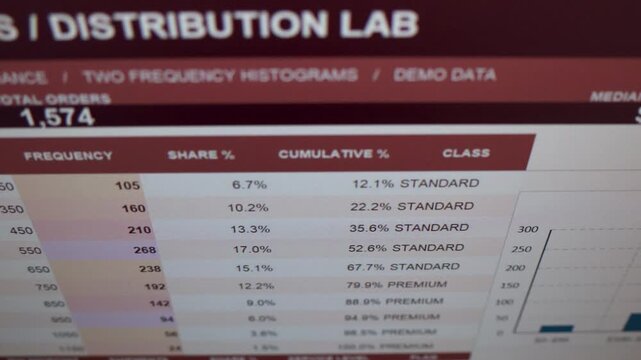
Sales Order Frequency Histogram on Screen Filmed with Camera A business monitor displays transaction class statistics and bar graphs showing order value distribution.
00:27
HD
A dark mode histogram titled "User control Analysis" displays a distribution of data with various grey bars on a stark black background.
00:10
HD
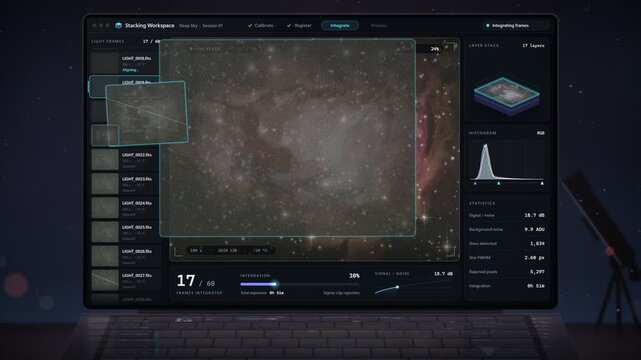
Laptop Screen Stacking Astrophotography Frames Generic Interface Blending Into Clean Nebula Image 4K Seamless Loop
00:15
HD
Line graph. Linear chart growth, business diagram graphs and colorful histogram graph isolated vector set
00:05
HD
Modular Camera Hud with Six Fixed Information Modules, Exposure, Audio, LUT and Histogram Controls on Transparent Background for Video Editing. 4K
00:15
HD
Digital color histogram and waveform monitor interface on computer display davinci resolve
00:10
HD
Four panel dark dashboard with dual line chart capsule bar chart histogram and donut gauges
00:10
HD
Neon-style histogram chart on black background with glowing edges, rising bars peaking mid-left then descending animation
00:05
HD
Data sampling distribution balance monitor with histogram bell curve stratum bars, for statistics, quality control, 4k machine learning performance data
00:20
HD
Explore the Water Maintenance Planning Dashboard showcasing pipeline repairs using asset risk scores in a sleek dark executive design with dynamic visual analytics and prioritization features.
00:15
HD
A close-up shot of an RGB histogram graph monitor screen
00:12
HD
Seamless 4K looping finance animation: return distribution histogram breathing bars. Flat vector trading terminal with grid, axis ticks and blank readout cards in deep blue on a deep dark background,
00:07
HD
FinOps executive dashboard animation displaying cloud costs, forecasts, and unit economics in dark mode with 4K quality for commercial creative technology and business use.
00:15
HD
Green Code Decryption Ultra Byte Histogram Round Trace Segment Map Console.

00:15
HD
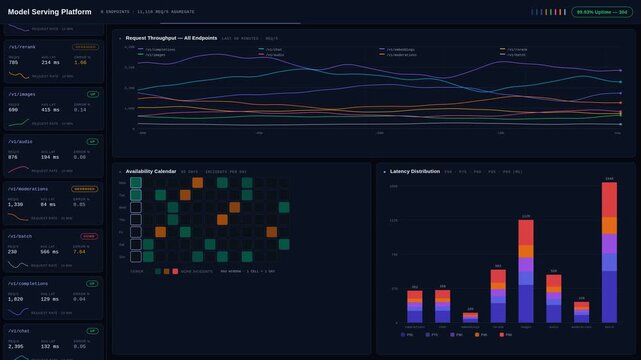
A detailed AI model serving dashboard showcasing endpoints, requests, latency metrics, and availability status with an elegant color palette and animated visualizations.
00:15
HD
A green histogram of wooden bars growing out of leaves, with a glowing arrow pointing upwards against the backdrop of a blurred city.
00:08
HD
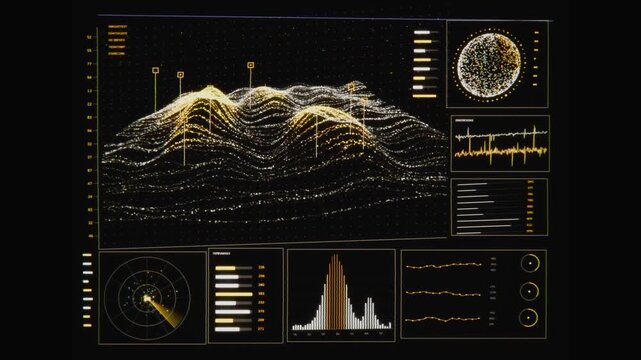
Animating central 3D waveform on HUD after feed update, showing peak callout histogram
00:10
HD
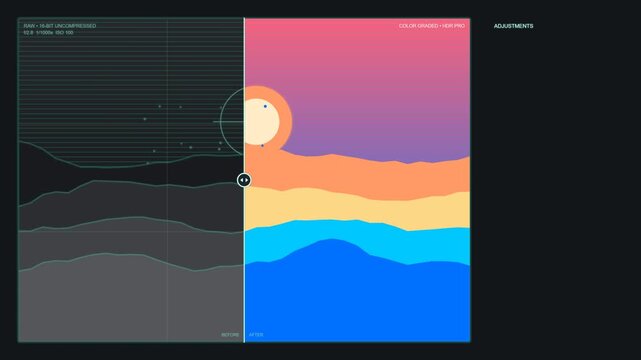
Professional digital photo editing interface with color adjustment curves a technical software display with correction and histogram adjustments photography
00:10
HD
Latency histogram updates median and tail percentile markers
00:10
HD
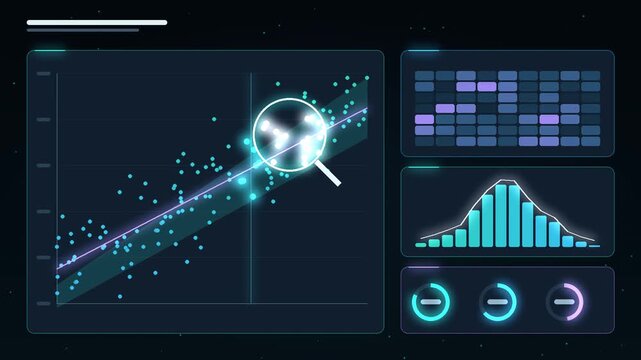
Research data analysis motion graphics, scatter plot with regression trend line and magnifying glass scanning data points, heatmap, histogram and progress rings, scientific statistics dashboard, text
00:12
HD
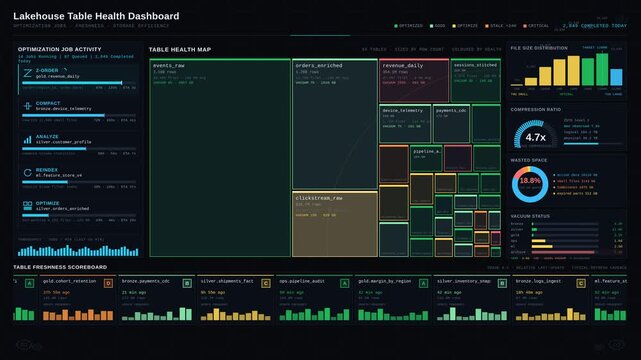
Explore a modern Lakehouse Table Health Dashboard showcasing optimization jobs, freshness metrics, and storage efficiency with a sleek dark aesthetic and vibrant color coding.
00:15
HD
A detailed vertical bar chart, resembling a histogram on a dark background, effectively illustrates the 'Distribution of Values' or frequency across discrete categories.
00:08
HD
Electricity price surge insights from power plant data and histogram representation
00:05
HD
MACD bullish crossover on glassmorphism cards over drifting colour blobs with histogram turning positive and signal label
00:10
HD
Motion animated footage. Statistics bars columns growth, arrow up. Finance, Bar graph going up, Profit concept, positive increase chart. business graph animation
00:10
HD
Circular histogram bars rotating around center
00:08
HD
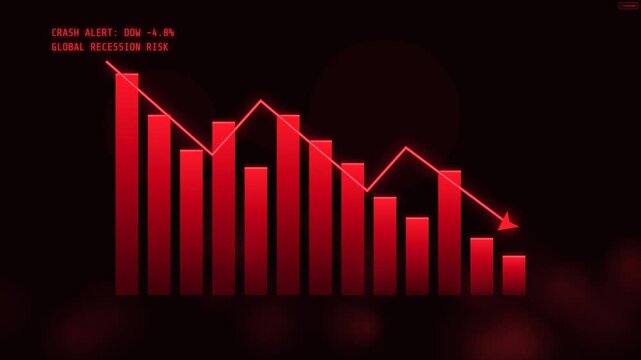
Dramatic financial crisis and market crash scene with descending red histogram bar columns, jagged plunging red fracture trend line, downward arrow, a.
00:06
HD
Neon-style histogram chart on black background with glowing edges, rising bars peaking mid-left then descending animation
00:05
HD
An immersive 4K AI decision-space heatmap featuring dynamic color transitions, agent-cursor paths, and a real-time confidence-distribution histogram on a dark background.
00:15
HD
Data viz pulsing from new data on dark grid, showing 3 trend lines, boxplots or histogram gold burst
00:05
HD
Premium enterprise AI audit dashboard animation tracking agent actions, execution timestamps, and policy validation in a dark interface. Features detailed ledger, trace timeline.
00:15
HD
Animated white histogram showing increasing values, accompanied by an upward-pointing arrow motion
00:05
HD
Cinematic 4K manufacturing command center interface displaying live production targets, equipment states, and factory topology with animated data visualization and industrial control room aesthetics.
00:15
HD
A close-up shot of an RGB histogram graph monitor screen
00:11
HD
Stylish glass user interface displaying inference latency with smooth animations, featuring a sleek black background, vibrant azure and rose rim accents, and a translucent panel showing histogram
00:15
HD
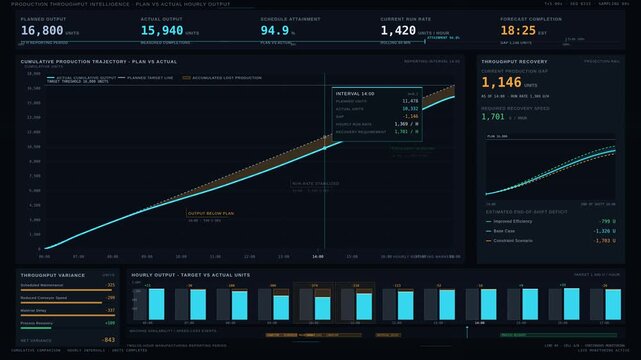
Cinematic 4K production dashboard comparing target throughput against actual hourly output with dark graphite interface, cyan traces, and industrial analytics.
00:15
HD
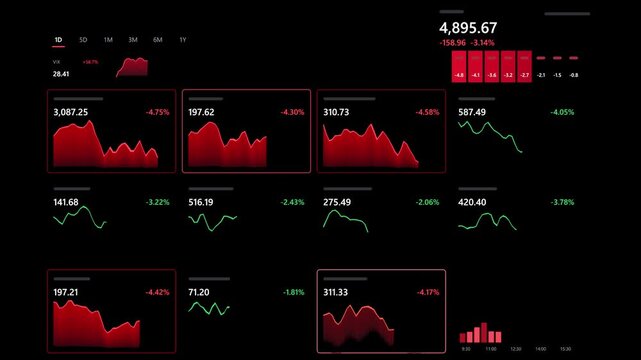
Showing 3x4 dashboard on load, red drops signaling downturn onscreen with index and histogram
00:10
HD
Stock chart trading histogram global market, economic trends world and analysis invest financial business, futuristic exchange concept
00:20
HD
Scatterplot displays data points, histogram shows distribution. Blue tones dominate, creating abstract visualization.
00:07
HD
Financial market data trend analysis with bar graph and circular UI an analytical interface showing blue wave lines and a red histogram chart, accompanied by a crosshair target
00:10
HD
Animated histogram with bell curve overlay
00:10
HD
A detailed vertical bar chart, resembling a histogram on a dark background, effectively illustrates the 'Distribution of Values' or frequency across discrete categories.
00:05
HD
Dollar Cost Averaging Investment Strategy Chart Buy Points Animation
00:15
HD
Line graph. Linear chart growth, business diagram graphs and colorful histogram graph isolated vector set
00:05
HD
Happy beautiful young Asian businesswoman sitting smiling comfortable at her private desk while checking and analyzing histogram graph and chart data from paperwork files at workplace in the office.
00:12
HD
Volatile red neon line graph with volume histogram
00:10
HD
Stocks, bonds and real estate line charts over a blue volume histogram on deep blue, camera glides left to right, investment portfolio animation
00:14
HD
Neon-style histogram chart on black background with glowing edges, rising bars peaking mid-left then descending animation
00:05
HD
Premium enterprise identity governance dashboard animation featuring dormant account cleanup, permission matrix, and security workflow in dark UI with cyan and amber accents.
00:15
HD
50% percent Call out Pie Chart Animation. 100 percent circle loading icon pie chart diagrams. 100 percentage chart for finance, sales ,HUD Animated futuristic infographic with histogram
00:10
HD
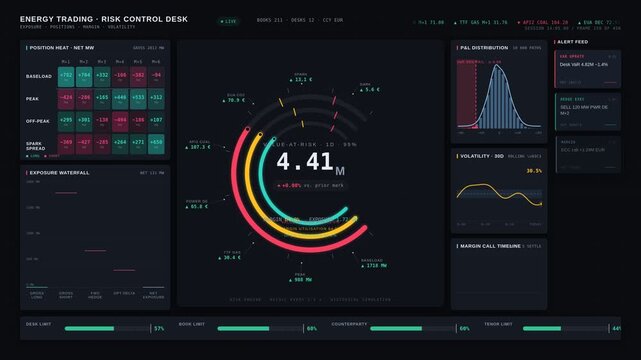
Energy trading risk dashboard monitoring exposure positions, margins, and volatility with dynamic radial gauges and heat grids on a dark interface for commercial creative technology and business use.
00:15
HD
Growth bar chart animation displays percentage values on grid. Corporate business revenue tracks on the growth bar chart. Profitable economic investment data drives the chart.
00:06
HD
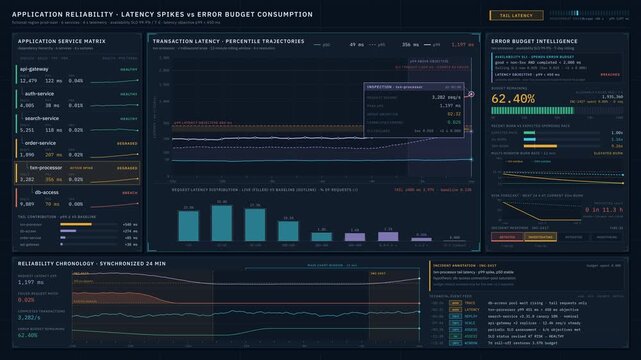
Cinematic 4K application reliability engineering dashboard visualizing latency spikes, SLO performance, and error budget consumption with evolving service-level analytics.
00:15
HD
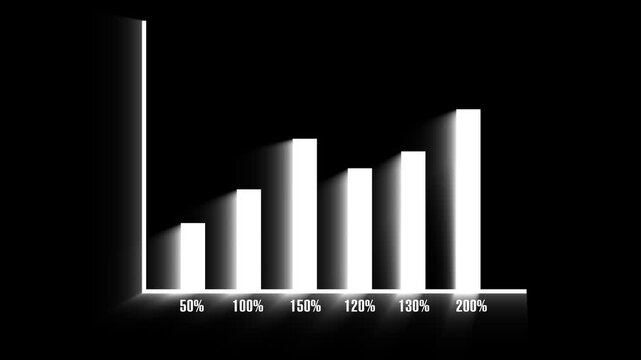
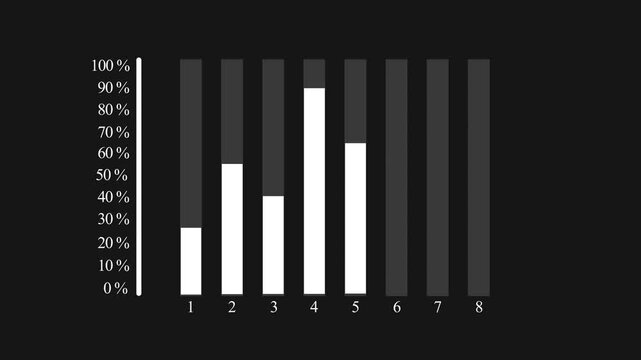
Animated histogram with data showing growth over 8 steps percent on black background motion graphic
00:10
HD
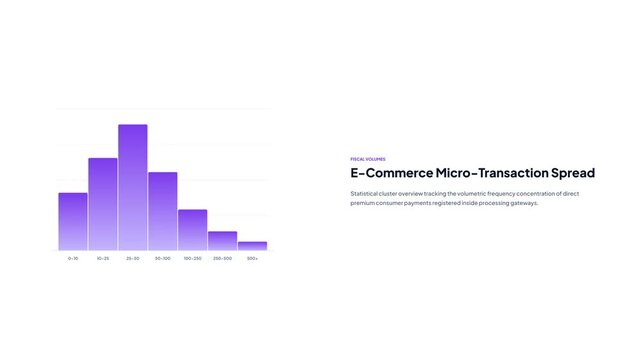
E-commerce micro-transaction spread histogram chart vector animation with data visualization text
00:06
HD
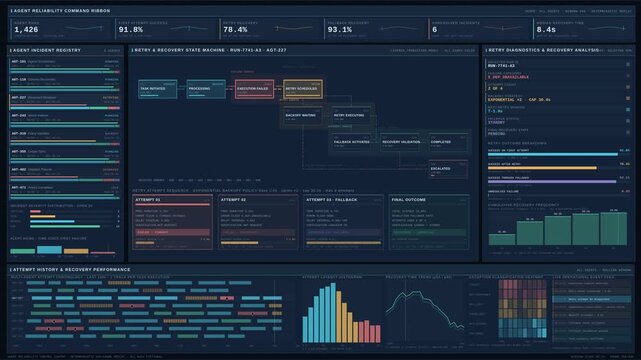
Autonomous AI agent reliability monitoring dashboard visualizing retry attempts, exponential backoff, and recovery outcomes in a sophisticated dark interface.
00:15
HD
Thin lines tracing curved paths starting central brain shape linking charts showing data growth
00:12
HD
Tracking camera diagonally revealing three-row neon-blue columns, showing histogram on dark grid
00:05
HD
Clean animated histogram bins revealing density in cyan and teal on a bright white background. Seamless looping 4K dashboard motion graphics with free space for text, ideal for business presentations,
00:07
HD
histogram animated icon
00:06
HD
Animated dot histogram with stacked dots with alpha channel
00:10
HD
A detailed vertical bar chart, resembling a histogram on a dark background, effectively illustrates the 'Distribution of Values' or frequency across discrete categories.
00:19
HD
95% percent Call out Pie Chart Animation. 100 percent circle loading icon pie chart diagrams. 100 percentage chart for finance, sales ,HUD Animated futuristic infographic with histogram
00:08
HD
Line graph. Linear chart growth, business diagram graphs and colorful histogram graph isolated vector set
00:05
HD
Happy beautiful Asian woman real estate business owner sitting smiling comfortable at her private desk while checking and analyzing histogram data from paperwork files at the workplace in the office.
00:11
HD
Stock market trade horizontal histogram infographic element animation. E commerce strategy analytics. Animated chart graph. Dynamic data visualization on white background. HD video, motion graphics
00:09
HD
Camera recording screen overlay with alpha channel Loop
00:10
HD
Neon-style histogram chart on black background with glowing edges, rising bars peaking mid-left then descending animation
00:05
HD
Premium autonomous agent dashboard visualizing task delegation, output validation, and quality metrics in a dark enterprise interface with teal and purple accents for AI operations monitoring.
00:15
HD
Enterprise cloud resource dashboard with multi-account views, regional heat maps, and utilization trends in a dark mode 4K interface for commercial creative technology and business use.
00:15
HD
4K dark-mode dashboard displaying interactive Gantt chart with resource load histogram and efficiency donut for production scheduling optimization. professional stock footage for technology,.
00:15
HD
Camera histogram video element recording screen overlay. High quality 4k footage
00:16
HD
3d render with a monochrome map of the earth with the concept of raising the water level
00:06
HD
Dynamic abstract histogram with a high in the center. Growing blue glowing columns on black background.
00:10
HD
Minimalist blue bar graph histogram chart animation showing population demographics data
00:06
HD
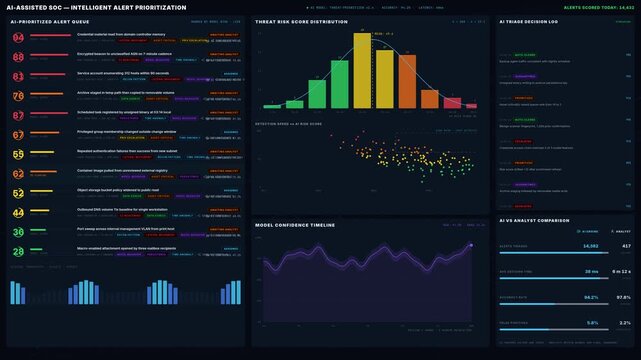
Premium dark mode AI SOC dashboard animation visualizing automated threat risk scoring, prioritized alert queue with confidence rings, and live model performance metrics in a futuristic security.
00:15
HD
Data feed starting, red produce staying static while magenta histogram growing and visualizing data
00:11
HD
Glowing 3D Histogram Bars Morphing Through Statistical Distributions With Data Particles
00:15
HD
3D blue histogram in motion, loop
00:10
HD
A histogram reflecting business growth. Company growth dynamics. Computer animation of the growth chart.
00:10
HD
Dark mode industrial dashboard animation monitoring production efficiency, cycle time drift, and throughput changes with detailed signal plots and station diagnostics for manufacturing analytics.
00:15
HD
A detailed vertical bar chart, resembling a histogram on a dark background, effectively illustrates the 'Distribution of Values' or frequency across discrete categories.
00:10
HD
Cinematic DevOps pipeline dashboard visualizing build stages, automated testing, and release performance metrics with dark technical interface for commercial creative technology and business use.
00:15
HD
Animated futuristic linear histogram, graphs and charts. Futuristic linear histogram with visually appealing spanning lines, ideal for data analysis presentations.
00:10
HD
Happy beautiful Asian woman real estate business owner sitting smiling comfortable at her private desk while checking and analyzing histogram data from paperwork files at the workplace in the office.
00:09
HD
Indicator color signal, table. Close-up of video editing on a computer monitor, showing the editing software interface, timeline, and correction workflow in detail. Laptop or display, Mixing
00:23
HD
Cinematic autonomous workflow monitoring dashboard featuring distributed execution traces, timestamped logs, agent activity, and real-time system reliability metrics in dark UI.
00:15
HD