Et link til indstilling af din adgangskode er sendt til: For at få adgang til dine køb i fremtiden har du brug for en adgangskode.

Få 3 videoer eller 25 billeder med en gratis prøveversion
Nye filtre tilføjet
Sortér efter

917 resultater for correlation i videoer

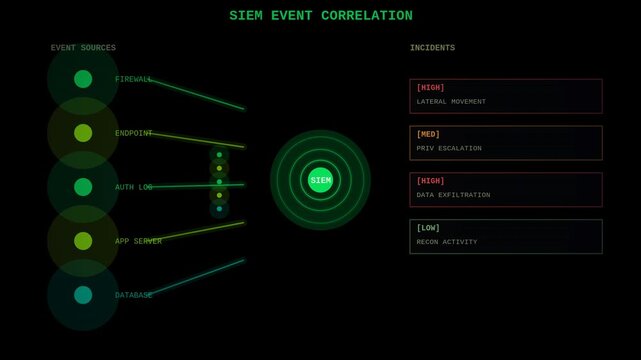
 Event correlation HUD animated alpha overlay. Security logs and incident UI
00:10
HD
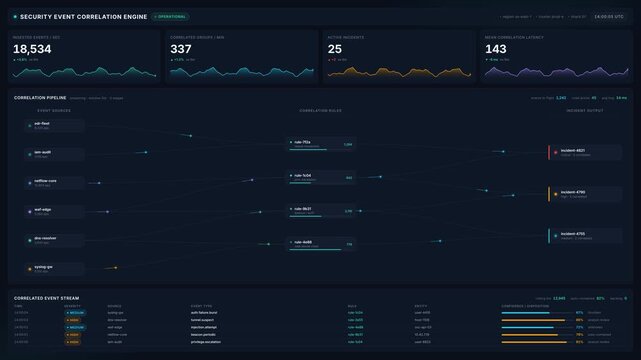
Security event correlation engine dashboard interface with live data streams incident alerts, for cyber threat monitoring, network security analysis, enterprise risk management
00:20
HD
Negative correlation concept a cause and effect relationship where one element's increase leads to another's decrease. Impacting user ratings. Customer satisfaction
00:17
HD
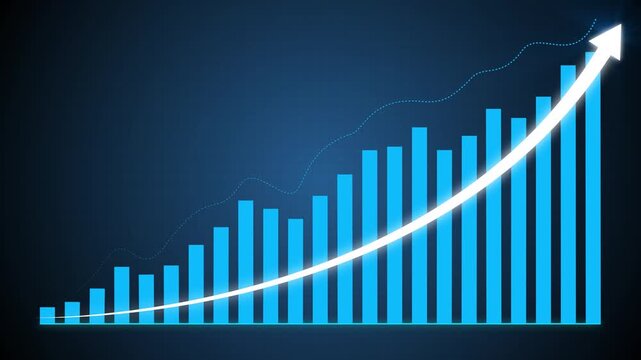
Business growth concept in allusive graph chart showing marketing sales profit increasing to target . Excellent financial status of corporate business rise up.4k animation video graph
00:10
HD
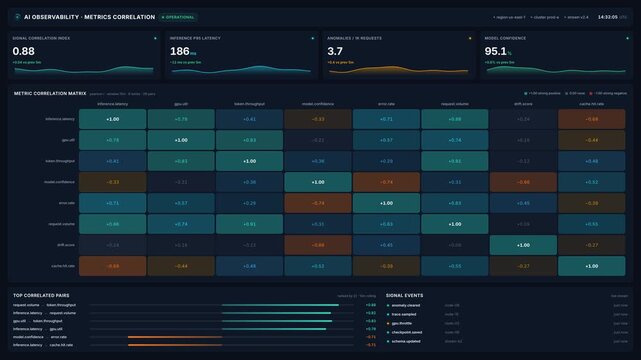
Ai observability dashboard with 4k animated metric correlation matrix heatmap, for real time performance monitoring, system reliability, data driven decision making for
00:20
HD
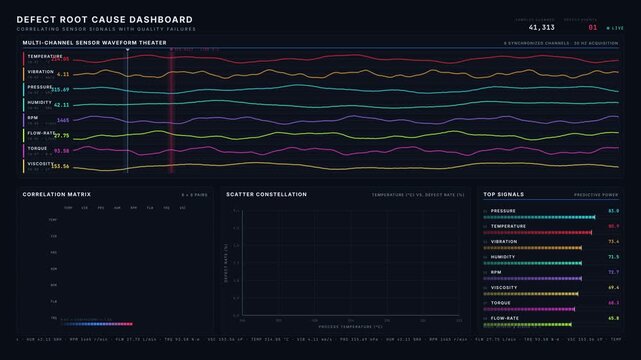
Explore a sophisticated defect root cause dashboard that correlates sensor signals with quality failures, showcasing dynamic waveforms and a correlation matrix in dark mode.
00:15
HD
Medium shot of a colorful commodity price correlation matrix heatmap on a computer screen with sharp focus on a cluster of strongly correlated assets.
00:05
HD
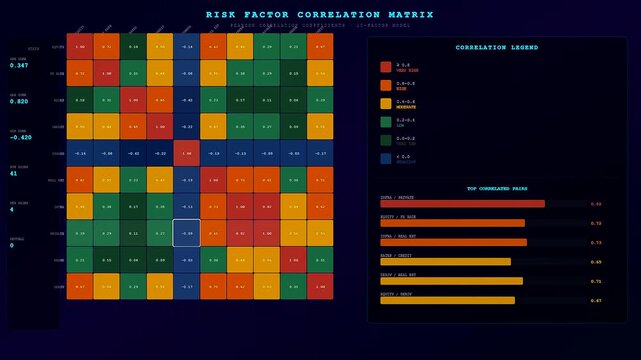
A quantitative risk assessment data visualization displays complex financial correlation metrics and color coded grids for analytical review inside a dark user interface dashboard software
00:06
HD
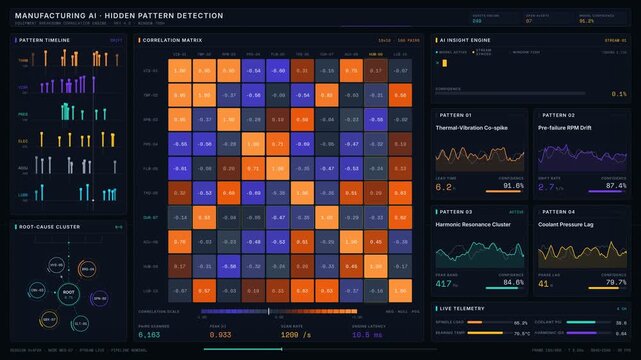
Explore a dark-mode manufacturing AI dashboard revealing hidden patterns behind equipment breakdowns with a dynamic correlation matrix and insightful data visualizations.
00:15
HD
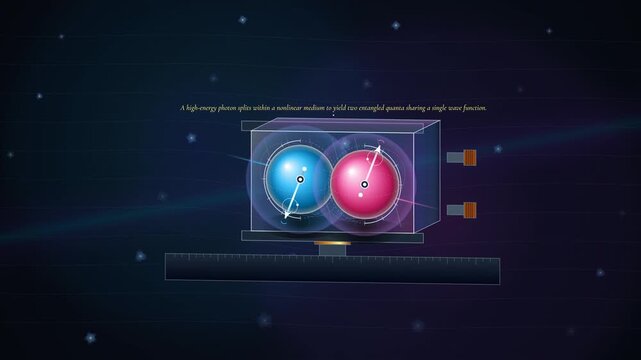
Educational animation visualizing the process of quantum entanglement, showing photon splitting, entangled quanta sharing a wave function, and nonlocal correlation across spatial separation
00:59
HD
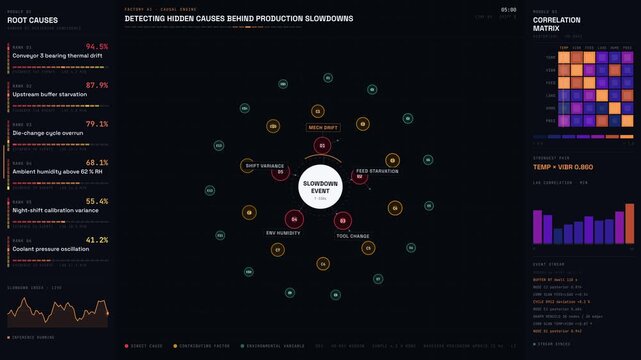
A sophisticated AI dashboard visualizes hidden production slowdown causes with a dynamic network graph and detailed correlation matrix in dark mode for advanced analysis.
00:15
HD
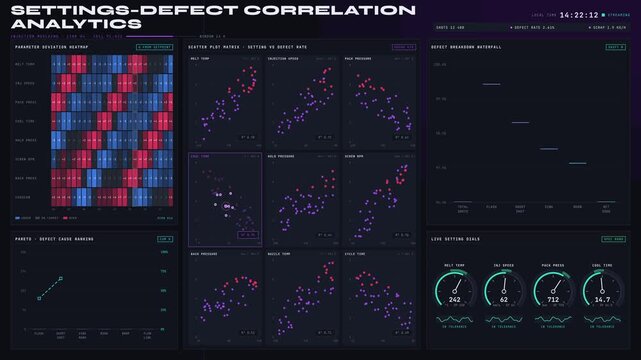
Explore the correlation between machine settings and defect rates in plastic production through a dynamic dashboard with various analytical charts and visualizations.
00:15
HD
Animated data correlation bubbles floating on white background
00:46
HD
Abstract bubble chart correlation glowing background seamless loop
00:10
HD
Male doctor in a white coat drawing a diagram on a glass screen explaining the correlation between a healthy sleep cycle and an increase in the body's metabolic rate and energy levels
00:10
HD
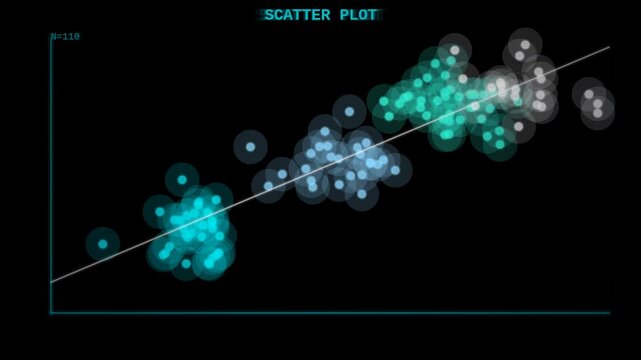
Data Correlation Analysis and Multivariable Scatter Plot Clusters
00:10
HD
Neural Imaging Waveforms: fNIRS vs. fMRI Correlation
00:05
HD
Multivariate scatter plot correlation and clustering engine analytical dashboard seamless loop animation
00:15
HD
Metric Constellation Connected Business Signals
00:10
HD
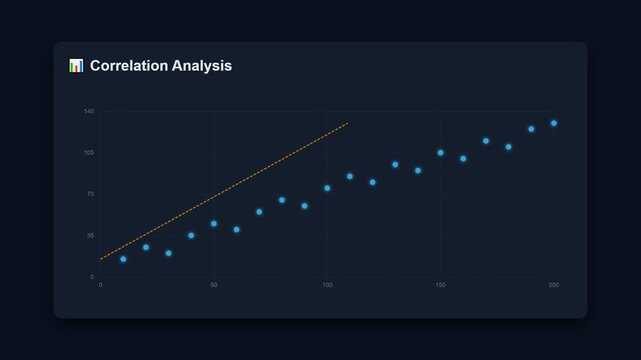
Correlation analysis scatter plot chart animation dark ui
00:10
HD
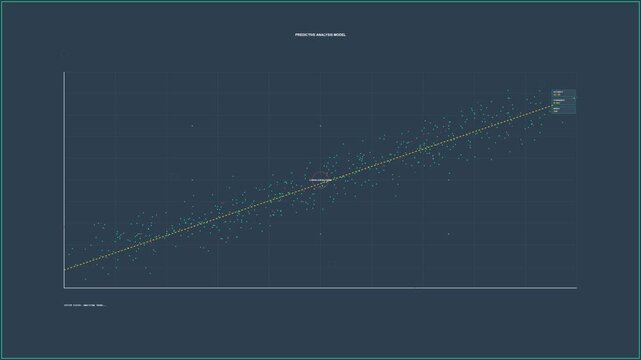
Scatter plot trend line HUD animated seamless loop alpha overlay with glowing data points and cyan neon correlation matrix
00:10
HD
Advanced digital data visualization statistical charts futuristic analytics interface. market research, financial reports, enterprise dashboards, executive presentations, forecasting business strategy
00:19
HD
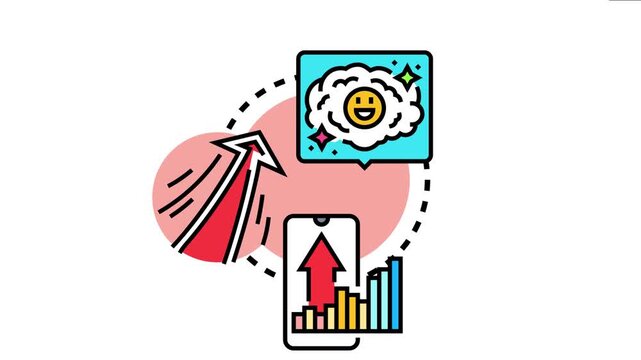
Visualizing positive correlation concepts with upward trends, smart phone data display, rising arrow, and a thought bubble showing a smiling face
00:17
HD
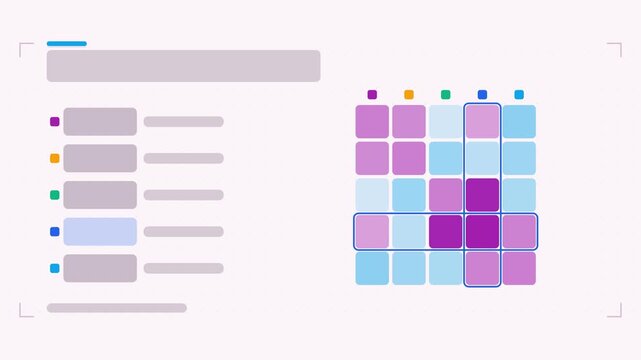
Seamless 4K looping animation of a correlation matrix infographic template with cells highlighting. Flat vector shapes, icons and grey text placeholders animate on a clean light background in purple a

00:07
HD
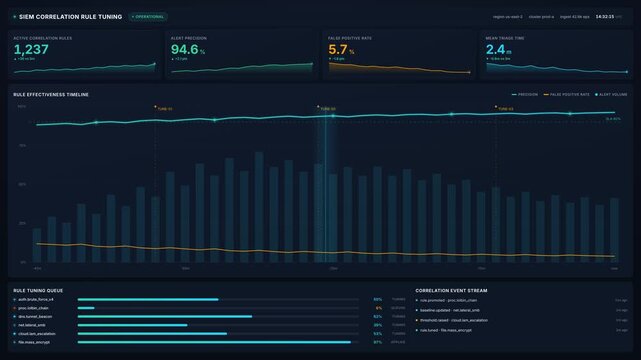
Security analyst reviewing 4k siem correlation rule tuning dashboard with live alert metrics, for cyber threat detection, data security, risk management
00:20
HD
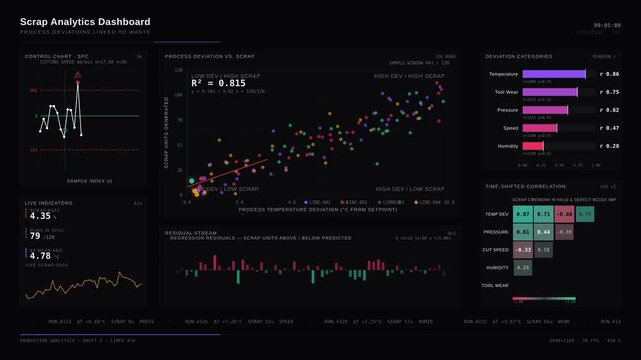
An advanced scrap analytics dashboard visualizing process deviations linked to waste through detailed scatter plots, control charts, and correlation matrices in vibrant colors.
00:15
HD
Zoomedin medium shot highlighting detailed squares of a commodity correlation matrix glowing in bright colors with the rest blurred in the background.
00:05
HD
Quantitative risk assessment displayed on a glowing digital interface showcasing complex financial correlation matrix grids with vibrant heat map nodes and abstract connection geometry
00:06
HD
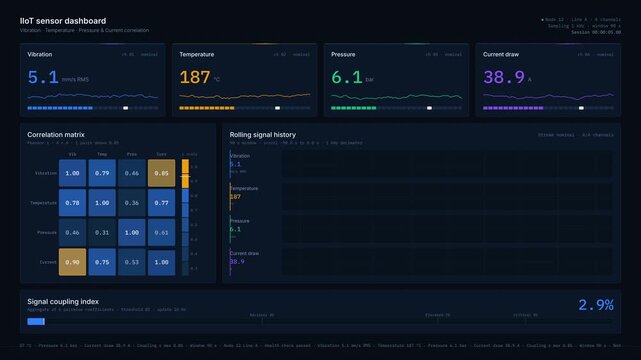
A dark-mode industrial IIoT sensor dashboard displays real-time data for vibration, temperature, pressure, and current correlation with animated visualizations and interactive elements.
00:15
HD
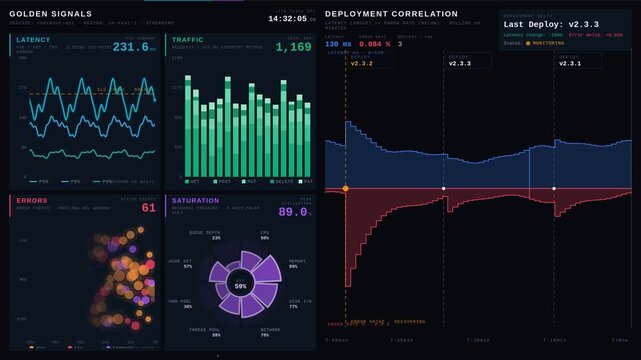
Explore a visually stunning real-time service performance dashboard designed in dark mode showcasing golden signals and deployment correlations with premium aesthetic appeal.
00:15
HD
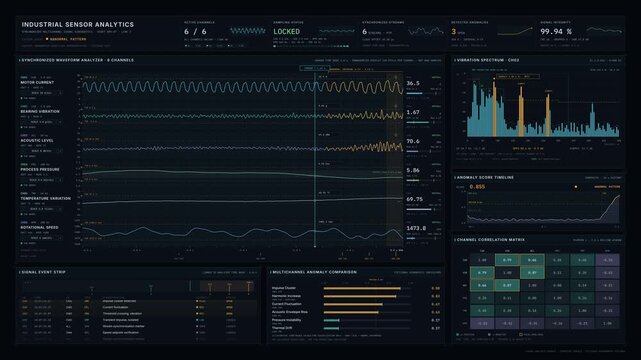
Premium industrial sensor analytics interface displaying synchronized multichannel waveforms, abnormal signal patterns, frequency spectra, and correlation matrices in a dark precision-instrument.
00:15
HD
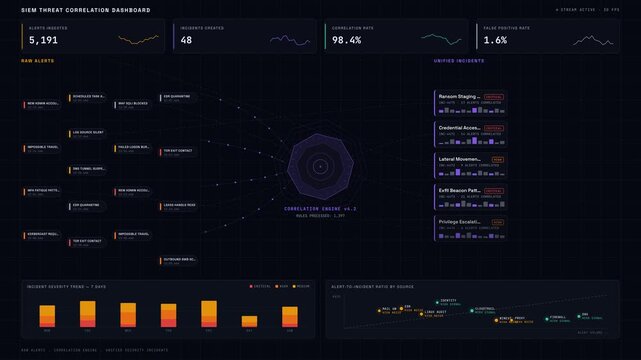
Experience a premium 4K dark-mode animation visualizing the SIEM threat correlation process, transforming raw alerts into unified security incidents with dynamic visual elements.
00:15
HD
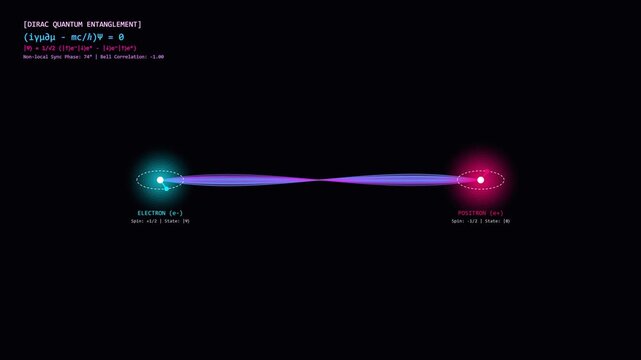
Electron Positron Quantum Entanglement Visualization with Dirac Equation and Bell Correlation
00:14
HD
A visually engaging industrial sensor data intelligence platform showcasing real-time analytics, predictive forecasting, and multi-sensor correlation on a sleek digital interface.
00:15
HD
A creative representation of a robotic hand pointing at a rising graph, illustrating technological advancements in business analytics and future growth potential. Copula
00:10
HD
A scatter plot visualization displaying data correlation on a dark background
00:10
HD
Data analysis software, statistical tools, research presentations. Visual representation of interconnected data points with adjustable correlation threshold.
00:10
HD
Dotted Scatter Plot Rising Along Trend Lines
00:08
HD
Animated Scatter Plot Showing Data Points Forming a Downward Curve on a Graph.
00:12
HD
Quantum Entanglement Visualized - A Journey into the Subatomic World.
00:08
HD
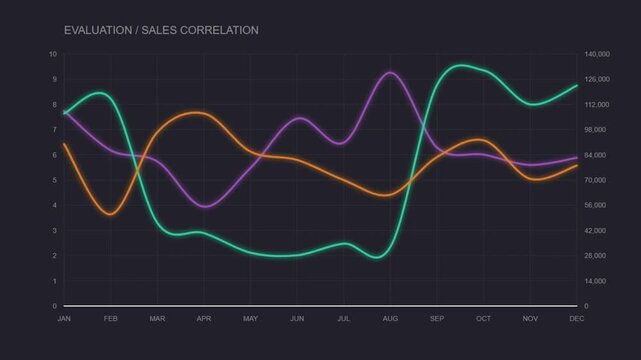
Dynamic Business Performance Chart Illustrating Evaluation and Sales Correlation Trends Over a Twelve-Month Period, Visualizing Key Metrics and Market Dynamics on a Dark Background
00:10
HD
Turquoise point-cloud wave reacting to data pulse, undulating and shifting dots to visualize trends
00:12
HD
Demonstrating the correlation between lgbtq pride, community support, and preserving mental health, reduced stress and enhanced emotional well being through inclusive environments
00:17
HD
Seamless 4K looping finance animation: rolling correlation grid smooth wave. Flat vector trading terminal with grid, axis ticks and blank readout cards in teal and cyan on a deep dark background, leav
00:07
HD
Abstract Finance Correlation Matrix Wave Cascade Animation
00:06
HD
A scatter plot showing a negative correlation between two numerical variables
00:10
HD
Zoomedin medium shot highlighting detailed squares of a commodity correlation matrix glowing in bright colors with the rest blurred in the background.
00:07
HD
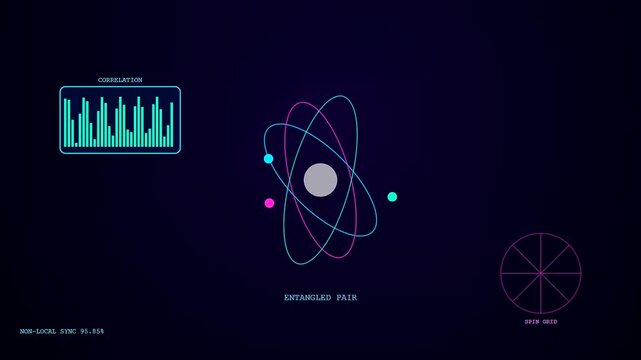
Three neon colored atomic models representing quantum cryptography displays moving across a dark digital interface to show data correlation and spinning orbits in synchronized patterns
00:06
HD
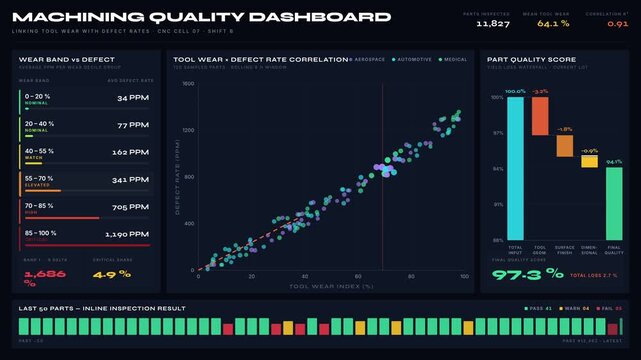
Analyze the Machining Quality Dashboard that links Tool Wear with Defect Rates using a dual-variable correlation chart and detailed data visualizations.
00:15
HD
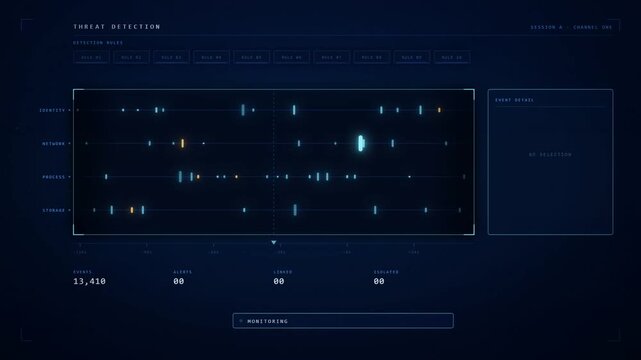
Cybersecurity threat detection dashboard animation with anomaly alert correlation and containment
00:20
HD
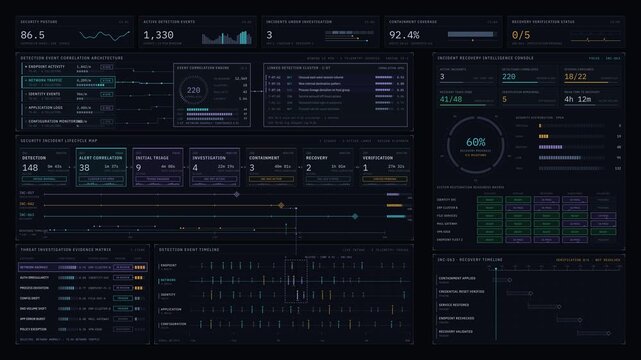
Sophisticated cybersecurity SOC dashboard animation tracking incident lifecycle stages from detection to recovery with correlated telemetry data and status indicators.
00:15
HD
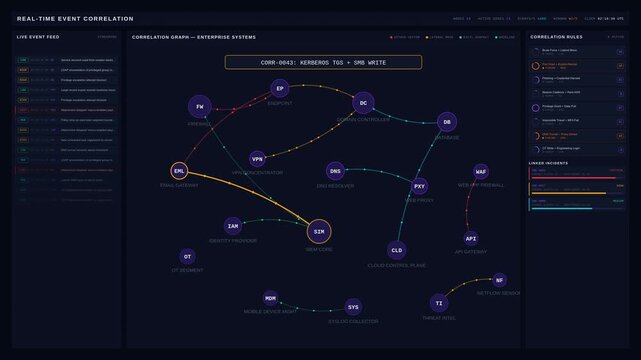
Cinematic 4K real-time event correlation dashboard showing suspicious activity connections across enterprise security systems with animated node graph.
00:15
HD
Electron Positron Quantum Entanglement Visualization with Dirac Equation and Bell Correlation
00:14
HD
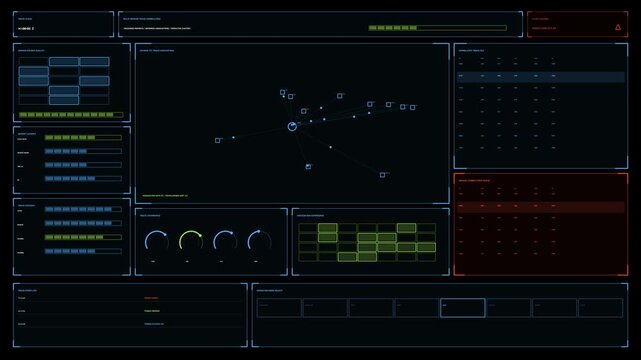
Military intelligence interface for defense explainer, showing a central multi sensor track correlation map, blue green monitoring panels and red alert queues. Animation loops seamlessly
00:30
HD
Modern Technology in Predictive Modeling with Hands on Laptop Surrounded by Data Visualizations and Graphical Elements. Asymptotic smart data analytic.
00:20
HD
Quantum Electron Lattice Glowing with Strange Correlation Energy
00:05
HD
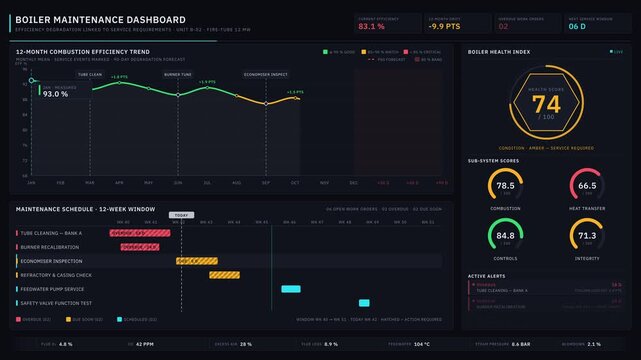
Explore the advanced boiler maintenance dashboard showcasing efficiency degradation linked to service requirements, featuring dynamic charts and predictive analytics in dark mode.
00:15
HD
Correlation Strength Visualization: Animated Scatter Plot Dynamics
00:05
HD
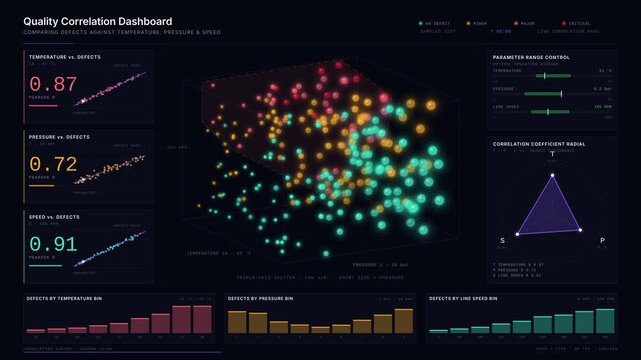
Explore a comprehensive Quality Correlation Dashboard showcasing defects against temperature, pressure, and speed with stunning 3D scatter plots and vibrant color coding.
00:15
HD
Quantum Entanglement Visualized - A Journey into the Subatomic World.
00:08
HD
Digital data correlation scatter plot with glowing points
00:10
HD
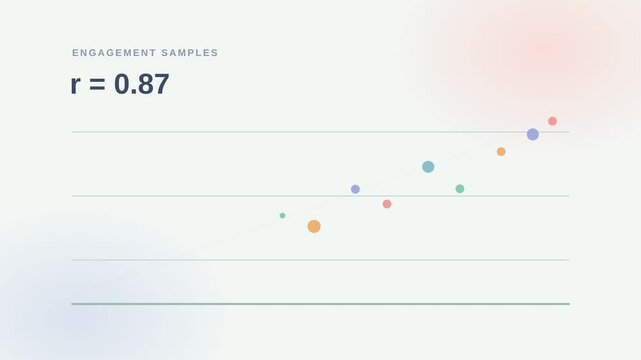
Dynamic motion of a scatter plot with a trend line illustrating high correlation in animated data visualization.
00:10
HD
Negative correlation analysis a declining trend in data points from a scatter plot, impacting human interaction and health results, emphasizing risk and statistical research
00:17
HD
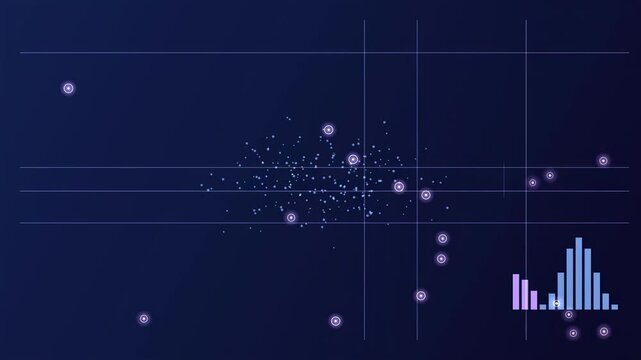
Scatterplot displays data points, histogram shows distribution. Blue tones dominate, creating abstract visualization.
00:07
HD
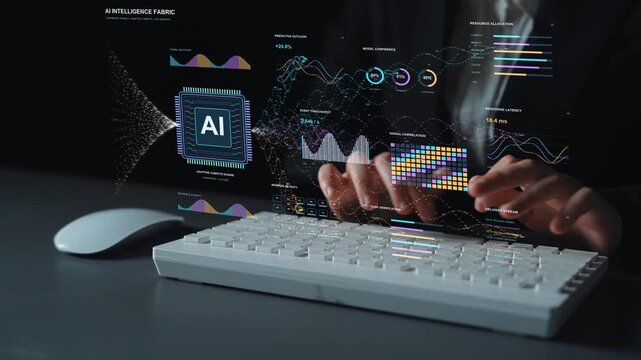
AI specialist works at a keyboard. Forecasts, correlations and workload measurements provide complementary views of an AI system, linking analytical interpretation with computing activity.
00:10
HD
Animated correlation matrix of bubbles with alpha channel
00:10
HD
Focused view of a vibrant heatmap displaying diverse commodity correlations capturing the intensity of price relationship patterns on a digital monitor.
00:05
HD
Loop Interactive Market Rotation Dashboard Showing Sector Flow
00:15
HD
Industrial data dashboard showcasing correlated equipment signals and maintenance events with vibrant color-coded visualizations and analytical insights for effective monitoring.
00:15
HD
Predictive Analytics Scatter Plot Regression Analysis Motion Graphic
00:10
HD
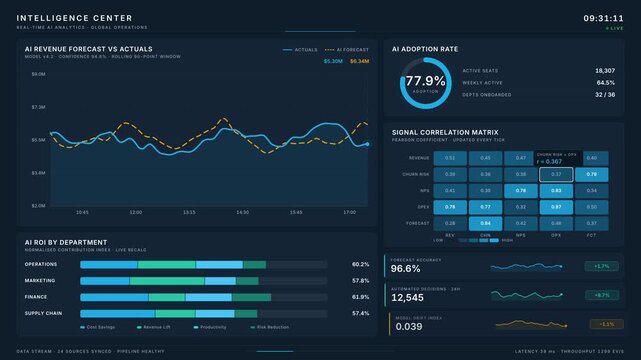
Premium 4K dark-mode AI business intelligence dashboard with live analytics, animated charts, and real-time data visualizations in an intelligent center interface.
00:15
HD
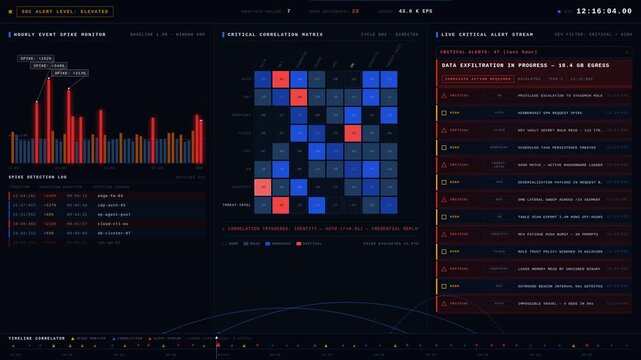
Experience the dynamic energy of a dark-mode SOC Log Analytics interface showcasing hourly event spikes and critical correlations during a live cyber threat investigation.
00:15
HD
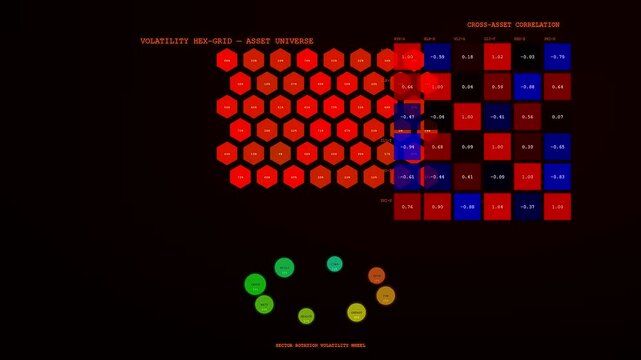
A digital market volatility index display showing red hexagons and a correlation matrix grid changing shapes in a dark environment with green circles appearing below
00:06
HD
Grey and white neural layers on a dark field. Statistical modelling, regression analysis and data science
00:10
HD
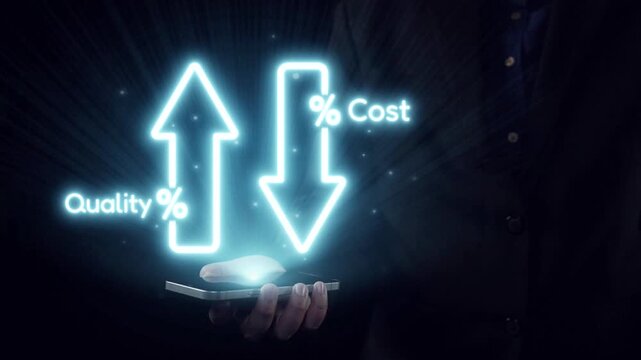
A dynamic image illustrating the correlation between increasing quality and decreasing costs in business. It showcases a glowing mouse held in hand, symbolizing technology-driven solutions. Qubit
00:14
HD
Analysis pattern detection HUD with glowing green scattered particle
00:08
HD
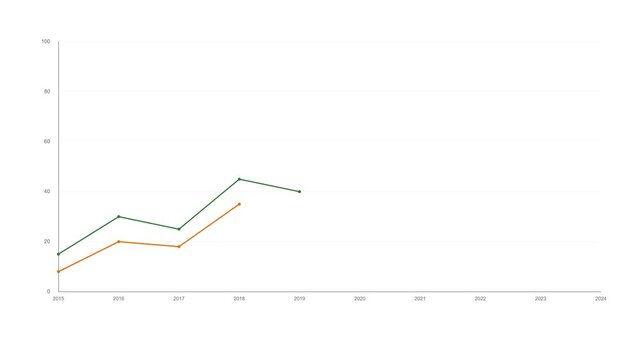
Comparative dual-line chart showing yearly financial value trends, business analytics style
00:15
HD
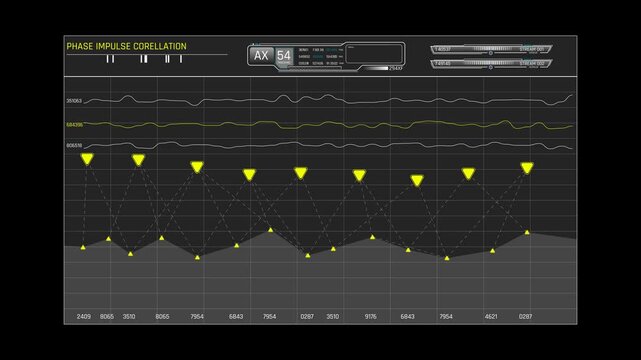
Futuristic Sci Fi HUD Phase Impulse Correlation Graph with Waveforms and Telemetry Display
00:20
HD
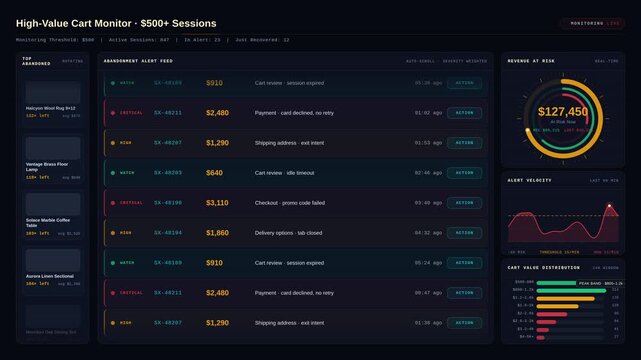
Explore a detailed shopping cart analytics dashboard that compares product discounts and abandonment patterns with vibrant color coding and data visualizations for insights.
00:15
HD
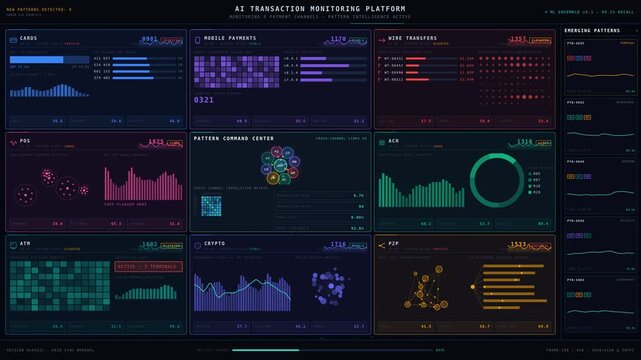
Explore the advanced AI transaction monitoring platform visualizing emerging fraud patterns across diverse payment channels with a sleek, multi-channel intelligence layout.
00:15
HD
White ceramic cup of capuccino coffee decrated with creamy plane art standing on a table with a smartphone as business concept and flights correlation
00:10
HD
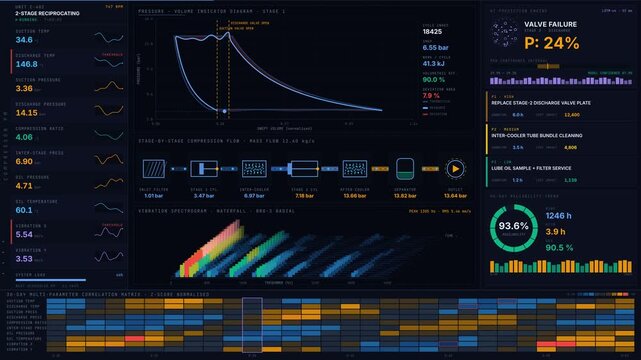
Explore a sophisticated compressor predictive maintenance dashboard featuring dark industrial aesthetics with animated charts, real-time data, and AI prediction cards for efficient monitoring.
00:15
HD
One to one equivalence concept equal connections between elements, symbolizing matching, pairing, and mutual correlation in various family, business, or data structures
00:17
HD
Abstract animated correlation matrix cells highlighting clusters drawn as cyan and teal lines and shapes on a deep dark background. Seamless looping 4K motion graphics video with free space for text,
00:07
HD
Model performance is examined through accuracy, precision and recall alongside forecasts, resource load and data quality in an integrated AI analysis workflow.
00:12
HD
Dot particle infographic morphs scatter plot into histogram, donut chart, funnel and world map dashboard
00:15
HD
A magnified of a brain showing the gradual shrinkage of neurons and its correlation to cognitive decline in old age.
00:07
HD
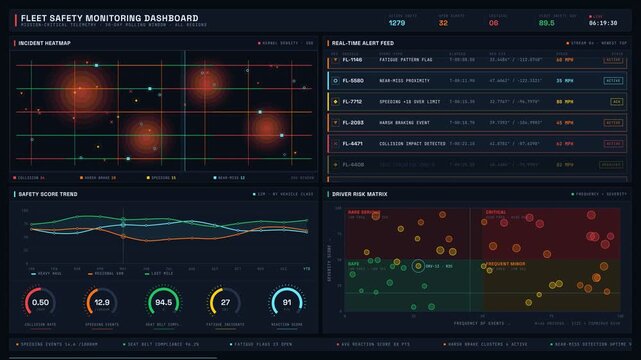
A detailed fleet safety monitoring dashboard interface showcasing incident heatmaps, real-time alerts, and driver risk metrics in a dark, urgent visual style with vibrant color coding.
00:15
HD
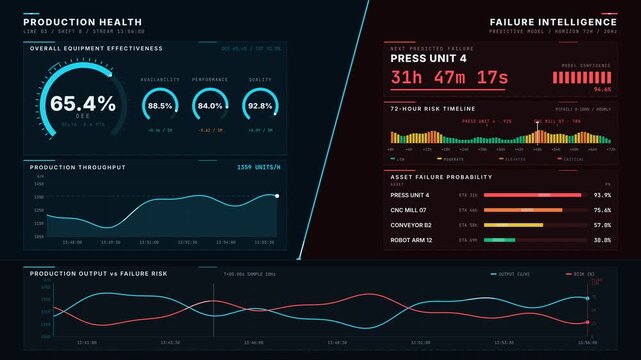
Explore a sleek smart manufacturing dashboard that displays real-time production health metrics alongside predictive failure forecasts in an innovative split-interface design.
00:15
HD
Scatter Plot Regression Analysis Chart Seamless Loop
00:15
HD
Scatter plot points converging to trend line animation
00:08
HD
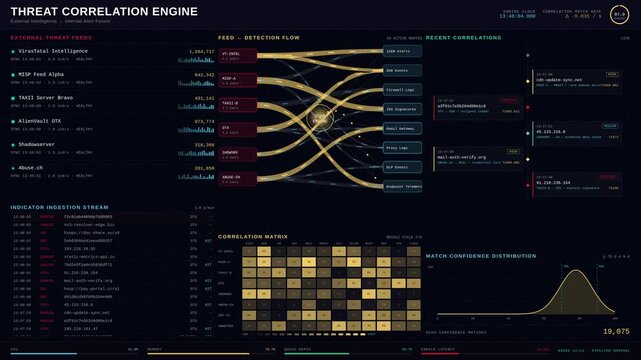
A sophisticated threat intelligence platform visualizes the correlation between external indicators and internal security alerts, showcasing live data analytics with vibrant colors and engaging.
00:15
HD
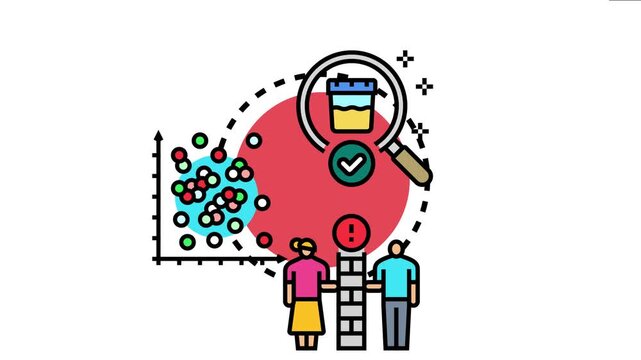
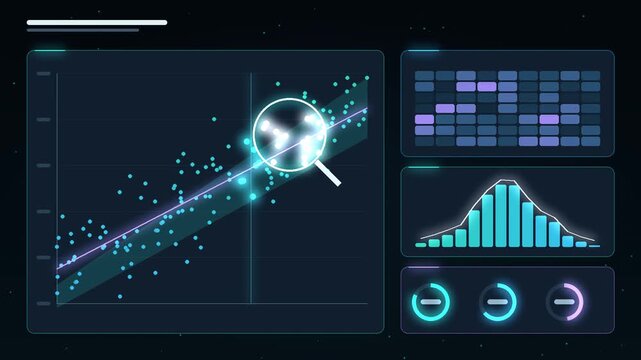
Research data analysis motion graphics, scatter plot with regression trend line and magnifying glass scanning data points, heatmap, histogram and progress rings, scientific statistics dashboard, text
00:12
HD
Event correlation Words Related to Hacking HiTech Backgrounds
00:09
HD
Complex patterns of medical data are illustrated through vibrant colors and dynamic shapes, revealing correlations that support research and decision-making in healthcare systems.
00:10
HD
Dark Trade Monitoring Dashboard For Time Series
00:15
HD
Abstract scatter plot graphic representing data analysis and growth.
00:05
HD
Businesswoman illustrating the correlation between global trade, investment, and economic growth by drawing a connection between a globe icon, a money bag, and a rising graph on a transparent board
00:10
HD
Explore a cinematic 4K energy trading analytics dashboard featuring dynamic charts, real-time data, and a premium trading terminal aesthetic with vibrant color accents.
00:15
HD
CPU, trendy processor. Motherboard. Computer chip with correlation and signals ,PCB Sci-fi chic cyberpunk graphic elements global network of CPU Technology Concept on black background.
00:10
HD