Ein Link zum Festlegen deines Kennworts wurde gesendet an: Um in Zukunft auf deine Käufe zugreifen zu können, benötigst du ein Kennwort.
Erhalte 10 Stock-Bilder mit einer kostenlosen Testversion.
Neue Filter hinzugefügt
Sortieren nach

966.963 Ergebnisse für video caption in „alle“

314.847 Ergebnisse in Video
mogrt Minimal Editorial Typography - Professional minimal editorial text animation with clean modern layouts for fashion promos, cinematic intros and branded videos
Business team discussing financial charts and data on a digital tablet during a meeting in a modern office corporate strategy, and teamwork.
00:19
HD
AI SEO assistant data, Financial growth stock market business chart green arrow success investment profit digital graph upward trend economy business growth chart financial
00:08
HD
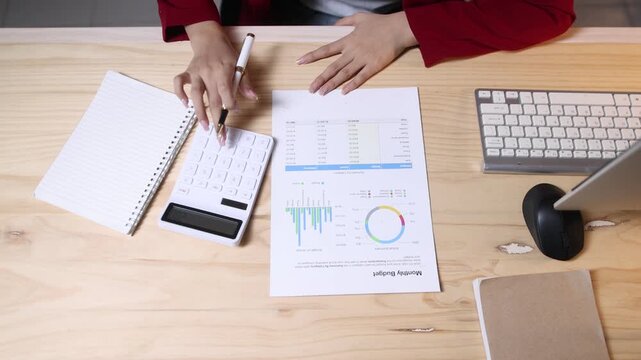
Female professional accountant conducting detailed financial analysis, meticulously reviewing budget reports with charts and calculator on wooden workplace surface.
00:20
HD
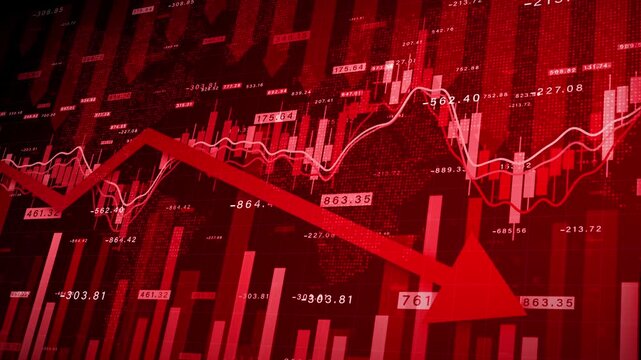
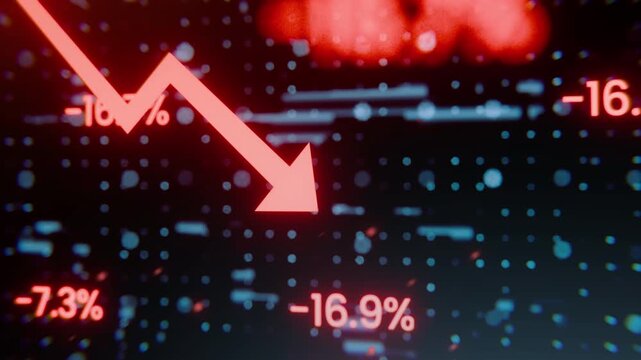
Red Stock Market Graph Animation Showing Economic Decline and Loss
00:25
HD
A human hand reaches out to a robotic hand, engaging with a holographic interface displaying digital data and growth metrics, symbolizing collaboration between technology and business. Copula
00:10
HD
aet Colorful Title

YouTube Video Player Interface HUD Animation with Play Pause, Volume, Captions, Settings, Theater and Fullscreen Controls on Green Screen
00:30
HD
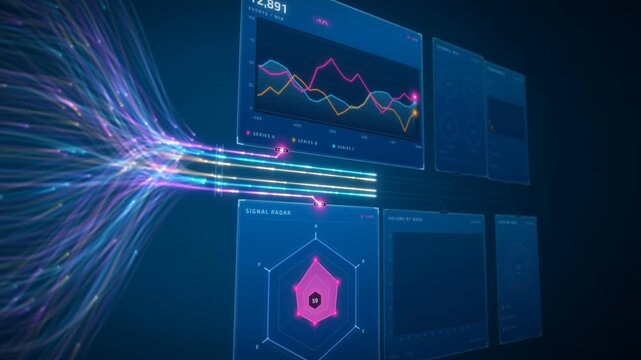
Data flow streams converging into a live analytics dashboard with radar chart, bar graphs and system load
00:16
HD
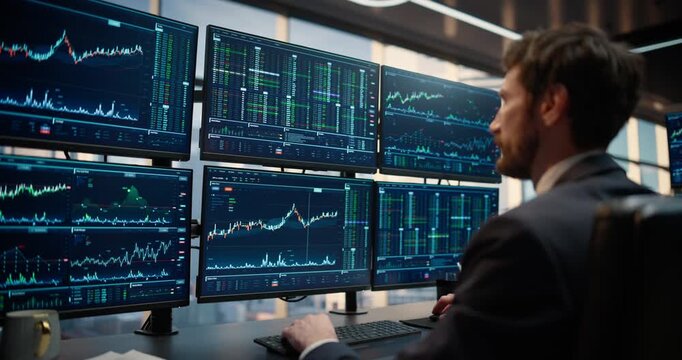
Slow Dolly-in Through a Stock Exchange Asset Management Firm, Where a Stockbroker Ceo Studies Live Charts, Weighing Banking Decisions, Strategy and Capital Growth for Corporate Career Success
00:13
HD
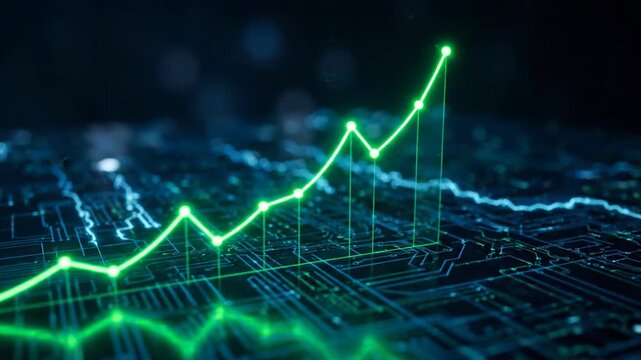
AI SEO assistant data, Futuristic digital finance growth chart data analysis technology background neon green glowing line graph stock market business success trend
00:06
HD
Rising financial chart across a glowing digital grid for market analysis. Financial presentations, investment analysis, and trading platform promotion.
00:10
HD
Agentic ai multi agent collaboration workflow diagram with data input process analysis and auto optimize concept for future technology modern office
00:08
HD
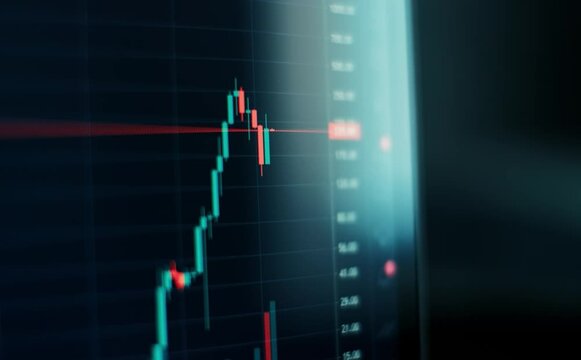
Stock Market Chart, Beautiful 3d Animation of Japanese Candlestick Graph in Time Lapse. Seamless Looping Ultra HD 4K 3840x2160
00:30
HD
Hand-drawn animated angled speech bubble in white outline on chroma key green screen background, perfect for adding your creative text, dialogue, and comic-style captions to dynamic footage.
00:05
HD
mogrt Motion Text | Minimalist Clean Typography Modern Stylish Titles Lower Thirds

aet Clean Lower Third Title
Abstract digital arrow pointing upwards, representing growth and progress in the future
00:08
HD
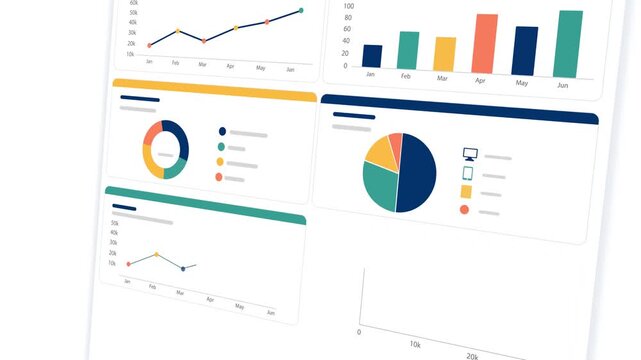
Modern Business Analytics Dashboard Animation with Multiple Data Visualization Panels like Charts, Graphs,  KPI Widgets, And Financial Statistics In A Clean Flat Design. Professional Website Metrics
00:49
HD
Red professional video camera silhouette icon with red record dot on black background animation
00:10
HD
Abstract stock market digital display showing green and red financial data, trading indices and stock price fluctuation charts
00:10
HD
Vintage silent movie caption cards. Set of vintage silent movie frame caption cards with old film effects and scratches. 5 sets vintage ornate frame styles. 4k video
00:50
HD
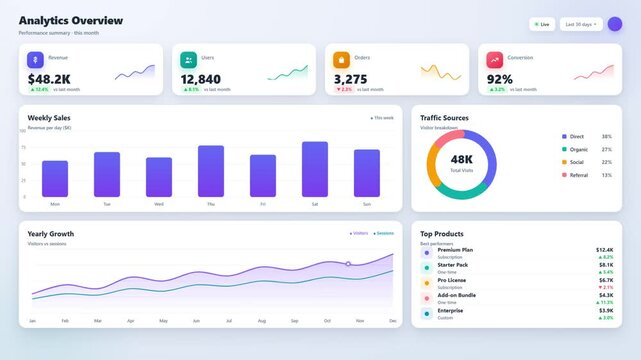
Analytics dashboard interface showing revenue charts user metrics and traffic data visualization
00:10
HD
A person is using a laptop to view financial charts and graphs. The screen displays various data visualizations, including bar charts and pie charts.
00:08
HD
Hands typing on laptop with data charts and security icons overlay showing analysis, statistics, and technology insights in a dark modern workspace Gluon.
00:10
HD
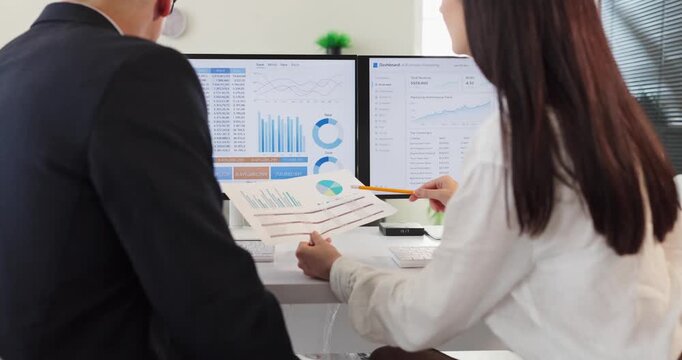
Analysts teamwork discuss finance data and dashboard. Colleagues review charts on computer screens and printouts, aligning analytics with metrics. Concept image of collaborative office analysis.
00:11
HD
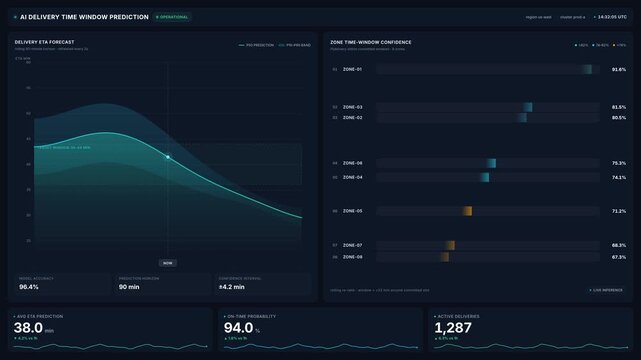
Futuristic 4k data dashboard for ai delivery time window prediction charts zone confidence metrics, for logistics optimization, supply chain analytics, automated
00:20
HD
Dynamic business foundation digital interface featuring animated infographic global corporate strategy financial growth charts, and futuristic hud technology for presentations
00:10
HD
Real time performance monitoring dashboard with animated bar charts and key business indicators.
00:11
HD
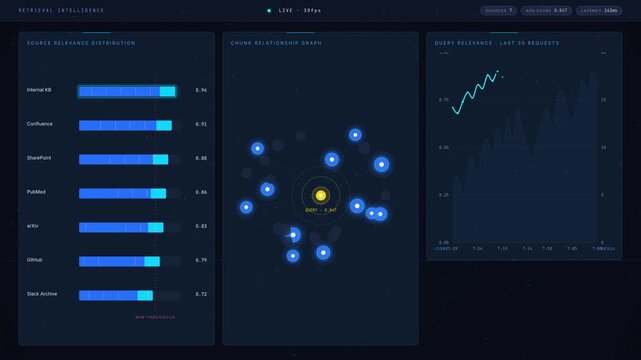
Explore a cinematic dark-mode analytics dashboard displaying relevance scores across various knowledge sources with vibrant visual elements and engaging animations.
00:15
HD
Stock Market monitor screen while open market for trading sell and buy stock online. Business economic and finance concept.
00:22
HD
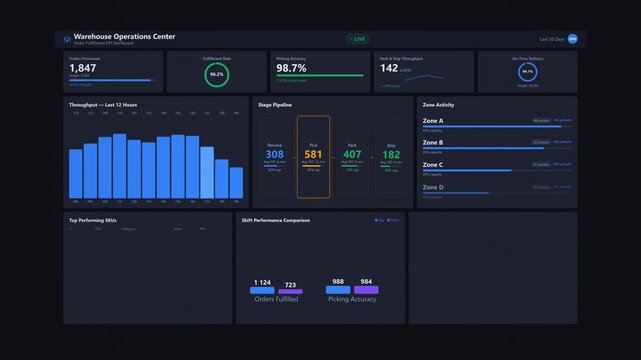
Warehouse order fulfillment dashboard: animated inventory operations tracker with pick rate metrics, shipment status breakdown and daily throughput performance visualization
00:10
HD
Abstract digital candlestick chart with global financial data background, perfect for trading, forex, crypto, and investment presentations. Financial Investment Background. 3d Rendering.
00:20
HD
Business growth concept in allusive graph chart showing marketing sales profit increasing to target . Excellent financial status of corporate business rise up.4k animation video graph
00:10
HD
Stock market candlestick chart hologram on digital world map,global financial index analysis,business economy investment.Global market analysis world map with stock market graph overlay animation
00:15
HD
Investment growth chart with rising bar graph and coins animation. Vertical video
00:06
HD
white professional video camera silhouette icon with red record dot on black background animation
00:10
HD
Animated video camera icon with blinking red recording dot on black background. Motion graphic for live stream, video camera symbol, REC indicator, media player UI, and overlay asset.
00:10
HD
mogrt Bold Pop Up Text Animation
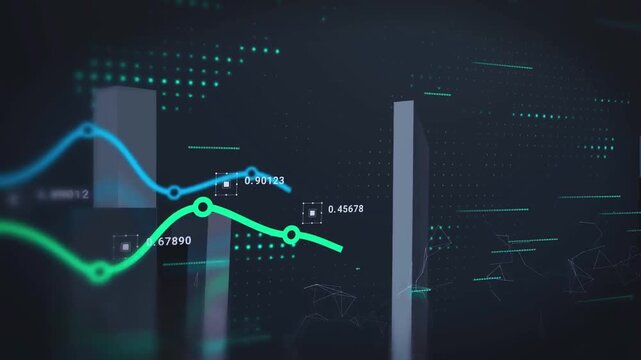
stock market chart
00:14
HD
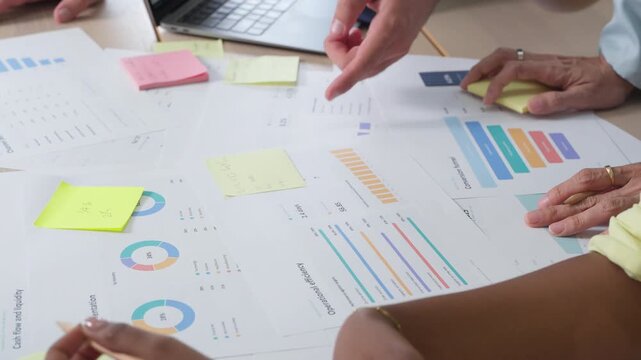
A detailed view of hands on a laptop and paperwork, colleagues collaborating over data charts in a fast-paced office meeting.
00:15
HD
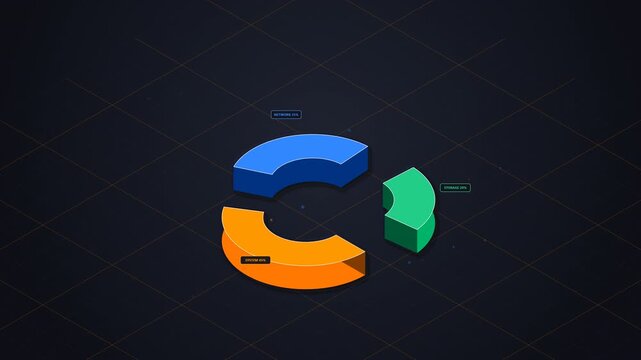
Dark neumorphic isometric dashboard featuring a 3D solid donut chart with pre-spaced segments that expand further apart with floating HUD labels in Scene 1 and clean rising 3D bar charts in Scene 2.
00:10
HD
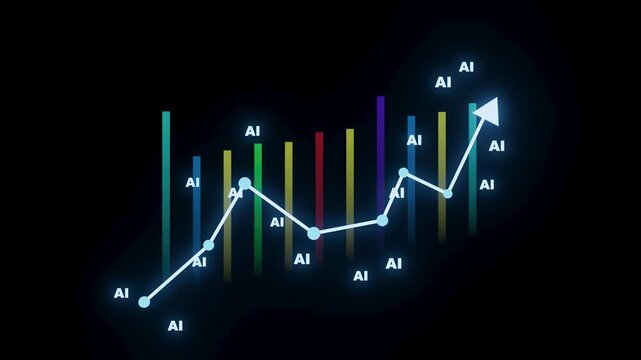
A line chart displays data trends with bars of different colors. Each bar is labeled with AI. The chart shows an upward movement over time.
00:10
HD
Financial dashboard analytics chart growth business motion graphic
00:06
HD
Seamless looped abstract visualization of financial data, price fluctuations, investment analysis and trading activity. Financial market interface with changing charts. Forex trading concept
00:10
HD
Finance growth chart graph stock market upward data analysis business abstract background with rising green line over bar graph showing market trend investment statistic concept digital chart
00:10
HD
Futuristic digital dashboard interface with financial analytics and data charts
00:10
HD
male healthcare worker takes clipboard notes beside an older man, showing one-to-one consultation, care documentation and supportive communication, also emphasizing wellbeing and assessment.
00:16
HD
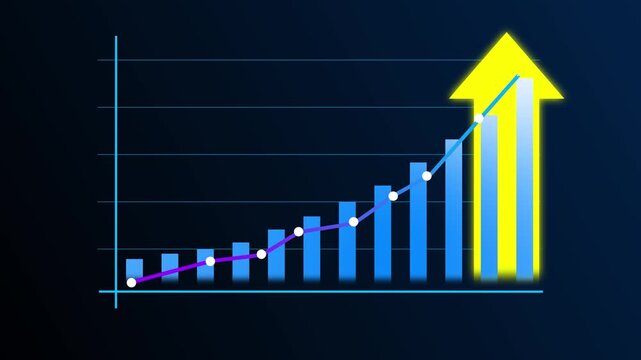
Financial graph chart, market report, arrow up trend chart stock exchange asset, diagram investment capital gain world money economic growth
00:20
HD
Financial Stock Chart Market Analysis Data Visualization financial data trends, price movement, analytics indicators. trading visuals, investment strategies, economic reports, fintech presentations.
00:20
HD
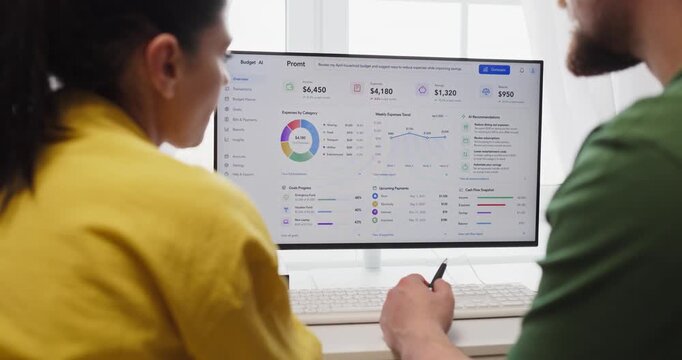
Couple budget planning on finance dashboard online. They review savings and monthly expenses on a computer at home using charts analytics for smarter choices. Clear concept of home finance teamwork
00:08
HD
prproj Corporate Text Animation
Dynamic stock market chart with candlestick patterns and real-time financial data on a digital screen ideal for illustrating investment trading and economic analysis
00:08
HD
User Analytics Hub Marketing Social Performance Dashboard with Moving Line Graph Trend and Engagement Feed Activity Stream Notification Animation
00:08
HD
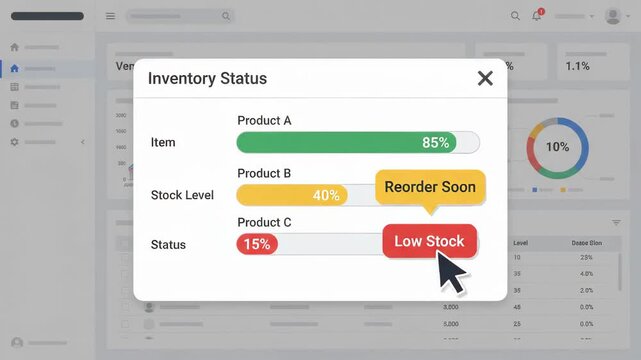
inventory status modal displays progress bars for various products on top of blurry professional business dashboard interface showing data analytics and charts
00:06
HD
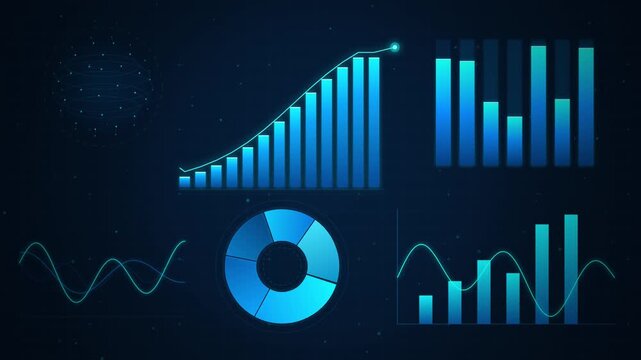
Abstract finance animation with various charts and graphs on a dark blue background.
00:10
HD
Retro video capture interface with digital timecode and pink frame overlay
00:10
HD
Digital line graph tracks upward moving corporate revenue. Interactive line graph demonstrates successful financial forecasting. Economic growth concept with corporate line graph.
00:10
HD
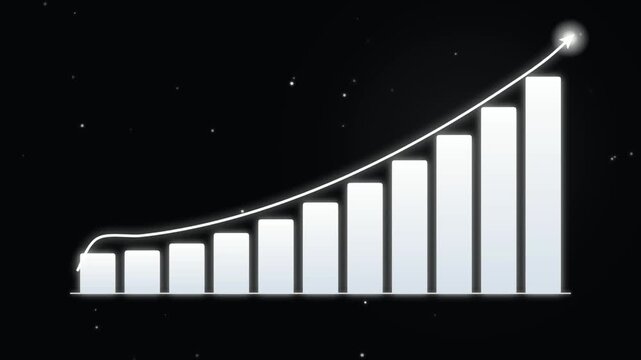
Glowing white financial bar charts rising upwards on black space
00:08
HD
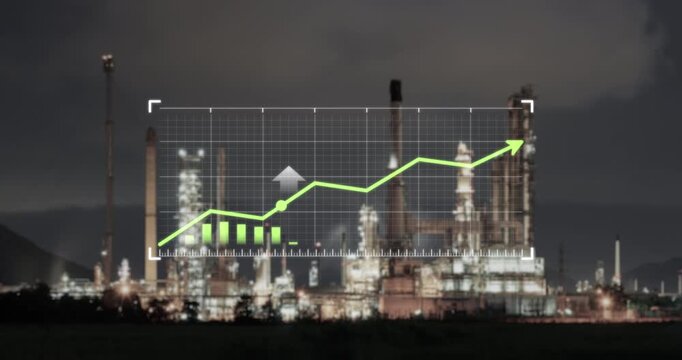
Industrial business concept with rising financial graph overlaying oil refinery plant at night. Symbolize increasing oil prices, refinery operating costs and growth in global power and energy sector.
00:18
HD
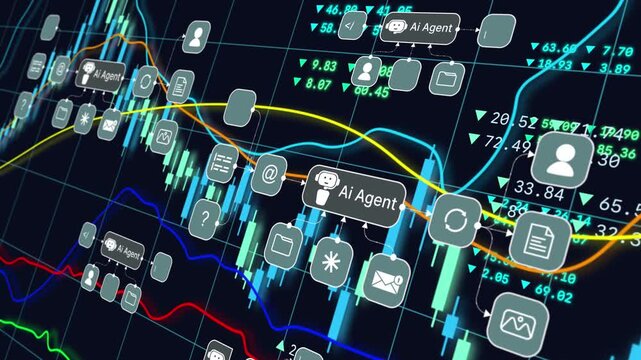
AI agent artificial intelligence stock market analysis smart trading strategy, financial investment, business growth portfolio, and futuristic automated economic concept
00:20
HD
glowing camera record icon with flashing Red dot .Camera Recording Indicator Animation REC Icon Video Capture Loop 4K animation video
00:10
HD
Wide panoramic wall of wireframe bar charts overlaid with multiple colored wave trend lines scrolling sideways
00:10
HD
Three upward stock market growth charts
00:10
HD
prproj Animated Typography
Red downward arrow symbolizing economic decline, ideal for financial reports, presentations, articles, and social media posts on negative trends.
00:08
HD
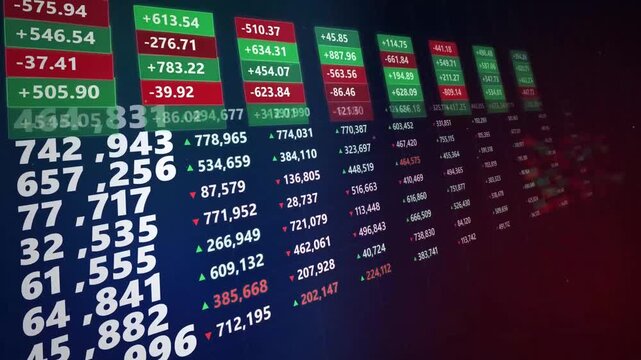
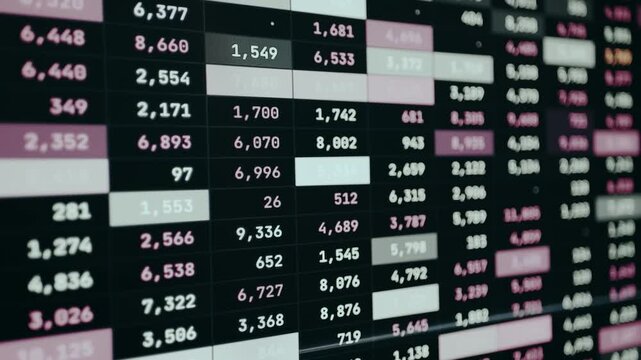
Real-time data table, monitoring screen for tracking multiple assets simultaneously
00:13
HD