Ein Link zum Festlegen deines Kennworts wurde gesendet an: Um in Zukunft auf deine Käufe zugreifen zu können, benötigst du ein Kennwort.
Erhalte 10 Stock-Bilder mit einer kostenlosen Testversion.
Neue Filter hinzugefügt
Sortieren nach

60.207 Ergebnisse für streamgraph in „alle“

9.516 Ergebnisse in Video
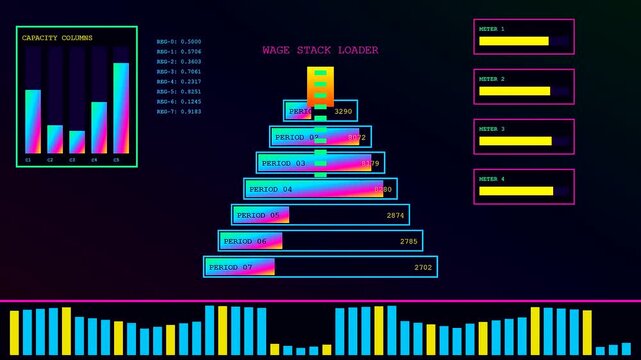
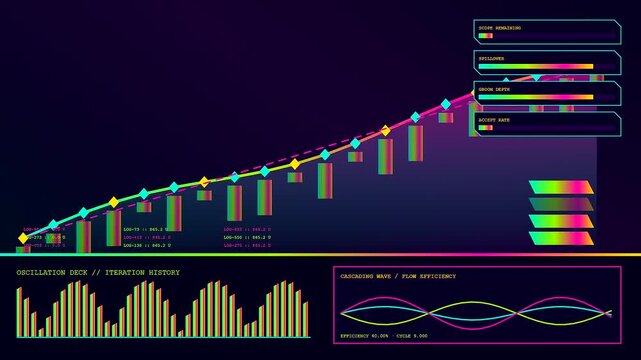
A digital wage stream display featuring glowing neon data pyramids with changing bar graphs and metrics shown on a dark screen in real time
00:06
HD
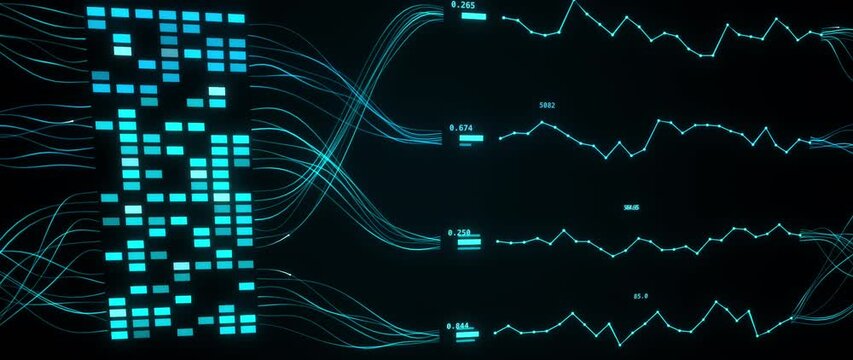
Digital analytics display fluctuating graphs and connected data streams on black
00:24
HD
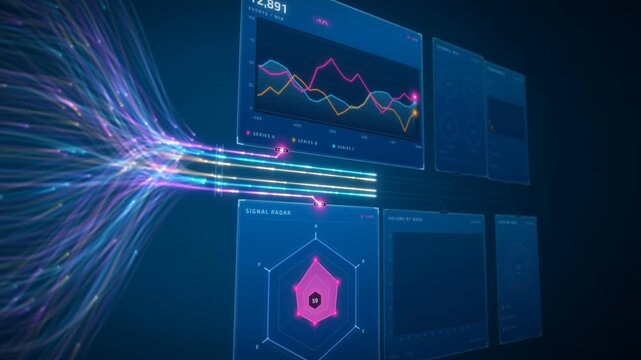
Data flow streams converging into a live analytics dashboard with radar chart, bar graphs and system load
00:16
HD
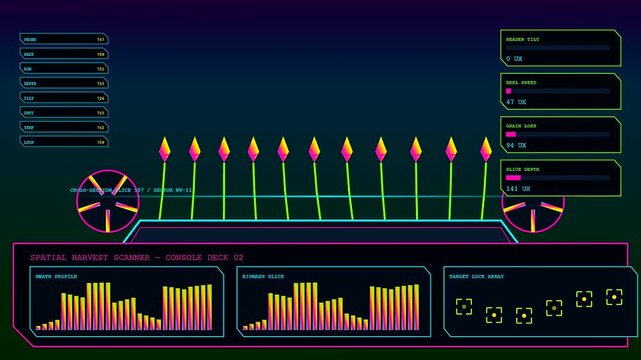
Data streaming kinetic harvesting visualization displays glowing neon waveforms with shifting frequency graphs and digital interface readouts pulsing in a synchronized sequence on a dark monitor
00:06
HD
User Analytics Hub Marketing Social Performance Dashboard with Moving Line Graph Trend and Engagement Feed Activity Stream Notification Animation
00:08
HD
Abstract digital data stream with fluctuating red and green trend lines on a dark background finance chart graph analysis
00:10
HD
Neon Digital Data Audio Waveform Visualization Loop with Glowing Circular HUD Interface Design
00:10
HD
A digital wage stream display featuring glowing bar charts with fluctuating line graphs and shifting numerical values presented in a modular three panel interface grid layout
00:06
HD
A screen displaying dynamic pricing analytics with shifting neon bar graphs and glowing data streams presented in a dark multi panel interface layout design
00:06
HD
Abstract white line audio spectrum animation with pulsing sound waves and digital frequency equalizer visualizer on dark background for streaming and podcast graphics in 4k.
00:20
HD
A digital broadcast switcher monitoring interface displays real time signal fluctuations across multiple modular frame units with neon light data graphs and animated stream pulses
00:06
HD
A digital checkout overlay interface displays abstract geometric radial circular data patterns and linear equalizer volume graphs pulsing across a dark screen in this animated display
00:06
HD
Animation of multiple charts visualizing the analysis of large amounts of data
00:14
HD
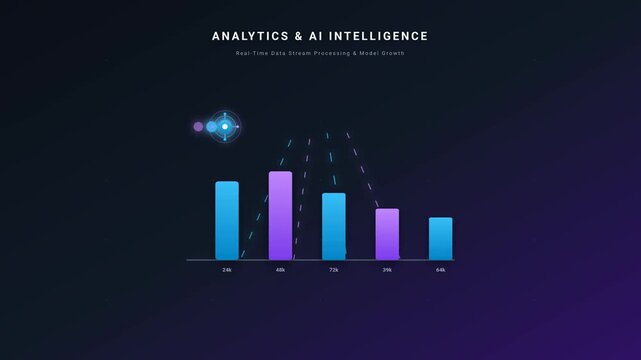
Analytics and artificial intelligence data stream processing chart showing bar graph growth in motion video footage
00:13
HD
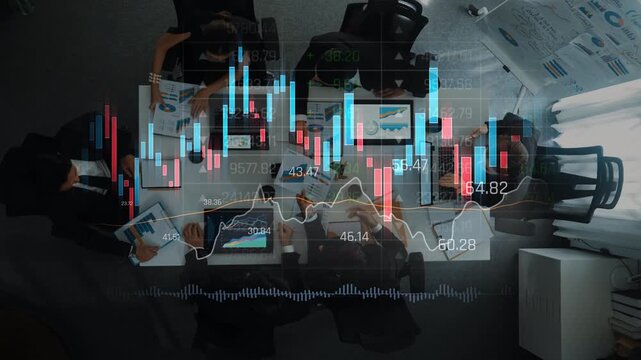
A modern office scene showcasing a diverse team engaged in a financial data analysis meeting. Charts and graphs illustrate current stock market trends and insights. Raster
00:20
HD
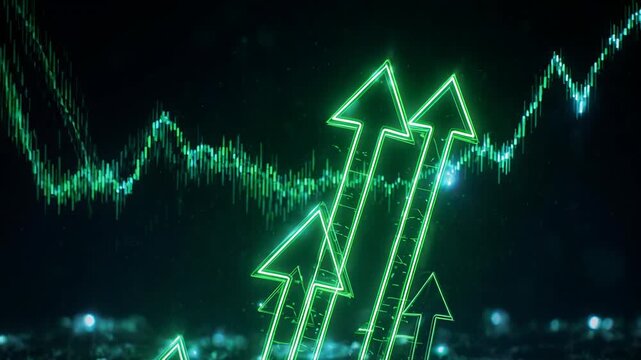
Green arrow graphs ascend over a city skyline during a financial market upswing with digital data streams
00:05
HD
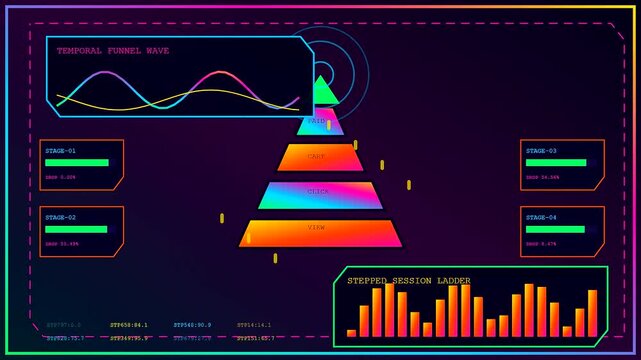
Neon wave patterns depicting stream commerce within a digital dashboard interface showing metrics and pyramid graphs in a vibrant graphical user interface animation loop sequence
00:06
HD
Digital waveforms displaying a biometric validate process shown through a stream of shifting neon light lines and bar graphs on a dark panel screen surface
00:06
HD
Bar graph design seven video source digital animation element
00:06
HD
Digital recovery analytics interface displaying shifting graph data streams within a dark environment featuring neon pink and bright green visual elements for complex system status monitoring
00:06
HD
Volumetric diagnostics display showing digital data streams with glowing line graphs and vertical bars flickering on a dark grid interface during a simulated scientific observation process
00:06
HD
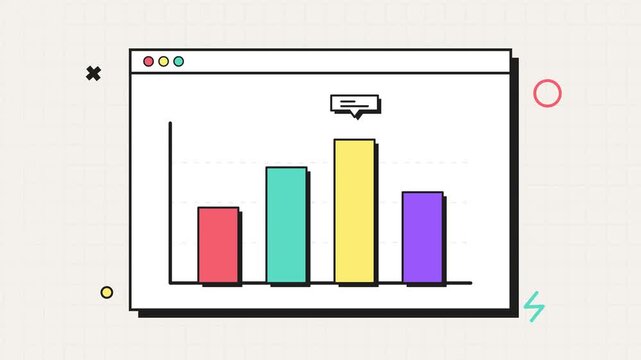
A colorful bar graph displays rising financial performance metrics within a web browser window to signify current market progress and help professionals track their annual corporate revenue
00:10
HD
An agile backlog display shows animated charts with colored line graphs and vertical bars moving across a dark digital monitor screen for project management tracking purposes
00:06
HD
Digital holographic interface displaying financial charts and data streams against a dark grid background representing technology and information flow
00:10
HD
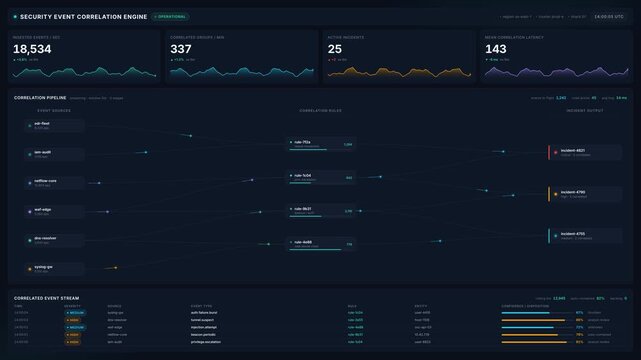
Security event correlation engine dashboard interface with live data streams incident alerts, for cyber threat monitoring, network security analysis, enterprise risk management
00:20
HD
a wage stream display showing digital production metrics with moving conveyor belts and animated graph bars changing across three distinct panels in this studio footage
00:06
HD
Bar graph design two video source digital animation element
00:06
HD
Abstract digital data visualization showing modern business analytics and progress graphs
00:10
HD
Neon data stream HUD with glowing cyan and orange line graphs scrolling on dark screen, live numbers and percentages changing
00:12
HD
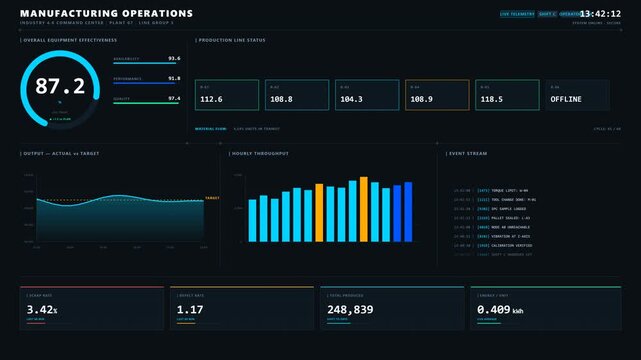
High-tech digital dashboard for Industry 4.0 manufacturing operations, displaying live OEE, production line status, throughput charts, and event stream telemetry.
00:10
HD
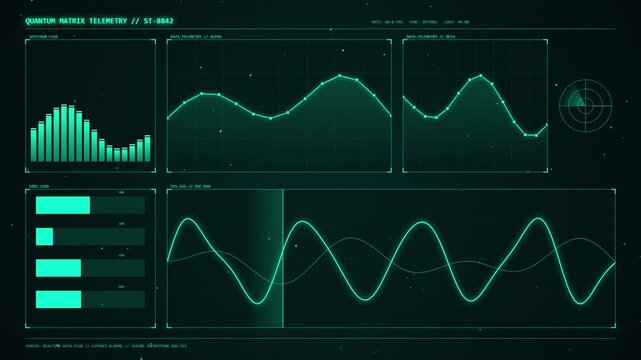
Futuristic quantum matrix telemetry interface showing glowing green data and graphs.
00:10
HD
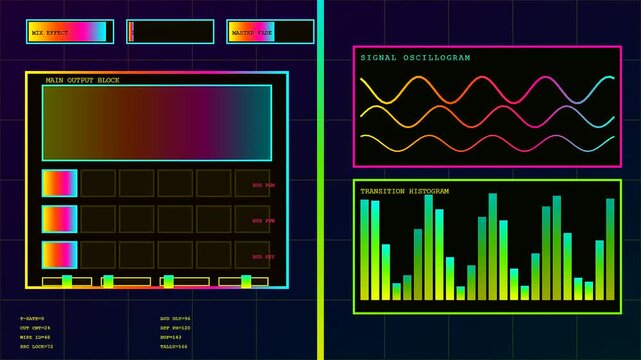
A digital broadcast switcher interface displays vibrant waveform oscillograms and frequency spectrum graphs across six distinct panels to monitor audio levels and visual signal processing streams
00:06
HD
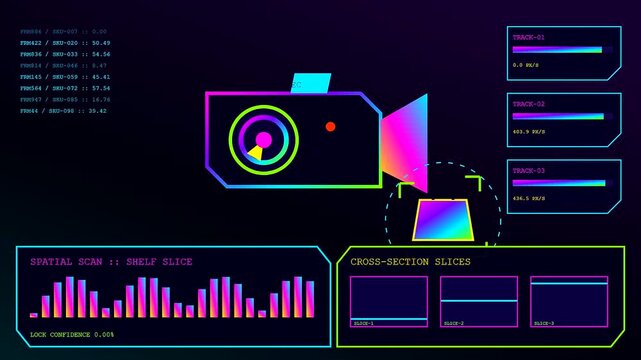
A digital stream commerce interface displays animated scanning graphs with vibrant colorful light bars and neon outlines monitoring retail product items on a dark virtual display
00:06
HD
Abstract futuristic digital technology concept with glowing cyan wave lines and data streams
00:12
HD
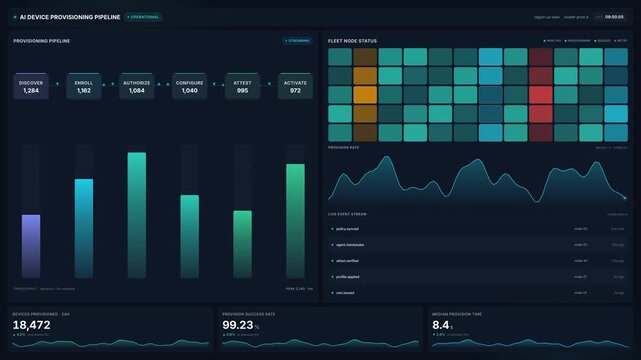
Futuristic ai device provisioning pipeline dashboard for fleet node status, streaming metrics, success rate charts in 4k, for cloud automation data monitoring
00:20
HD
The ai integration process displays dynamic data streams with colorful bars and shifting wave graphs across multiple panel sequences showing systematic updates in dark environment
00:06
HD
A wage stream data interface displays flickering genetic helix structures with glowing circular nodes and analytical bar graphs presented across a dark neon digital display panel
00:06
HD
Abstract Blue and Purple Wave Line Graph Animation, Data Visualization, Futuristic Technology
00:10
HD
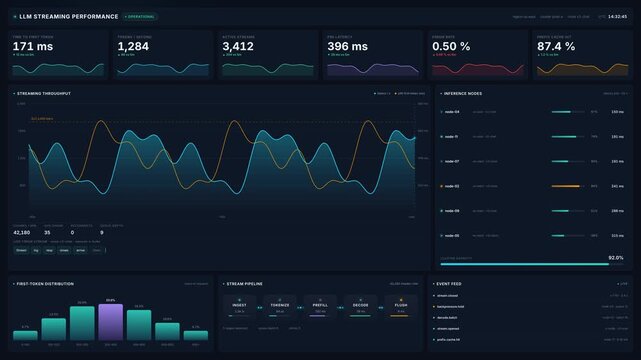
Dashboard with live llm streaming performance metrics server statistics, for data analysis, artificial intelligence monitoring, software development, cloud computing
00:20
HD
Digital data stream graph animation in futuristic interface
00:15
HD
White waveform visualizer animation, audio frequency spectrum bars, digital equalizer graph motion, voice recording signal wave, black screen isolated background, seamless loop, ultra hd 4k.
00:20
HD
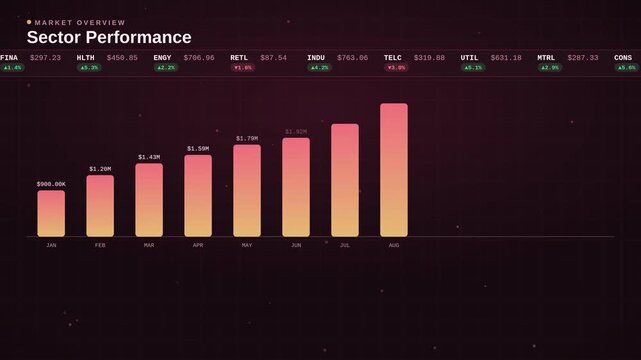
4K data report bar graph with rising rose columns and bottom ticker stream, technology presentation animation
00:15
HD
Digital data stream with hexadecimal codes and graphs representing network traffic and system performance
00:20
HD
A rising cryptocurrency graph showing a steady upward trend. The chart indicates a significant increase in value with the current price displayed prominently
00:10
HD
A vibrant stream commerce display shows digital analytics with neon line graphs and bar charts floating in space on a dark screen interface for monitor viewing
00:06
HD