Ein Link zum Festlegen deines Kennworts wurde gesendet an: Um in Zukunft auf deine Käufe zugreifen zu können, benötigst du ein Kennwort.
Erhalte 10 Stock-Bilder mit einer kostenlosen Testversion.

Neue Filter hinzugefügt
Sortieren nach

100.426 Ergebnisse für interface statistic vector in „alle“

4.791 Ergebnisse in Video
Dynamic 2d vector user interface dashboard with tactical hud elements and morphing charts
00:10
HD
Digital dashboard interface with animated data visualization charts and energy monitoring metrics
00:10
HD
Circular Progress Bar Graphic Featuring Twenty Five Percent Completion Indicator for User Interface
00:08
HD
futuristic ai automation dashboard interface with data analytics charts and progress indicators in red
00:09
HD
Percentage shows sixty six percent inside a circular progress ring graphic accompanied by a green upward arrow indicating positive performance growth rate.
00:10
HD
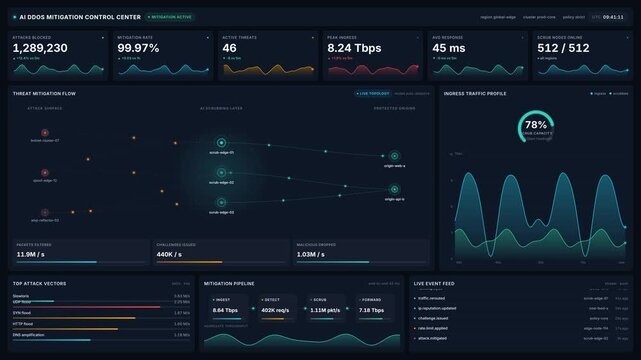
Advanced ai ddos mitigation control center dashboard for live threat neutralization, traffic graphs, attack vectors, for cybersecurity, network monitoring, system protection
00:20
HD
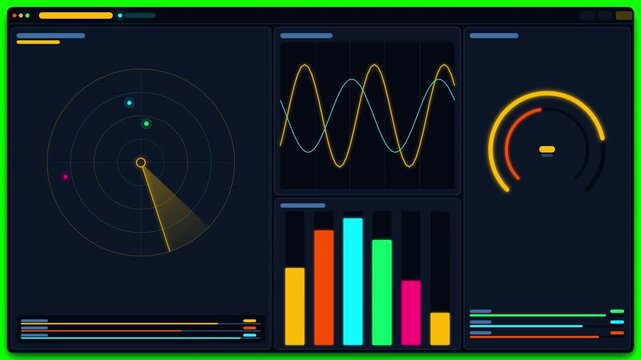
Data analytics dashboard panels on chroma key green background
00:12
HD
Futuristic HUD interface animation with morphing data charts and vector panels
00:10
HD
Set of glowing blue neon data charts and digital info graphs with futuristic interface elements
00:10
HD
Modern abstract bar chart interface on dark blue background
00:12
HD
Modern UI vector animation displaying dashboard analytics interface with interactive charts and search magnifying glass graphic
00:11
HD
Futuristic digital dashboard interface displaying green vector charts
00:10
HD
Digital displays showing an agile backlog provide a neon interface for tracking progress across multiple data tiers in a sleek modern software monitoring system
00:06
HD
dynamic data visualization interface featuring bar charts and interactive infographics for business intelligence analysis, dashboard monitoring, reporting, financial metrics, performance tracking
00:09
HD
A digital collaboration invite expands as network nodes emerge from a central profile icon on a dark monitor display with changing analytical data panels below
00:06
HD
User Analytics Hub Marketing Social Performance Dashboard with Moving Line Graph Trend and Engagement Feed Activity Stream Notification Animation
00:08
HD
Digital HUD interface with animated charts and data visualization
00:10
HD
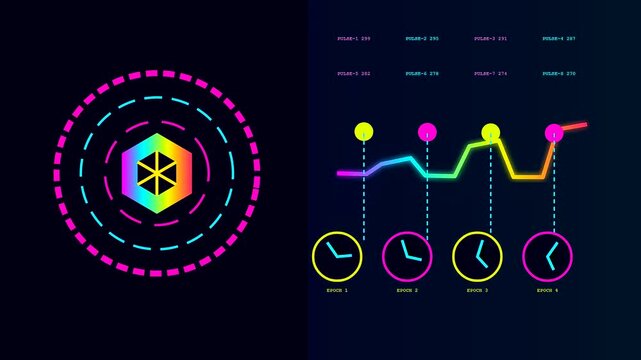
Data flow lines showing blockchain tracking with floating hexagonal symbols and glowing interface elements changing values over time in a vibrant digital monitor display screen environment
00:06
HD
Digital HUD interface with connected data nodes and analytics charts
00:10
HD
Financial growth dashboard interface with line graph and chart analytics vector illustration concept
00:10
HD
Pressure gauge needle rising to maximum capacity
00:15
HD
Digital data flow and data transfer animation with ui interface nodes
00:06
HD
Digital fundraising goal progress circle with amount displayed
00:12
HD
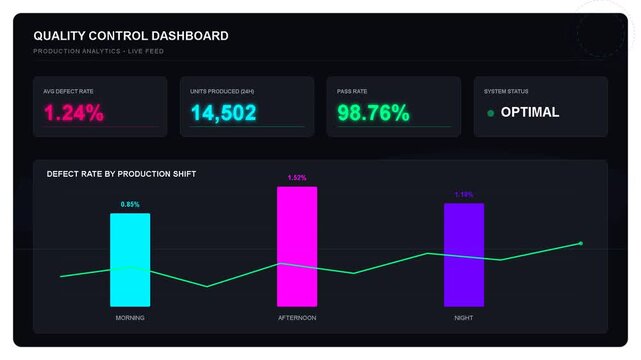
Digital data dashboard interface with neon bar charts and line graphs showing performance metrics and statistical progress analysis
00:08
HD
A fluid stream commerce visual interface features digital graphical charts displaying changing numerical values within a dark frame setup for rapid data processing and analytical monitoring
00:06
HD
Catastrophe mapping display shows complex scientific data metrics for celestial object impact trajectory analysis on a dark glowing interface screen with multiple dynamic analytical interface panels
00:06
HD
Futuristic digital HUD interface showing analytical data and graphs
00:10
HD
Digital hud dashboard interface with data visualization charts
00:12
HD