Ein Link zum Festlegen deines Kennworts wurde gesendet an: Um in Zukunft auf deine Käufe zugreifen zu können, benötigst du ein Kennwort.
Erhalte 10 Stock-Bilder mit einer kostenlosen Testversion.
Neue Filter hinzugefügt
Sortieren nach

21.625 Ergebnisse für grid system tracking in „alle“

8.556 Ergebnisse in Video
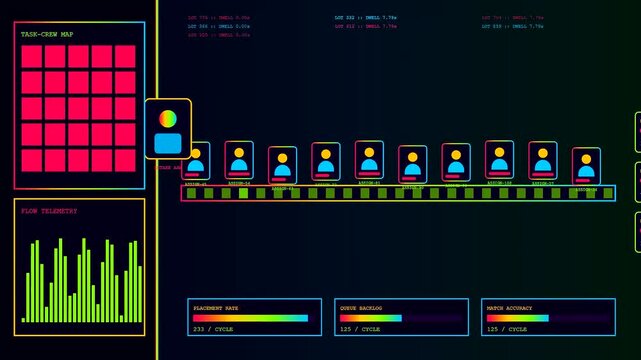
Digital displays showing staffing allocation metrics with grid patterns and personnel icons in a complex interface for monitoring human labor capacity and dynamic workflow performance tracking
00:06
HD
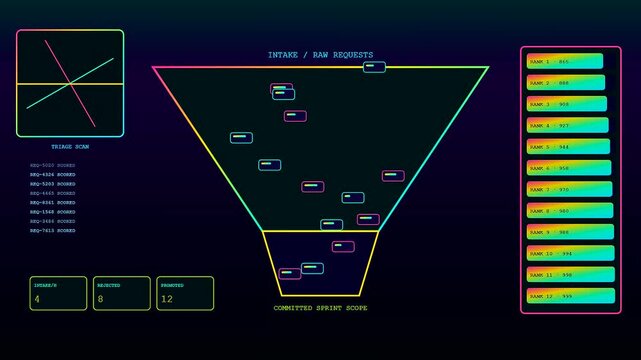
A digital agile backlog interface shows complex data visualization with neon geometric shapes and abstract information funnels glowing against a dark screen monitor panel display
00:06
HD
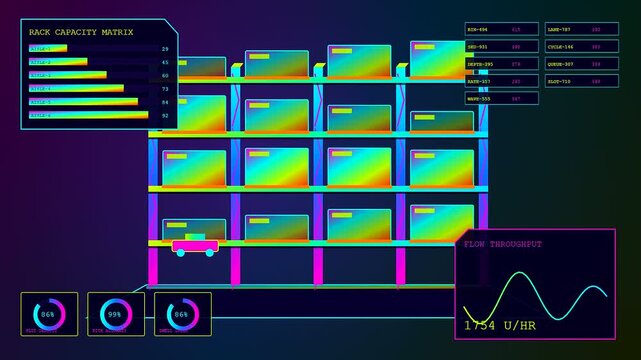
Digital warehouse optimization interface showing glowing shelf storage metrics and dynamic flow throughput charts on a dark virtual display depicting modern inventory management systems in action
00:06
HD
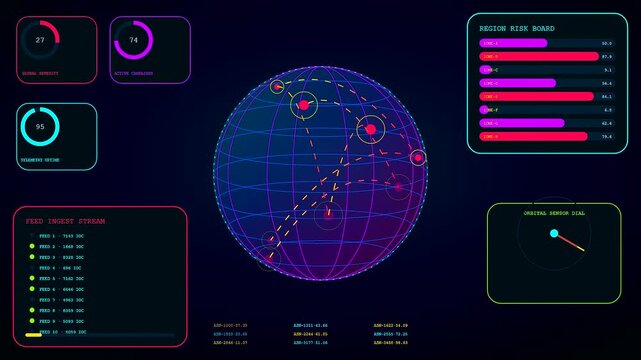
Threat intelligence interface displaying rotating global spheres with glowing data nodes and tracking lines across a dark digital panel showing various statistical charts and metrics
00:06
HD
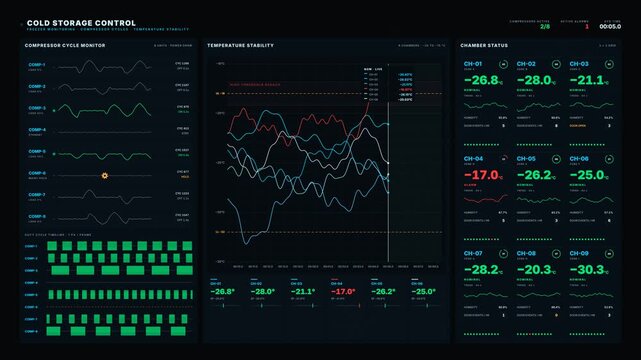
Clinical cold-storage control room interface displaying freezer monitoring dashboard, compressor cycle waveforms, and real-time temperature stability charts in cryo-blue.
00:15
HD
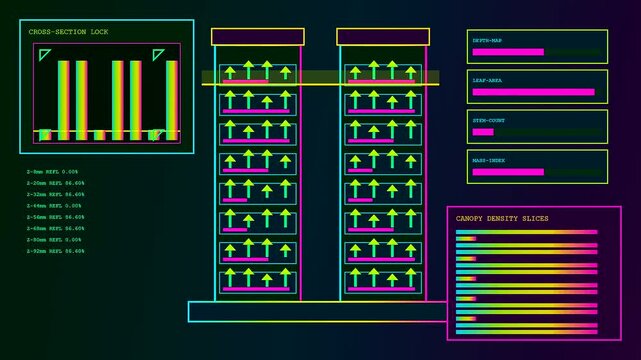
Digital displays showing vertical agritech monitoring system progress with glowing arrows and fluctuating data graphs on dark screen interface panels for agricultural research and plant growth
00:06
HD
Blue radar sonar interface scanning with rotating sweep line over dotted world map background
00:10
HD
Rectangle radar sweeping and detecting interface animation. Futuristic digital radar interface data detection technology.
00:14
HD
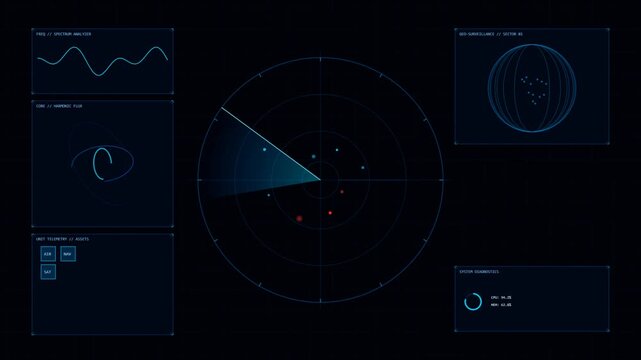
Digital radar interface with scanning beam and data charts on dark
00:10
HD
A digital blockchain tracking display shows neon glowing document icons with data bars and status markers in a dark purple interface for information monitoring software
00:06
HD
Displaying servers telemetry tracking active network connections on a global sphere interface with flickering data nodes and dynamic frequency line charts across a dark purple monitor
00:06
HD
A digital vulnerability scan interface shows glowing circular radar nodes with fluctuating wave form charts and changing data sequences across three synchronized dark computer display screens
00:06
HD
A digital bioinformatics interface shows rhythmic glowing data lines and colorful bar charts fluctuating on a dark screen during a complex genomic laboratory research session
00:06
HD
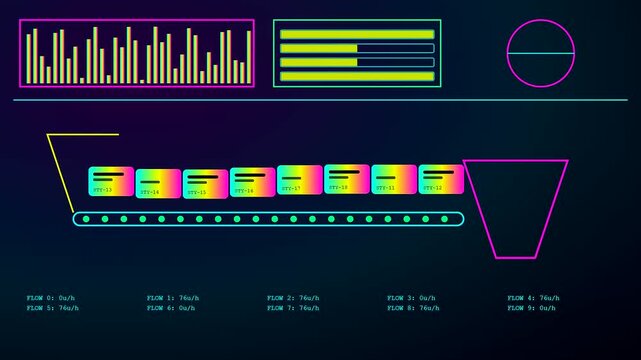
Monitoring an agile backlog through a digital tracking interface showing colorful task cards moving along a conveyor belt in a simulated automated factory production flow system
00:06
HD
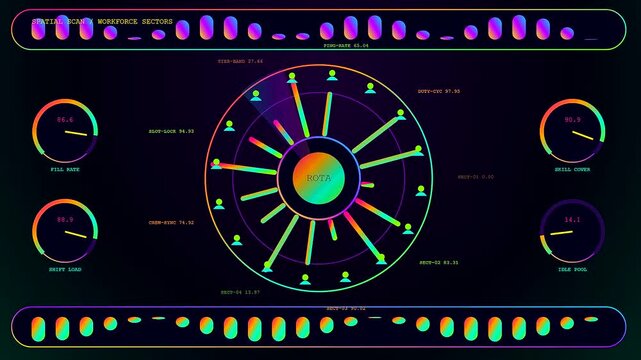
Three panel screens showing staffing allocation data visualized with neon circular gradients and radial graphs glowing against a dark digital grid monitor for corporate analytics
00:06
HD
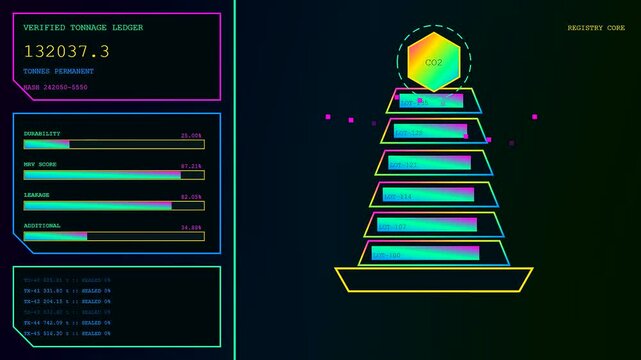
Digital carbon capture tracking interfaces display complex environmental metrics via glowing geometric charts and neon tiered graphs presented on a dark screen in this animation
00:06
HD
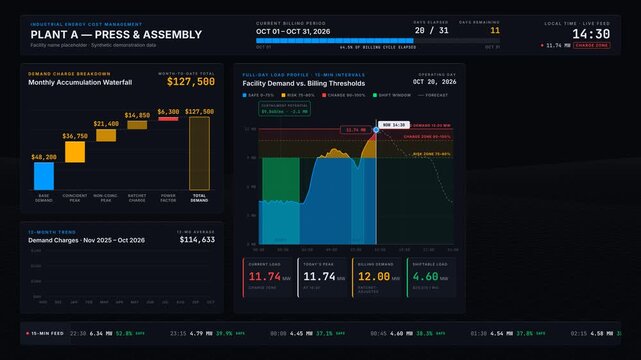
Industrial energy dashboard visualizing demand charges and load scheduling opportunities with animated charts and data metrics for commercial creative technology and business use.
00:15
HD
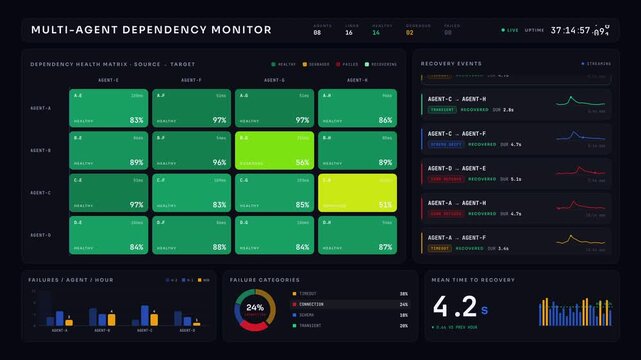
Cinematic 4K multi-agent dependency monitoring dashboard featuring real-time failure tracking, recovery timeline, and analytics charts with electric blue and crimson accents on a dark background.
00:15
HD
Vulnerability scanning charts and glowing system metrics appear on a dark interface representing complex digital monitoring tools used in modern data security analytics and network traffic tracking
00:06
HD
Futuristic digital dashboard interface with radar scan, data metrics, stock charts, technology analysis, and system monitoring
00:07
HD
Manufacturing quality operations dashboard showing exception tracking, corrective action workflows, Pareto charts, and inspection heatmaps in dark industrial style.
00:15
HD
A digital staffing allocation system displays various user avatars and shift trends on a dark monitor screen featuring bright neon graphs for personnel tracking
00:06
HD
4K smart grid dashboard with animated network topology map, real-time loss reduction gauges, and glowing data metrics on dark slate background for energy control.
00:15
HD
Futuristic Exoplanet Surface Scanner HUD Interface Display Scanning Alien World Digital Hologram
00:10
HD
Real time energy performance tracking technology visualizes power consumption data from a meter, utilizing a cyclical process and analytical charts for efficient management and optimization
00:17
HD
4K Solar farm dashboard visualization tracking panel output, weather conditions, and energy production data with dynamic charts and isometric view. for commercial creative technology and business use.
00:15
HD
Data science analytical line chart with drift detection threshold for monitoring system performance a digital analytics interface displays a visualizing and metrics for software tracking
00:10
HD
Green futuristic tactical radar interface displaying aircraft targets a digital screen rendered in showing aerial and tracking data within a grid system hud monitor aviation flight
00:10
HD
Digital displays showing warehouse optimization logistics management systems with vibrant neon charts and data streams moving across a dark screen interface for automated industrial control monitoring
00:06
HD
A digital community garden harvest display features animated isometric plots with glowing neon metrics across three sequential screens showing agricultural data updates in a dark environment
00:06
HD
Ev navigation interface scanning and tracking data on dark grid
00:10
HD
Digital vitals monitoring interface displays biological data flow via complex branching pathways with glowing nodes and color changing metrics across three side by side system screens
00:06
HD
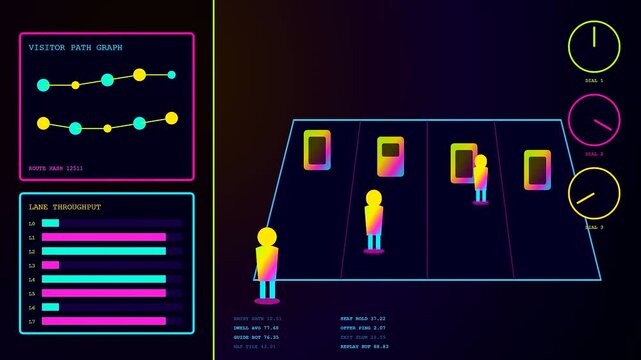
A digital virtual showroom interface displays tracking metrics for visitor movement patterns across an interactive store layout with neon glow graphics and animated flow statistics
00:06
HD
Radar scanning animation with rotating detection signal interface. Modern radar scanning system for surveillance monitoring and tracking. Digital radar scanning interface for navigation
00:11
HD
Digital displays showing warehouse optimization metrics with glowing wave charts and inventory tracking grids within a modular monitoring interface for real time logistics control and analytics
00:06
HD
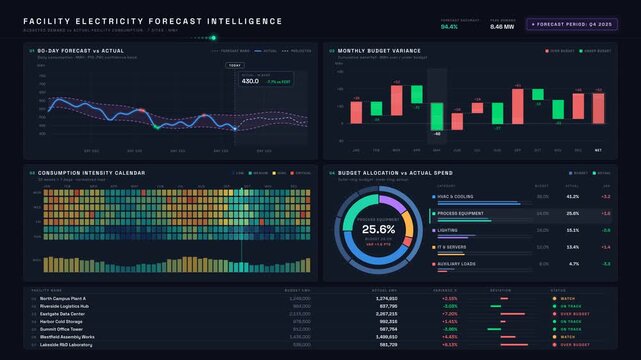
Premium 4K electricity forecast dashboard comparing budgeted demand and actual facility consumption with animated charts, heatmap, and variance tables on dark background.
00:15
HD