Ein Link zum Festlegen deines Kennworts wurde gesendet an: Um in Zukunft auf deine Käufe zugreifen zu können, benötigst du ein Kennwort.
Erhalte 10 Stock-Bilder mit einer kostenlosen Testversion.
Neue Filter hinzugefügt
Sortieren nach

170.899 Ergebnisse für compare chart in „alle“

13.901 Ergebnisse in Video
indt Comparison Infographic Presentation Template, Business Slide Deck with Data Charts, Product & Feature Comparisons, Pricing Tables and Performance Analysis
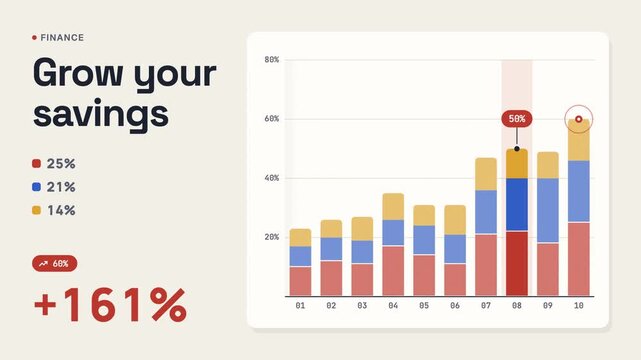
Three finance panels pair savings figures with stacked bar charts, while colored segments and percentage labels compare values across ten numbered intervals
00:10
HD
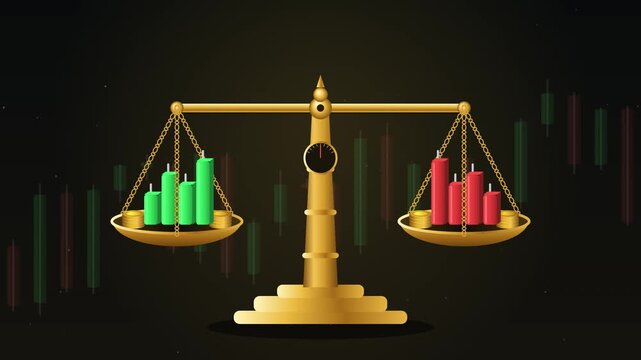
Golden balance scale weighing green and red candlestick charts for financial market risk analysis
00:10
HD
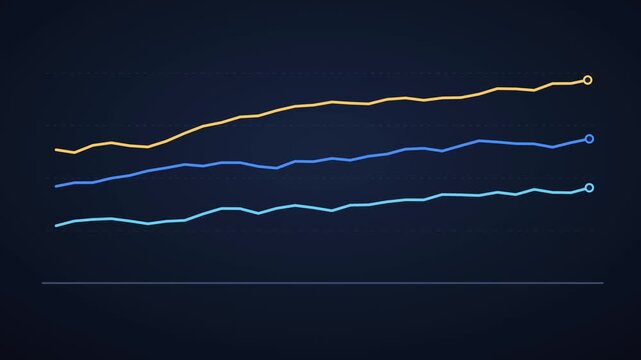
Three trend lines drawing in sequence for multi series comparison
00:12
HD
ait Comparison Infographic Presentation Template, Business Slide Deck with Data Charts, Product & Feature Comparisons, Pricing Tables and Performance Analysis
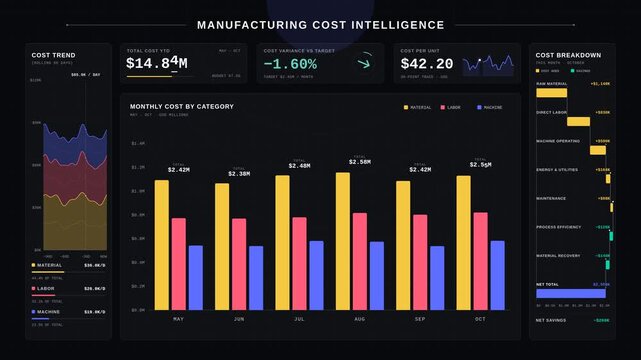
Executive manufacturing cost dashboard comparing material labor and machine operating expenses with animated bar charts and KPI metrics on dark background.
00:15
HD
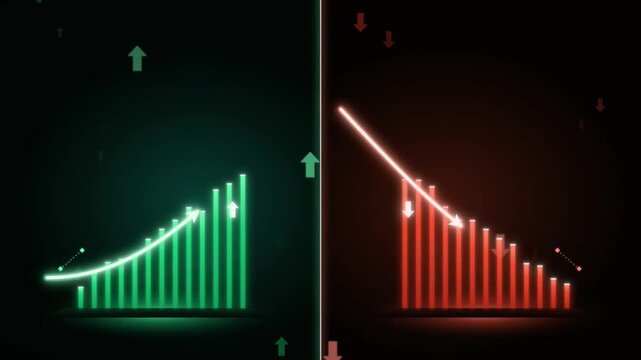
Split screen financial comparison animation with green growth and red decline bar charts
00:15
HD
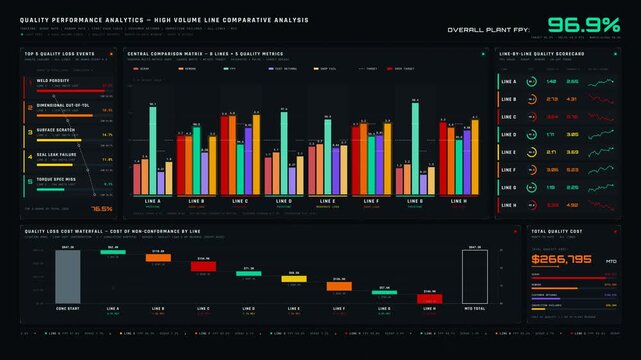
4K production performance dashboard comparing quality losses across high volume lines with animated bar charts and cost waterfall analysis. for commercial creative technology and business use.
00:15
HD
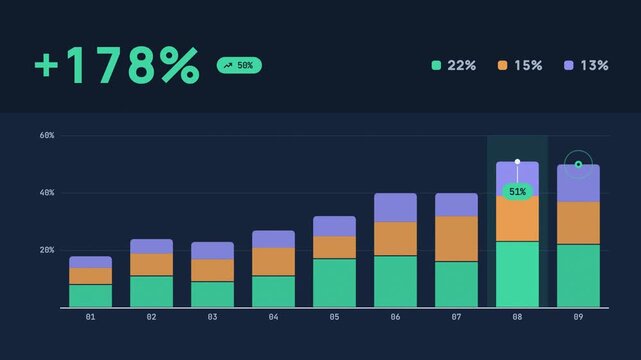
Three stacked bar charts compare rising percentage values across nine numbered intervals, with green orange and violet segments arranged on a dark navy background
00:10
HD
psdt Bento Box Business Infographic Template For Dashboard Report, KPI Metrics, Data Visualization

Animation of multiple charts visualizing the analysis of large amounts of data
00:14
HD
ait Bento Box Business Infographic Template For Dashboard Report, KPI Metrics, Data Visualization